. 2024 Jul 17;16(14):2568.
doi: 10.3390/cancers16142568.

Impact of Genomic Mutation on Melanoma Immune Microenvironment and IFN-1 Pathway-Driven Therapeutic Responses

Affiliations

Impact of Genomic Mutation on Melanoma Immune Microenvironment and IFN-1 Pathway-Driven Therapeutic Responses

Fátima María Mentucci et al. Cancers (Basel). .

Abstract

The BRAFV600E mutation, found in approximately 50% of melanoma cases, plays a crucial role in the activation of the MAPK/ERK signaling pathway, which promotes tumor cell proliferation. This study aimed to evaluate its impact on the melanoma immune microenvironment and therapeutic responses, particularly focusing on immunogenic cell death (ICD), a pivotal cytotoxic process triggering anti-tumor immune responses. Through comprehensive in silico analysis of the Cancer Genome Atlas data, we explored the association between the BRAFV600E mutation, immune subtype dynamics, and tumor mutation burden (TMB). Our findings revealed that the mutation correlated with a lower TMB, indicating a reduced generation of immunogenic neoantigens. Investigation into immune subtypes reveals an exacerbation of immunosuppression mechanisms in BRAFV600E-mutated tumors. To assess the response to ICD inducers, including doxorubicin and Me-ALA-based photodynamic therapy (PDT), compared to the non-ICD inducer cisplatin, we used distinct melanoma cell lines with wild-type BRAF (SK-MEL-2) and BRAFV600E mutation (SK-MEL-28, A375). We demonstrated a differential response to PDT between the WT and BRAFV600E cell lines. Further transcriptomic analysis revealed upregulation of IFNAR1, IFNAR2, and CXCL10 genes associated with the BRAFV600E mutation, suggesting their involvement in ICD. Using a gene reporter assay, we showed that PDT robustly activated the IFN-1 pathway through cGAS-STING signaling. Collectively, our results underscore the complex interplay between the BRAFV600E mutation and immune responses, suggesting a putative correlation between tumors carrying the mutation and their responsiveness to therapies inducing the IFN-1 pathway, such as the ICD inducer PDT, possibly mediated by the elevated expression of IFNAR1/2 receptors.

Keywords: BRAFV600E; IFN-1 pathway; cGAS-STING; immunogenic cell death.


Conflict of interest statement

The authors declare no conflicts of interest. The funders had no role in the design of the study; in the collection, analyses, or interpretation of data; in the writing of the manuscript, or in the decision to publish the results.

Figures

Figure 1
Figure 1
Genetic and immunological landscape of BRAF mutations in SKCM. (A) Distribution of mutation frequencies in BRAF among skin cutaneous melanoma (SKCM) patients, sourced from cBioPortal (TCGA Pan-Cancer Atlas dataset). (B) Dot plot showing tumor mutational burden (TMB) comparison between BRAF wild type (WT) (n = 175) and BRAF V600E (n = 125) mutations in SKCM, quantified by the number of proteins carrying non-synonymous mutations. Statistical analysis was conducted using the Student t-test for unmatched samples: * p < 0.05. (C) Mutation frequency distribution in BRAF among SKCM patients, sourced from Xena (TCGA Pan-Cancer Atlas dataset). (D) Bar plot showing the classification of immune subtypes in SKCM patients based on BRAF WT (n = 48) and BRAF V600E (n = 49) mutations.
Figure 2
Figure 2
Response variation of melanoma cell lines to immunogenic cell death inducers and associated gene expression profiles in the context of BRAF mutation. Melanoma cell lines with BRAF wild-type (SK-MEL-2, pink line) or BRAF V600E mutations (SK-MEL-28 and A375, black lines) were exposed to increasing doses of the ICD inducers: (A) photodynamic therapy (PDT): cells were first incubated with increasing doses of the pro-drug Me-ALA (0–2 mM) for 4 h, followed by irradiation with a light dose of 1 J/cm2 (λ: 636 nm); (B) doxorubicin (DXR): cells were incubated to increasing doses of the chemotherapeutic (0–12 µg/mL) for 24 h; (C) cisplatin (CP): cells were incubated to increasing doses of the chemotherapeutic (0–800 µg/mL) for 24 h. Cell viability was assessed 24 h after treatment using the resazurin assay and expressed as a percentage of non-treated cells (100% represented by the dotted line). Dose–response curves were generated using non-linear regression analysis (GraphPad Prism). (D) Heatmap illustrating mRNA expression levels of genes associated with immunogenic cell death (ICD), particularly DAMPs or their modulators, in BRAF wild-type (n = 175) and BRAF V600E (n = 125) melanoma samples sourced from cBioPortal (TCGA Pan-Cancer Atlas dataset). Statistical analysis was conducted using the Student t-test for unmatched samples: *** p < 0.0001. * p < 0.05. (E) Dot plots showing mRNA expression levels of genes with statistically significant differences in BRAF V600E samples compared to BRAF wild-type samples. Statistical analysis was conducted using the Student t-test for unmatched samples: **** p < 0.0001. * p < 0.05.
Figure 3
Figure 3
Assessment of IFN-1 Pathway Activation in Melanoma Cells Exposed to Immunogenic and Non-Immunogenic Cell Death Inducers. (A) Gene reporter assay was performed using the IFN-1 pathway reporter cell line SK-MEL-2-IFN exposed to the non-ICD inducer cisplatin (CP) (800 µg/mL) for 24 h. GFP expression on live cells was quantified from flow cytometry data using FlowJo. Data is presented as the percentage of GFP-positive (GFP+) cells representing IFN-1 pathway activation (left), with analysis of the level of IFN-1 activation in GFP+ positive cells performed from GeoMean data (center), all normalized to values corresponding to untreated cells (100% represented by the dotted line). Statistical analysis was conducted using the Student t-test for unmatched samples: ** p < 0.01. Representative histograms are shown (right). (B) Gene reporter assay was performed using the IFN-1 pathway reporter cell line SK-MEL-2-IFN exposed to the immunogenic cell death (ICD) inducer doxorubicin (DXR) (6 µg/mL) for 24 h. GFP expression on live cells was quantified from flow cytometry data using FlowJo. Data is presented as the percentage of GFP-positive (GFP+) cells representing IFN-1 pathway activation (left), with analysis of the level of IFN-1 activation in GFP+ positive cells performed from GeoMean data (center), all normalized to values corresponding to untreated cells (100% represented by the dotted line). Statistical analysis was conducted using the Student t-test for unmatched samples: absence of asterisks indicates a statistically non-significant difference. Representative histograms are shown (right). (C) Gene reporter assay was performed using the IFN-1 pathway reporter cell line SK-MEL-2-IFN exposed to the ICD inducer photodynamic therapy (PDT). Cells were first incubated with the pro-drug Me-ALA (1 mM) for 4 h, followed by irradiation with a light dose of 1 J/cm2 (λ: 636 nm). GFP expression on live cells was quantified from flow cytometry data using FlowJo. Data is presented as the percentage of GFP-positive (GFP+) cells representing IFN-1 pathway activation (left), with analysis of the level of IFN-1 activation in GFP+ positive cells performed from GeoMean data (center), all normalized to values corresponding to untreated cells (100% represented by the dotted line). Statistical analysis was conducted using the Student t-test for unmatched samples: ** p < 0.01. Representative histograms are shown (right).
Figure 4
Figure 4
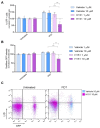
Modulation of IFN-1 Pathway Activation by PDT mediated by cGAS-STING signaling. Gene reporter assay was performed using the IFN-1 pathway reporter cell line SK-MEL-2-IFN exposed to the immunogenic cell death (ICD) inducer photodynamic therapy (PDT) in the presence or absence of the STING inhibitor H151 (1 mM and 10 mM). Cells were first incubated with the pro-drug Me-ALA (1 mM) for 4 h with or without H151 or vehicle (DMSO), followed by irradiation with a light dose of 1 J/cm2 (λ: 636 nm). GFP expression on live cells (L/D negative), indicative of IFN-1 pathway activation, was quantified from flow cytometry data using FlowJo. The data is presented as the percentage of GFP-positive (GFP+) cells representing IFN-1 pathway activation (A), with analysis of the level of IFN-1 activation in GFP+ positive cells performed from GeoMean data (B), all normalized to values corresponding to untreated cells (100% represented by the dotted line). Statistical analysis was conducted using two-way ANOVA with Tukey’s post hoc test: ** p < 0.01, *** p < 0.001. Representative dot plots are shown (C).

Similar articles

Cited by

References

    1. Long G.V., Swetter S.M., Menzies A.M., Gershenwald J.E., Scolyer R.A. Cutaneous Melanoma. Lancet. 2023;402:485–502. doi: 10.1016/S0140-6736(23)00821-8. - DOI - PubMed
    1. Akbani R., Akdemir K.C., Aksoy B.A., Albert M., Ally A., Amin S.B., Arachchi H., Arora A., Auman J.T., Ayala B., et al. Genomic Classification of Cutaneous Melanoma. Cell. 2015;161:1681–1696. doi: 10.1016/j.cell.2015.05.044. - DOI - PMC - PubMed
    1. Ascierto P.A., Kirkwood J.M., Grob J.J., Simeone E., Grimaldi A.M., Maio M., Palmieri G., Testori A., Marincola F.M., Mozzillo N. The Role of BRAF V600 Mutation in Melanoma. J. Transl. Med. 2012;10:85. doi: 10.1186/1479-5876-10-85. - DOI - PMC - PubMed
    1. Mahumud R.A., Shahjalal M. The Emerging Burden of Genetic Instability and Mutation in Melanoma: Role of Molecular Mechanisms. Cancers. 2022;14:6202. doi: 10.3390/cancers14246202. - DOI - PMC - PubMed
    1. Kazandjian S., Rousselle E., Dankner M., Cescon D.W., Spreafico A., Ma K., Kavan P., Batist G., Rose A.A.N. The Clinical, Genomic, and Transcriptomic Landscape of BRAF Mutant Cancers. Cancers. 2024;16:445. doi: 10.3390/cancers16020445. - DOI - PMC - PubMed

LinkOut - more resources