. 2024 Jul 20;16(14):2595.
doi: 10.3390/cancers16142595.

Fibroblasts Promote Resistance to KRAS Silencing in Colorectal Cancer Cells

Affiliations

Fibroblasts Promote Resistance to KRAS Silencing in Colorectal Cancer Cells

Susana Mendonça Oliveira et al. Cancers (Basel). .

Abstract

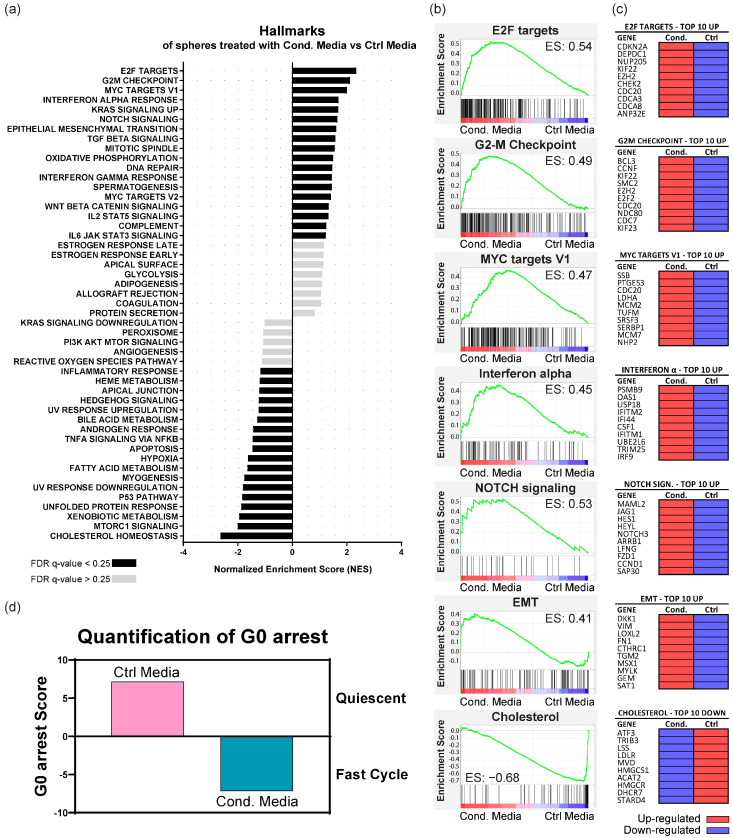
Colorectal cancer (CRC) responses to KRAS-targeted inhibition have been limited due to low response rates, the mechanisms of which remain unknown. Herein, we explored the cancer-associated fibroblasts (CAFs) secretome as a mediator of resistance to KRAS silencing. CRC cell lines HCT15, HCT116, and SW480 were cultured either in recommended media or in conditioned media from a normal colon fibroblast cell line (CCD-18Co) activated with rhTGF-β1 to induce a CAF-like phenotype. The expression of membrane stem cell markers was analyzed by flow cytometry. Stem cell potential was evaluated by a sphere formation assay. RNAseq was performed in KRAS-silenced HCT116 colonospheres treated with either control media or conditioned media from CAFs. Our results demonstrated that KRAS-silencing up-regulated CD24 and down-regulated CD49f and CD104 in the three cell lines, leading to a reduction in sphere-forming efficiency. However, CAF-secreted factors restored stem cell marker expression and increased stemness. RNA sequencing showed that CAF-secreted factors up-regulated genes associated with pro-tumorigenic pathways in KRAS-silenced cells, including KRAS, TGFβ, NOTCH, WNT, MYC, cell cycle progression and exit from quiescence, epithelial-mesenchymal transition, and immune regulation. Overall, our results suggest that resistance to KRAS-targeted inhibition might derive not only from cell-intrinsic causes but also from external elements, such as fibroblast-secreted factors.

Keywords: KRAS; cancer stemness; colorectal cancer; epithelial-mesenchymal transition; fibroblasts; therapy resistance.


Conflict of interest statement

The authors declare no conflict of interest. A.S.R. contributed to this work while previously affiliated with i3S and IPATIMUP. A.S.R. is currently affiliated with and employed by Novartis. Novartis did not fund or contribute to this work.

Figures

Figure 1
Figure 1
Characterization of the basal levels of stem cell marker expression in CRC cell lines by flow cytometry. Mean and standard deviation are represented in each bar. Each dot represents a biological replicate. (a) Percentage of positive cells; (b) Absolute median fluorescence intensity (MFI).
Figure 2
Figure 2
Stem cell marker expression by flow cytometry in CRC cell lines after KRAS silencing. For all cell lines, normality of the data was tested using Shapiro-Wilk normality test. A one-tailed paired t-test was performed, testing for a p-value < 0.05. The symbols *, **, ***, and **** were used to denote levels 0.05, 0.01, 0.001, and 0.0001 of statistical significance, respectively. For the samples that did not follow normality, a Wilcoxon matched-pairs signed rank test was used. Mean and standard deviation are represented in each bar. Each dot represents a biological replicate. (a) Percentage of positive cells; (b) Absolute median fluorescence intensity (MFI).
Figure 3
Figure 3
Stem cell marker expression by flow cytometry in CRC cell lines after KRAS silencing, plus treatment with conditioned media from fibroblasts. For all cell lines, normality of the data was tested using Shapiro-Wilk normality test. A one-tailed paired t-test was performed, testing for a p-value < 0.05. The symbols * and ** were used to denote levels 0.05 and 0.01 of statistical significance, respectively. For the samples that did not follow normality, a Wilcoxon matched-pairs signed rank test was used. Mean and standard deviation are represented in each bar. Each dot represents a biological replicate. (a) Percentage of positive cells; (b) Absolute median fluorescence intensity.
Figure 4
Figure 4
Sphere formation assay of CRC cell lines after silencing with siControl or siKRAS. For all cell lines, normality of the data was tested using a Shapiro-Wilk normality test, and a one-tailed Paired t-test was performed, testing for a p-value < 0.05 (symbol * denotes level 0.05 of statistical significance). Mean and standard deviation are represented in each bar. Each dot represents a biological replicate. (a) Sphere forming efficiency (SFE) percentage after treatment with sphere formation assay medium; (b) SFE percentage after treatment with conditioned media from activated fibroblasts (CM).
Figure 5
Figure 5
RNAseq analysis of KRAS-silenced HCT116 spheres treated with conditioned media of activated fibroblasts (Cond. Media) against control media (Ctrl Media). (a) Results of GSEA Hallmark analysis showing enriched gene sets. Black bars indicate significant enrichment at a false discovery rate (FDR) < 25%, while gray bars represent gene sets with FDR > 25%. A positive normalized enrichment score (NES) value indicates enrichment in the cells treated with conditioned media of fibroblasts, whereas a negative NES indicates enrichment in the cells treated with control media; (b) Enrichment plots for the most relevant data sets enriched in GSEA Hallmark analysis, showing the profile of the running enrichment score (ES) and positions of gene set members on the rank-ordered list; (c) Tables showing the top 10 enriched genes in each data set. Red indicates up-regulation of the gene, while purple indicates down-regulation; (d) Quantification of G0 arrest. Positive values indicate that cells are in a quiescent state, whereas negative values identify cells that are in a proliferative cycle phase.
Figure 6
Figure 6
Fibroblast-mediated resistance to KRAS-targeted therapies: possible clinical implications. The combination of our current and previous results leads us to hypothesize two possible forms of resistance mechanisms mediated by the action of fibroblasts: innate and acquired. Innate resistance occurs in fibroblast-rich tumors, such as those from CMS4, that can inherently withstand KRAS inhibition through the support provided by resident fibroblasts. Conversely, acquired resistance may develop in initially fibroblast-poor tumors that recruit and activate fibroblasts in response to KRAS inhibition, altering the tumor microenvironment to its advantage. Both scenarios ultimately lead to resistance to KRAS-targeted therapies.

References

    1. Arrington A.K., Heinrich E.L., Lee W., Duldulao M., Patel S., Sanchez J., Garcia-Aguilar J., Kim J. Prognostic and Predictive Roles of KRAS Mutation in Colorectal Cancer. Int. J. Mol. Sci. 2012;13:12153–12168. doi: 10.3390/ijms131012153. - DOI - PMC - PubMed
    1. Huang L., Guo Z., Wang F., Fu L. KRAS Mutation: From Undruggable to Druggable in Cancer. Signal Transduct. Target. Ther. 2021;6:386. doi: 10.1038/s41392-021-00780-4. - DOI - PMC - PubMed
    1. Salgia R., Pharaon R., Mambetsariev I., Nam A., Sattler M. The Improbable Targeted Therapy: KRAS as an Emerging Target in Non-Small Cell Lung Cancer (NSCLC) Cell Rep. Med. 2021;2:100186. doi: 10.1016/j.xcrm.2020.100186. - DOI - PMC - PubMed
    1. Patricelli M.P., Janes M.R., Li L.S., Hansen R., Peters U., Kessler L.V., Chen Y., Kucharski J.M., Feng J., Ely T., et al. Selective Inhibition of Oncogenic KRAS Output with Small Molecules Targeting the Inactive State. Cancer Discov. 2016;6:316–329. doi: 10.1158/2159-8290.CD-15-1105. - DOI - PubMed
    1. Moore A.R., Rosenberg S.C., McCormick F., Malek S. RAS-Targeted Therapies: Is the Undruggable Drugged? Nat. Rev. Drug Discov. 2020;19:533–552. doi: 10.1038/s41573-020-0068-6. - DOI - PMC - PubMed

LinkOut - more resources