. 2024 Jul 17;14(14):1545.
doi: 10.3390/diagnostics14141545.

The Surviving, Not Thriving, Photoreceptors in Patients with ABCA4 Stargardt Disease

Affiliations

The Surviving, Not Thriving, Photoreceptors in Patients with ABCA4 Stargardt Disease

Hanna De Bruyn et al. Diagnostics (Basel). .

Abstract

Stargardt disease (STGD1), associated with biallelic variants in the ABCA4 gene, is the most common heritable macular dystrophy and is currently untreatable. To identify potential treatment targets, we characterized surviving STGD1 photoreceptors. We used clinical data to identify macular regions with surviving STGD1 photoreceptors. We compared the hyperreflective bands in the optical coherence tomographic (OCT) images that correspond to structures in the STGD1 photoreceptor inner segments to those in controls. We used adaptive optics scanning light ophthalmoscopy (AO-SLO) to study the distribution of cones and AO-OCT to evaluate the interface of photoreceptors and retinal pigment epithelium (RPE). We found that the profile of the hyperreflective bands differed dramatically between patients with STGD1 and controls. AO-SLOs showed patches in which cone densities were similar to those in healthy retinas and others in which the cone population was sparse. In regions replete with cones, there was no debris at the photoreceptor-RPE interface. In regions with sparse cones, there was abundant debris. Our results raise the possibility that pharmaceutical means may protect surviving photoreceptors and so mitigate vision loss in patients with STGD1.

Keywords: Stargardt disease; inherited retinal disease; mitochondria; optical coherence tomography adaptive optics; photoreceptors; retina; retinal imaging.


Conflict of interest statement

M.M. (Mircea Mujat): Physical Sciences Inc. (PSI) (E, P). All other authors: no conflicts of interest.

Figures

Figure A1
Figure A1
Biochemical characterization of the Val989Ala variant associated with Stargardt disease. WT ABCA4 and the Val989Ala variant were expressed in HEK293T cells. (A) Protein expression levels were determined on Western blots labeled for ABCA4. The Val989Ala expression was 70% that of WT ABCA4. (B) The ATPase activity of purified WT and the Val989Ala variant was determined at the same protein concentration in the absence (−) and presence (+) of all-trans-retinal (ATR). Data are expressed relative to WT ABCA4 in the absence of ATR. A small but significant (p < 0.05) activation by ATR was observed for the Val989Ala variant. Data show SD for n = 3 independent experiments.
Figure A2
Figure A2
Fovea OCT image from the right eye from a healthy normal control overlaid on their fundus photo. Note the intact layers of the retina and how their fixation in the fixation plot is centered in their foveola, and the Bivariate Contour Ellipse (BCEA) is small (63% BCEA: 0.4° × 0.3°, area = 0.1°2, angle = −6.5°).
Figure A3
Figure A3
Fovea OCT image from the right eye from Patient 4 overlaid on fundus photo at age 16.8 years old. * marks the patient’s fixation during adaptive optics testing session. The fixation plot taken from their MAIA exam at 25 years confirms this fixation location (63% BCEA: 0.5° × 3.9°, area = 1.7°2, angle = 87.3°). + on the fundus marks the fovea as shown in OCT slice.
Figure A4
Figure A4
Fovea OCT image from the left eye from Patient 5 overlaid on fundus photo at age 58 years old. The fixation plot taken from their MAIA exam at 60 years confirms this fixation location (63% BCEA: 1.2° × 4.1°, area = 3.8°2, angle = 77.7°). Note how the patient is able to fixate centrally due to foveal sparing.
Figure 1
Figure 1
Photoreceptor (PR), retinal pigment epithelium (RPE), and ABCA4 protein. (A) The PR and RPE have close structural and functional relationships. ABCA4 protein is located in the rim of the discs of the photoreceptor outer segment. In the photoreceptor’s inner segment is the ellipsoid zone (EZ), which has abundant mitochondria (Mito), which are needed to support the high energy demands of the photoreceptor. Also, at the level of the PR inner segment, adherens junctions form the external limiting membrane (ELM), one of the OCT hyperreflective bands. Images were adapted from Scortecci et al. [14] and Steinberg et al. [15]. (B) This diagram of ABCA4 protein highlights its functional domains and indicates the site of variants found in our patients. The extracellular domains 1 and 2 (ECD1, ECD2) reside in the lumen, while the transmembrane domains 1 and 2 (TMD1, TMD2) are embedded in the lipid bilayer of the disc. The nucleotide-binding domains 1 and 2 (NBD1, NBD2) are in the cytosol [16]. In Patient 1, R2038W and Q2190R are on the same allele; on the other allele, there is a deep intronic variant resulting in complete protein loss. Patient 2 and Patient 3 have C1490Y on one allele; their other allele contains a deep intronic variant. In Patient 4, the two variants are V989A and E2096K, and in Patient 5, the two variants are G863A and G1961E, which are located as indicated. See Table 1, as well. For details about variants and genotypes, please see Appendix A.
Figure 2
Figure 2
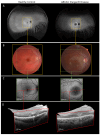
Retinal images of right eye. Left column: healthy Control 1. Right column: Patient 1. (A) Fundus autofluorescence (200°; California; Optos, Dunfermline, Scotland, UK); (B) color fundus photograph (45°; TRC-NW8F; Topcon Corporation, Tokyo, Japan); (C) blue autofluorescent image (30°; HRA + OCT Spectralis; Heidelberg Engineering, Heidelberg, Germany); (D) horizontal OCT showing the 30/61 b-scan slice (30°; HRA + OCT Spectralis; Heidelberg Engineering, Heidelberg, Germany). The dotted box in A indicates the region shown in (B). The dotted box in (B) indicates the region imaged in (C). The box in (C) indicates the region shown in (D). In (C), the dashed red line indicates the site of the OCT slice, as shown in (D). In the control, the OCT slice, bound by the red rectangle, has a dark band, the outer nuclear layer (ONL), representing photoreceptor nuclei; the ONL normally widens in subfoveal retina (white arrow). In the patient with STGD1, the ONL is absent in subfoveal retina, and there is debris at the retina–pigment epithelium (RPE) interface.
Figure 3
Figure 3
Fundus photograph and horizontal transfoveal OCT image of asymptomatic patient (Patient 2, Table 1) with biallelic pathogenic changes in ABCA4. The photograph (left panel), as well as ophthalmoscopy, showed no signs of maculopathy. The OCT (right panel) shows thickened and hyperreflective ELM and indistinct EZ similar to that reported by others [19,20].
Figure 4
Figure 4
For each of the 3 patients (Patient 3, Patient 4, & Patient 5), from left to right we present, Fundus photograph, Flattened OCT images of retina nasal to the fovea for STGD1 and age- and sex- matched controls (See Table 1); the yellow boxes indicate the region of interest (ROI). The yellow arrow indicates the direction of the A-scan. In the right most panel the mitochondrial configuration within photoreceptors/aspect ratio (MCP/AR). Patient characteristics are shown in Table 1.
Figure 5
Figure 5
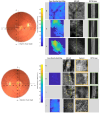
Healthy control 1. Far-left fundus photograph of a healthy control (right eye); location and size of AO Scan 1 and Scan 2 are as indicated. Left column—cone density heat maps. Center column—AO-SLO cone images with identified cones (green dots). Right column—OCT B-scan at the location indicated by the green line on the AO-SLO. AO imaging details are shown in Table 2.
Figure 6
Figure 6
Patient 4, right eye. Format is similar to that of Figure 5, with the zoom-in (yellow square on the AO-SLO) column added. * in the superior retina, at ~10° is the patient’s preferred retinal locus for fixation (PRL). AO imaging details are shown in Table 2.
Figure 7
Figure 7
Patient 5, both eyes. Top-right eye scan (DF). Bottom-left eye scan (GJ). Format is similar to that of Figure 6. AO imaging details are shown in Table 2.

References

    1. Li C.H.Z., Pas J.A.A.H., Corradi Z., Hitti-Malin R.J., Hoogstede A., Runhart E.H., Dhooge P.P.A., Collin R.W.J., Cremers F.P.M., Hoyng C.B. Study of Late-Onset Stargardt Type 1 Disease: Characteristics, Genetics, and Progression. Ophthalmology. 2024;131:87–97. doi: 10.1016/j.ophtha.2023.08.011. - DOI - PubMed
    1. Fujinami K., Waheed N., Laich Y., Yang P., Fujinami-Yokokawa Y., Higgins J.J., Lu J.T., Curtiss D., Clary C., Michaelides M. Stargardt Macular Dystrophy and Therapeutic Approaches. Br. J. Ophthalmol. 2024;108:495–505. doi: 10.1136/bjo-2022-323071. - DOI - PMC - PubMed
    1. Michaelides M., Hardcastle A.J., Hunt D.M., Moore A.T. Progressive Cone and Cone-Rod Dystrophies: Phenotypes and Underlying Molecular Genetic Basis. Surv. Ophthalmol. 2006;51:232–258. doi: 10.1016/j.survophthal.2006.02.007. - DOI - PubMed
    1. Michaelides M., Hunt D.M., Moore A.T. The Genetics of Inherited Macular Dystrophies. J. Med. Genet. 2003;40:641–650. doi: 10.1136/jmg.40.9.641. - DOI - PMC - PubMed
    1. Tanna P., Strauss R.W., Fujinami K., Michaelides M. Stargardt Disease: Clinical Features, Molecular Genetics, Animal Models and Therapeutic Options. Br. J. Ophthalmol. 2017;101:25–30. doi: 10.1136/bjophthalmol-2016-308823. - DOI - PMC - PubMed

LinkOut - more resources