. 2024 Jun 24;11(7):643.
doi: 10.3390/bioengineering11070643.

Radiomics and Deep Features: Robust Classification of Brain Hemorrhages and Reproducibility Analysis Using a 3D Autoencoder Neural Network

Affiliations

Radiomics and Deep Features: Robust Classification of Brain Hemorrhages and Reproducibility Analysis Using a 3D Autoencoder Neural Network

Salar Bijari et al. Bioengineering (Basel). .

Abstract

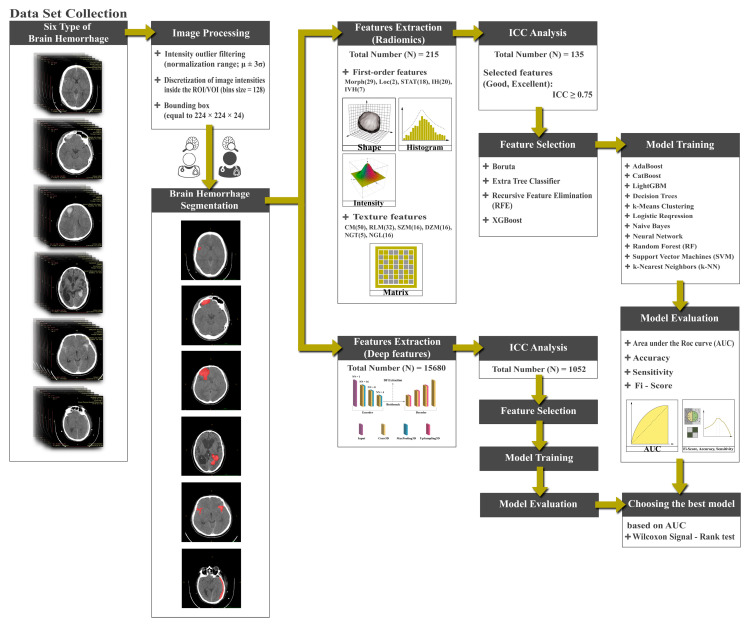
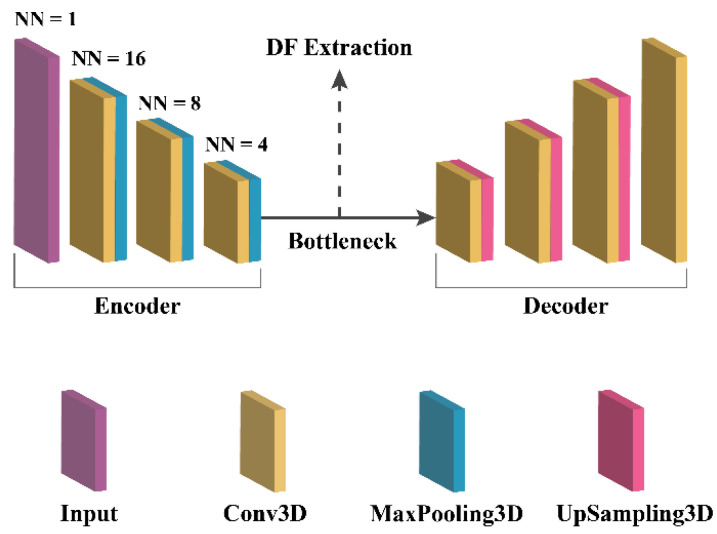
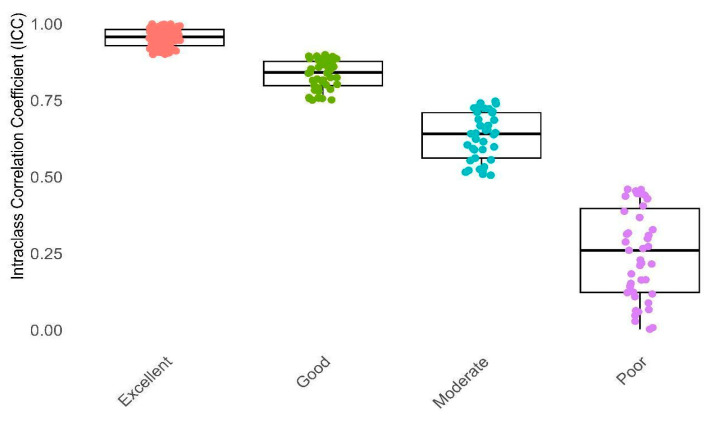
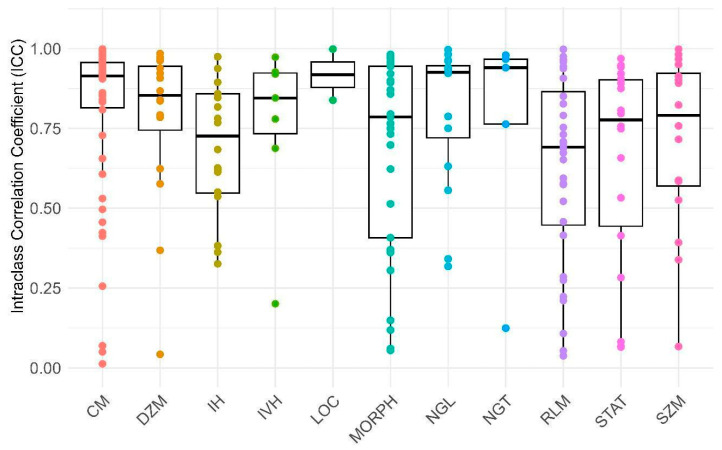
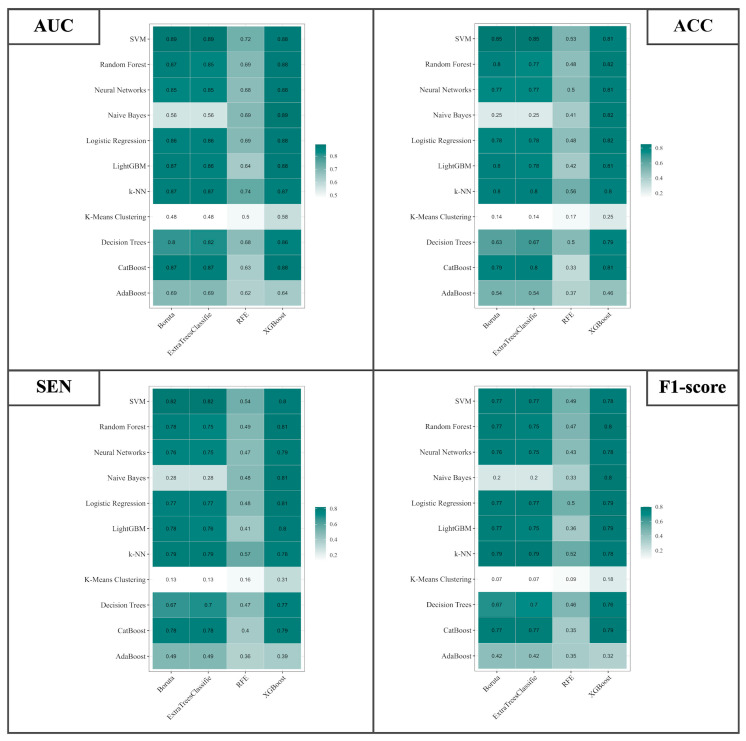
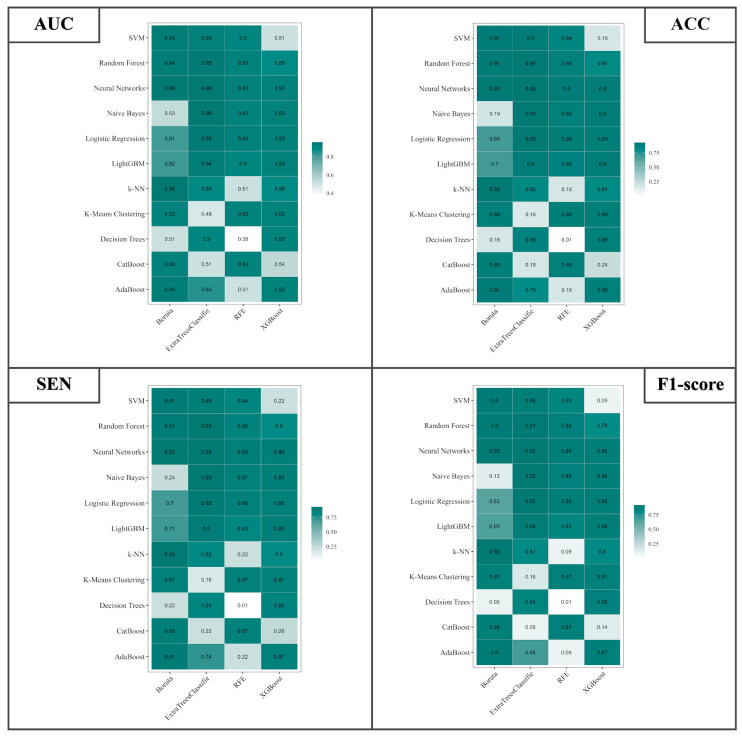
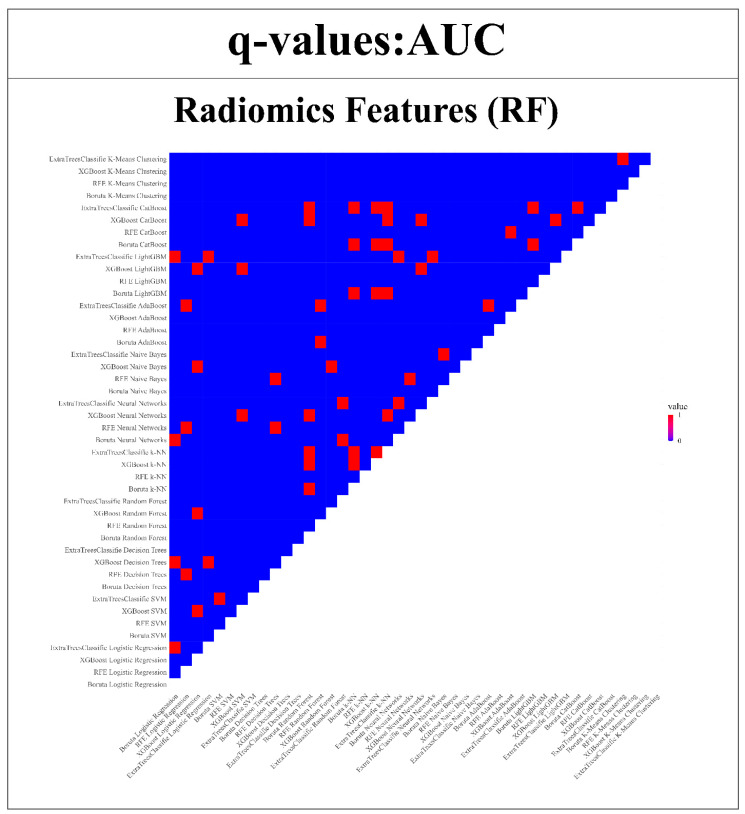
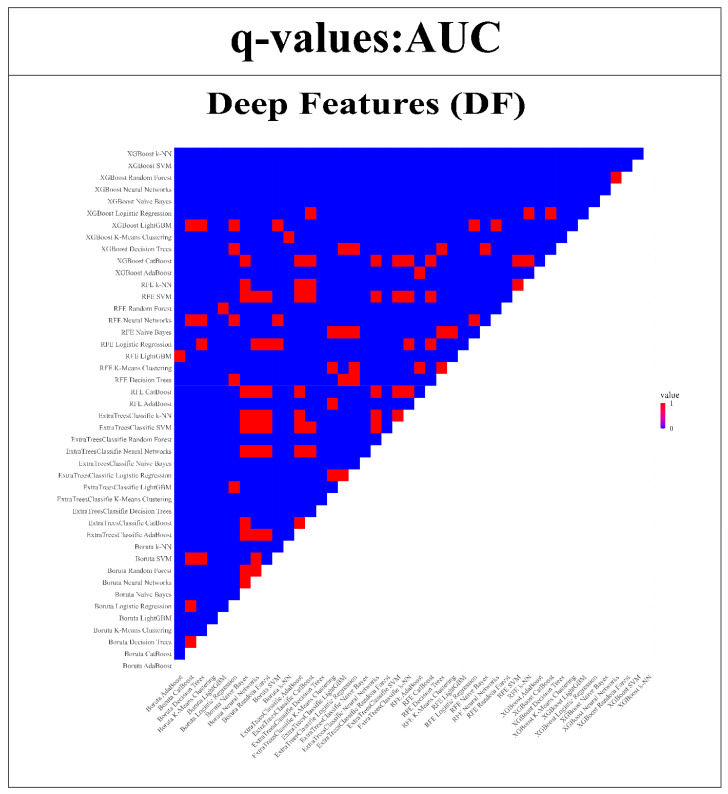
This study evaluates the reproducibility of machine learning models that integrate radiomics and deep features (features extracted from a 3D autoencoder neural network) to classify various brain hemorrhages effectively. Using a dataset of 720 patients, we extracted 215 radiomics features (RFs) and 15,680 deep features (DFs) from CT brain images. With rigorous screening based on Intraclass Correlation Coefficient thresholds (>0.75), we identified 135 RFs and 1054 DFs for analysis. Feature selection techniques such as Boruta, Recursive Feature Elimination (RFE), XGBoost, and ExtraTreesClassifier were utilized alongside 11 classifiers, including AdaBoost, CatBoost, Decision Trees, LightGBM, Logistic Regression, Naive Bayes, Neural Networks, Random Forest, Support Vector Machines (SVM), and k-Nearest Neighbors (k-NN). Evaluation metrics included Area Under the Curve (AUC), Accuracy (ACC), Sensitivity (SEN), and F1-score. The model evaluation involved hyperparameter optimization, a 70:30 train-test split, and bootstrapping, further validated with the Wilcoxon signed-rank test and q-values. Notably, DFs showed higher accuracy. In the case of RFs, the Boruta + SVM combination emerged as the optimal model for AUC, ACC, and SEN, while XGBoost + Random Forest excelled in F1-score. Specifically, RFs achieved AUC, ACC, SEN, and F1-scores of 0.89, 0.85, 0.82, and 0.80, respectively. Among DFs, the ExtraTreesClassifier + Naive Bayes combination demonstrated remarkable performance, attaining an AUC of 0.96, ACC of 0.93, SEN of 0.92, and an F1-score of 0.92. Distinguished models in the RF category included SVM with Boruta, Logistic Regression with XGBoost, SVM with ExtraTreesClassifier, CatBoost with XGBoost, and Random Forest with XGBoost, each yielding significant q-values of 42. In the DFs realm, ExtraTreesClassifier + Naive Bayes, ExtraTreesClassifier + Random Forest, and Boruta + k-NN exhibited robustness, with 43, 43, and 41 significant q-values, respectively. This investigation underscores the potential of synergizing DFs with machine learning models to serve as valuable screening tools, thereby enhancing the interpretation of head CT scans for patients with brain hemorrhages.

Keywords: brain; deep features; hemorrhage; machine learning; radiomics features; reproducible.


Conflict of interest statement

The authors declare no conflicts of interest.

Figures

Figure 1
Figure 1
Flowchart of the proposed approach.
Figure 2
Figure 2
Visualization of manual segmentation for hemorrhagic types, including CC, EDH, IPH, IVH, SAH, and SDH, labeled as (af) respectively, with hemorrhages marked in red.
Figure 3
Figure 3
3D autoencoder architecture.
Figure 4
Figure 4
This box plot illustrates Intraclass Correlation Coefficient (ICC) values categorized into four reliability groups: Poor, Moderate, Good, and Excellent. The X-axis distinguishes between these reliability categories, while the Y-axis represents the ICC values. Reliability categorization: Poor (ICC < 0.5), Moderate (0.5 ≤ ICC < 0.75), Good (0.75 ≤ ICC < 0.9), Excellent (ICC ≥ 0.9).
Figure 5
Figure 5
This box plot displays the Intraclass Correlation Coefficient (ICC) values for various reliability factors (RFs) related to every group of features. The X-axis represents the specific RFs, while the Y-axis indicates the corresponding ICC values. The abbreviations used are as follows: MORPH: morphology, LOC: location, STAT: statistic, IH: intensity histogram, IVH: intensity-volume histogram, CM: co-occurrence matrix, RLM: run length matrix, SZM: size zone matrix, DZM: distance zone matrix, NGT: neighboring gray tone, NGL: neighboring gray level.
Figure 6
Figure 6
Boruta’s feature selection method illustrating the significance of various features in the differential diagnosis of six types of brain hemorrhages: SDH, EDH, CC, SAH, IPH, and IVH. The three blue boxes represent the minimal, average, and maximal importance of the shadow attributes.Only confirmed features for which the importance was significantly larger than that of the shadow variables were chosen as the final selected features for constructing the radiomics model. A total of 69 radiomics features were selected to construct the radiomics model.
Figure 7
Figure 7
The ExtraTreesClassifier method showcasing the significance of various features in the differential diagnosis of six types of brain hemorrhage, namely, SDH, EDH, CC, SAH, IPH, and IVH. The ExtraTreesClassifier represents an ensemble tree-based machine learning approach that leverages randomization to mitigate variance and computational expenses, as compared to the Random Forest method. The importance values of features were ranked with respect to their role in the differential diagnosis of the six brain hemorrhage types. The figure highlights the most crucial features, which have been selected based on SHAP analysis.
Figure 8
Figure 8
The RFE technique showcasing the significance of various features in the differential diagnosis of six types of brain hemorrhages, namely, subdural hematoma (SDH), epidural hematoma (EDH), cerebral contusion (CC), subarachnoid hemorrhage (SAH), intraventricular hemorrhage (IVH), and intraparenchymal hemorrhage (IPH). The selection process systematically eliminates less relevant features one by one until reaching the optimal number required for peak performance. The features were ranked based on their importance values in the context of differentiating among the six types of brain hemorrhages. The figure highlights the most crucial features selected using the SHAP (SHapley Additive exPlanations) method.
Figure 9
Figure 9
The importance of various features in the differential diagnosis of six types of brain hemorrhage, namely, SDH, EDH, CC, SAH, IPH, and IVH. In essence, this depiction showcases the scores that signify the utility and value of each individual feature during the creation of the boosted decision trees within the model. The ranking of features is determined based on their importance values concerning the differentiation of the six brain hemorrhage types. Notably, the figure presents the most crucial features selected through the utilization of SHAP (SHapley Additive exPlanations).
Figure 10
Figure 10
Illustration of the AUC, ACC, SEN, and F1-Score for differential diagnosis of SDH, EDH, CC, SAH, IPH, and IVH using 4 different feature selection methods and 11 classifiers based on RFs.
Figure 11
Figure 11
Illustration of the AUC, ACC, SEN, and F1-Score for differential diagnosis of SDH, EDH, CC, SAH, IPH, and IVH using 4 different feature selection methods and 11 classifiers based on DFs.
Figure 12
Figure 12
Wilcoxon signed-rank test is used to compare the AUC of RFs models compared with all other 43 models. (Q-value > 0.05 = red, q-value ≤ 0.05 = blue).
Figure 13
Figure 13
Wilcoxon signed-rank test is used to compare the AUC of DFs models compared with all other 43 models. (Q-value > 0.05 = red, q-value ≤ 0.05 = blue).

Similar articles

Cited by

References

    1. Little J.R., Dial B., Bélanger G., Carpenter S. Brain hemorrhage from intracranial tumor. Stroke. 1979;10:283–288. doi: 10.1161/01.STR.10.3.283. - DOI - PubMed
    1. Hanley D.F. Intraventricular hemorrhage: Severity factor and treatment target in spontaneous intracerebral hemorrhage. Stroke. 2009;40:1533–1538. doi: 10.1161/STROKEAHA.108.535419. - DOI - PMC - PubMed
    1. Weisberg L.A. How to identify and manage brain hemorrhage. Postgrad. Med. 1990;88:169–175. doi: 10.1080/00325481.1990.11704735. - DOI - PubMed
    1. Kidwell C.S., Chalela J., Saver J.L., Hill M.D., Demchuk A., Butman J., Warach S. Comparison of MRI and CT for detection of acute intracerebral hemorrhage. JAMA. 2004;292:1823–1830. doi: 10.1001/jama.292.15.1823. - DOI - PubMed
    1. Heit J.J., Iv M., Wintermark M. Imaging of intracranial hemorrhage. J. Stroke. 2017;19:11. doi: 10.5853/jos.2016.00563. - DOI - PMC - PubMed

LinkOut - more resources