

Understanding the Temporal Dynamics of Accelerated Brain Aging and Resilient Brain Aging: Insights from Discriminative Event-Based Analysis of UK Biobank Data
- PMID: 39061729
- PMCID: PMC11273398
- DOI: 10.3390/bioengineering11070647
Understanding the Temporal Dynamics of Accelerated Brain Aging and Resilient Brain Aging: Insights from Discriminative Event-Based Analysis of UK Biobank Data
Abstract
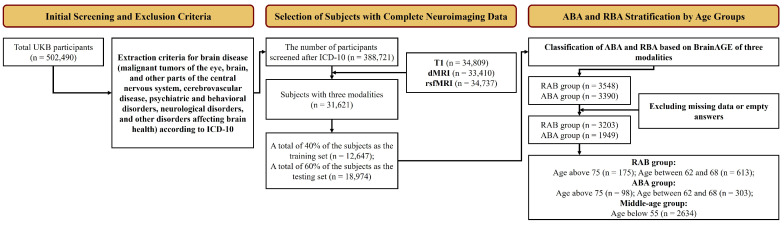
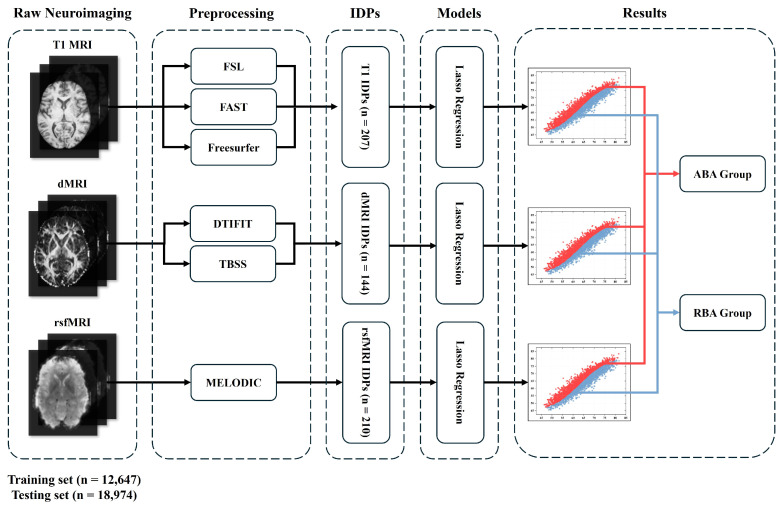
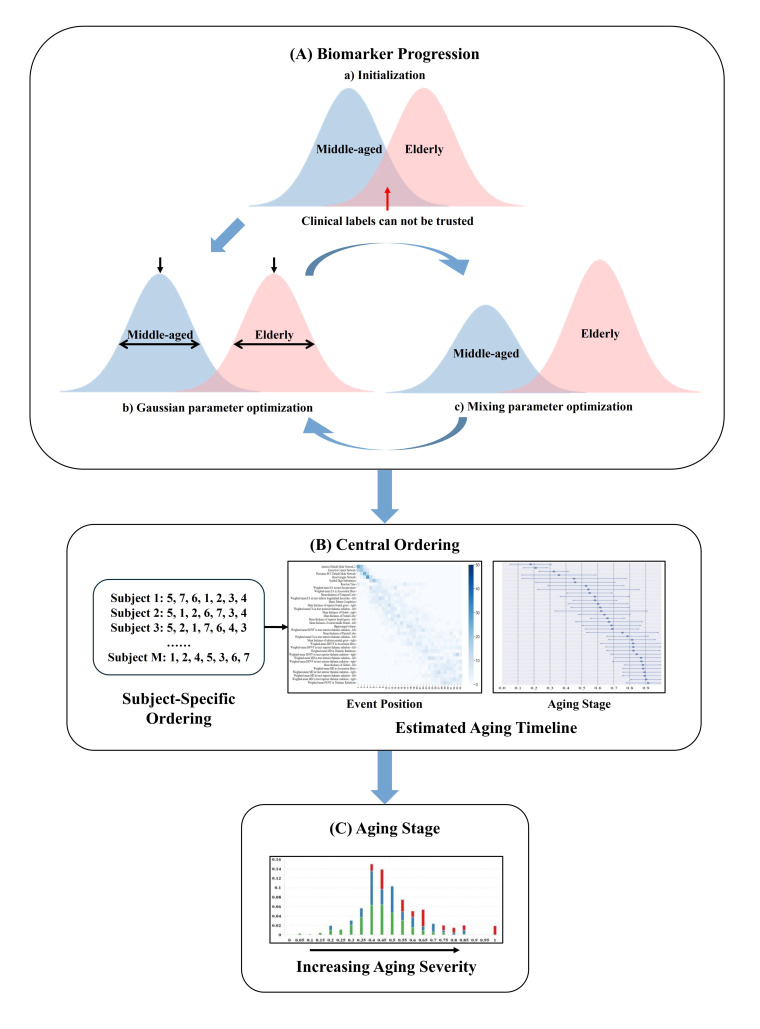
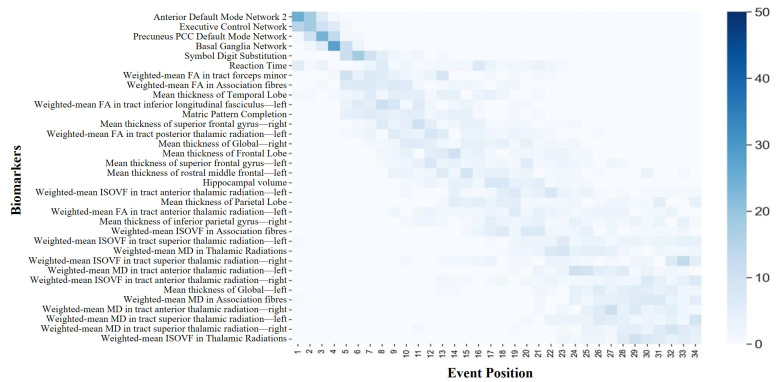
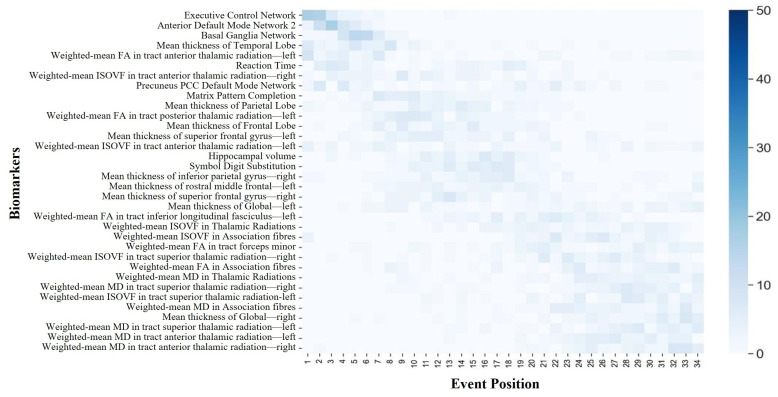
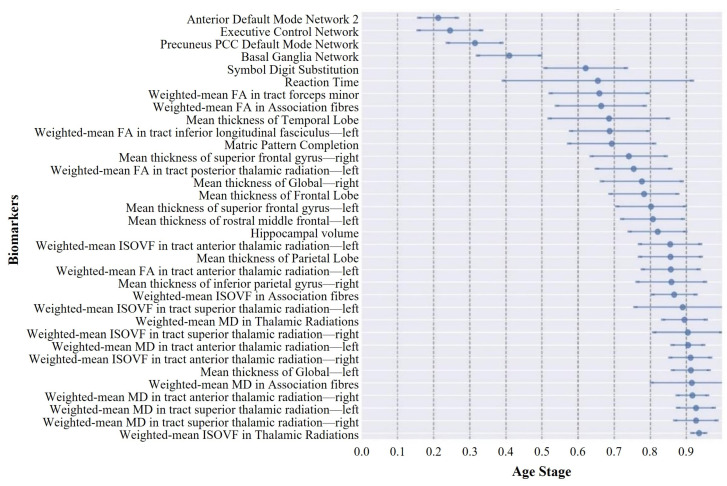
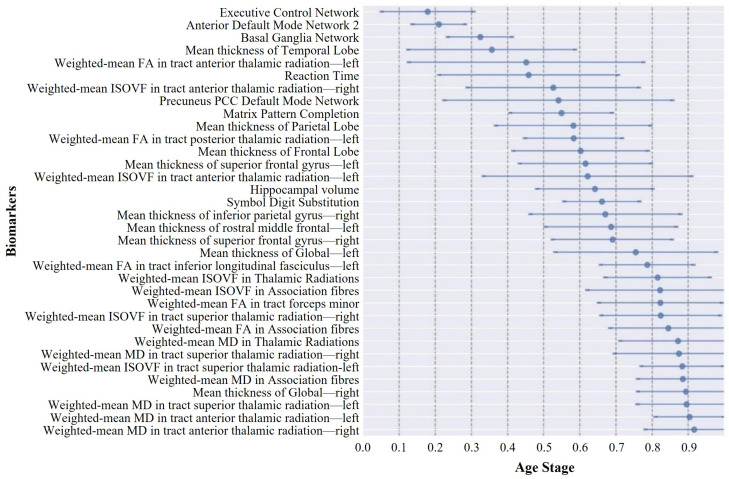
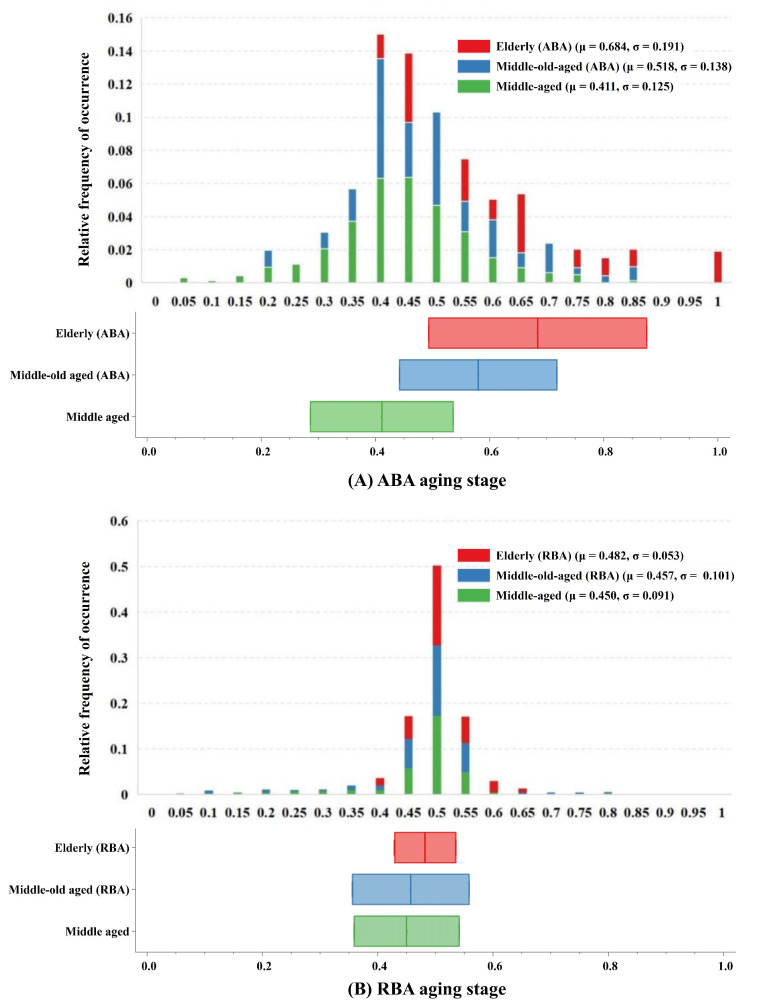
The intricate dynamics of brain aging, especially the neurodegenerative mechanisms driving accelerated (ABA) and resilient brain aging (RBA), are pivotal in neuroscience. Understanding the temporal dynamics of these phenotypes is crucial for identifying vulnerabilities to cognitive decline and neurodegenerative diseases. Currently, there is a lack of comprehensive understanding of the temporal dynamics and neuroimaging biomarkers linked to ABA and RBA. This study addressed this gap by utilizing a large-scale UK Biobank (UKB) cohort, with the aim to elucidate brain aging heterogeneity and establish the foundation for targeted interventions. Employing Lasso regression on multimodal neuroimaging data, structural MRI (sMRI), diffusion MRI (dMRI), and resting-state functional MRI (rsfMRI), we predicted the brain age and classified individuals into ABA and RBA cohorts. Our findings identified 1949 subjects (6.2%) as representative of the ABA subpopulation and 3203 subjects (10.1%) as representative of the RBA subpopulation. Additionally, the Discriminative Event-Based Model (DEBM) was applied to estimate the sequence of biomarker changes across aging trajectories. Our analysis unveiled distinct central ordering patterns between the ABA and RBA cohorts, with profound implications for understanding cognitive decline and vulnerability to neurodegenerative disorders. Specifically, the ABA cohort exhibited early degeneration in four functional networks and two cognitive domains, with cortical thinning initially observed in the right hemisphere, followed by the temporal lobe. In contrast, the RBA cohort demonstrated initial degeneration in the three functional networks, with cortical thinning predominantly in the left hemisphere and white matter microstructural degeneration occurring at more advanced stages. The detailed aging progression timeline constructed through our DEBM analysis positioned subjects according to their estimated stage of aging, offering a nuanced view of the aging brain's alterations. This study holds promise for the development of targeted interventions aimed at mitigating age-related cognitive decline.
Keywords: UK biobank; accelerated brain aging; brain age prediction; discriminative event-based analysis; multimodal neuroimaging; resilient brain aging.
Conflict of interest statement
The authors declare no conflicts of interest.
Figures
References
-
- Abellaneda-Pérez K., Cattaneo G., Cabello-Toscano M., Solana-Sánchez J., Mulet-Pons L., Vaqué-Alcázar L., Perellón-Alfonso R., Solé-Padullés C., Bargalló N., Tormos J.M., et al. Purpose in life promotes resilience to age-related brain burden in middle-aged adults. Alzheimer’s Res. Ther. 2023;15:49. doi: 10.1186/s13195-023-01198-6. - DOI - PMC - PubMed
Grants and funding
LinkOut - more resources
Full Text Sources
Miscellaneous
