. 2024 Jul 22;13(7):878.
doi: 10.3390/antiox13070878.

Ocular Inflammation and Oxidative Stress as a Result of Chronic Intermittent Hypoxia: A Rat Model of Sleep Apnea

Affiliations

Ocular Inflammation and Oxidative Stress as a Result of Chronic Intermittent Hypoxia: A Rat Model of Sleep Apnea

Nina Donkor et al. Antioxidants (Basel). .

Abstract

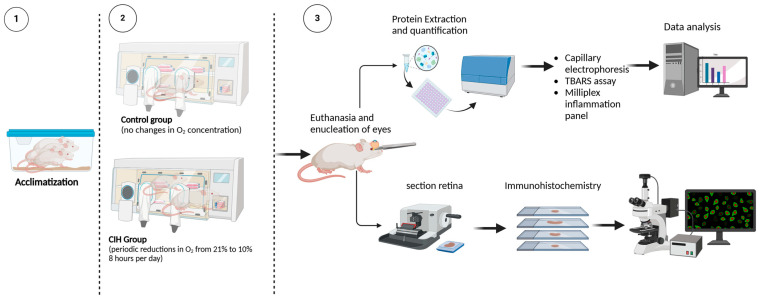
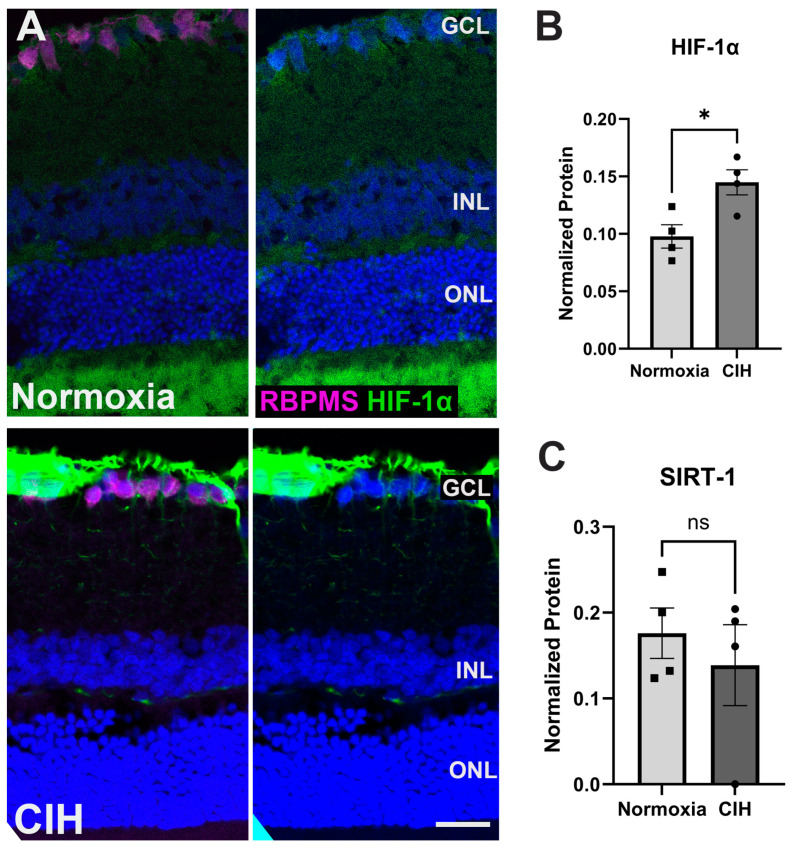
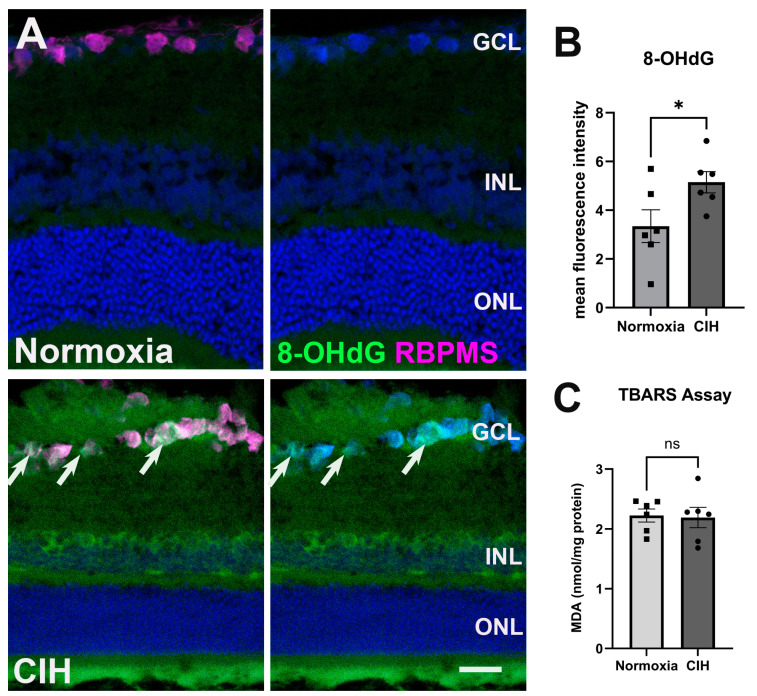
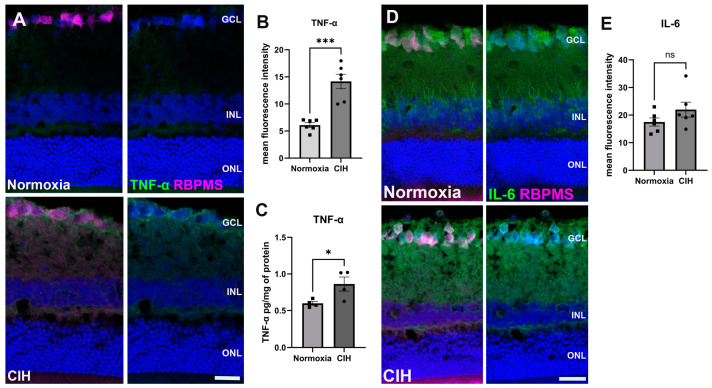
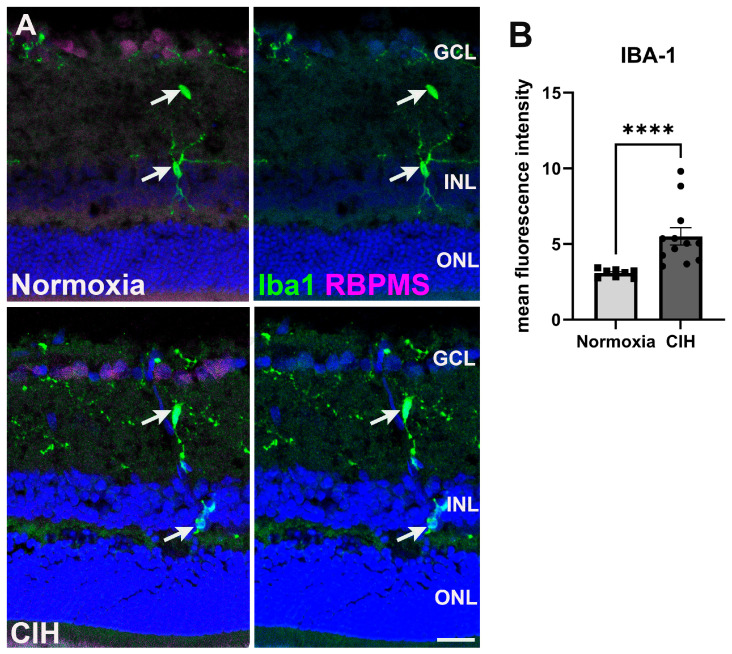
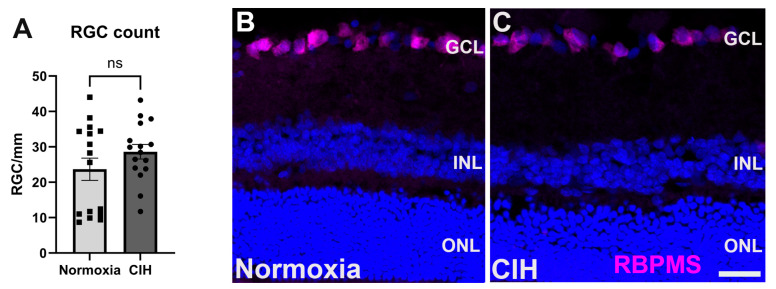
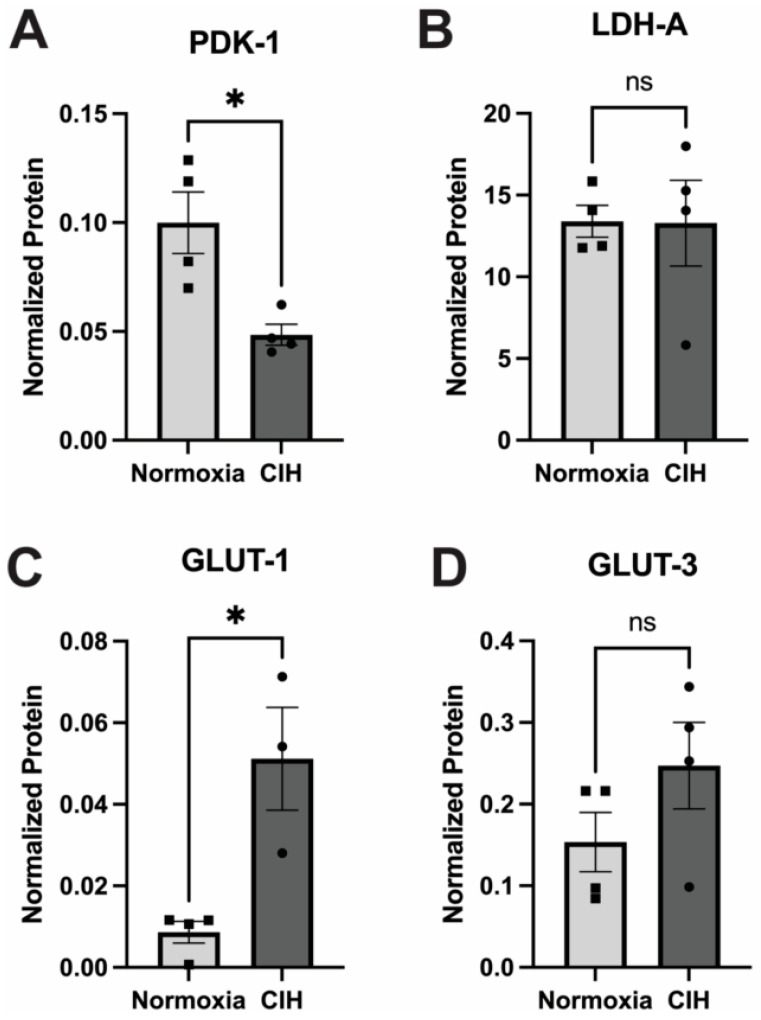
Obstructive sleep apnea (OSA) is a sleep disorder characterized by intermittent complete or partial occlusion of the airway. Despite a recognized association between OSA and glaucoma, the nature of the underlying link remains unclear. In this study, we investigated whether mild OSA induces morphological, inflammatory, and metabolic changes in the retina resembling those seen in glaucoma using a rat model of OSA known as chronic intermittent hypoxia (CIH). Rats were randomly assigned to either normoxic or CIH groups. The CIH group was exposed to periodic hypoxia during its sleep phase with oxygen reduction from 21% to 10% and reoxygenation in 6 min cycles over 8 h/day. The eyes were subsequently enucleated, and then the retinas were evaluated for retinal ganglion cell number, oxidative stress, inflammatory markers, metabolic changes, and hypoxic response modulation using immunohistochemistry, multiplex assays, and capillary electrophoresis. Statistically significant differences were observed between normoxic and CIH groups for oxidative stress and inflammation, with CIH resulting in increased HIF-1α protein levels, higher oxidative stress marker 8-OHdG, and increased TNF-α. Pyruvate dehydrogenase kinase-1 protein was significantly reduced with CIH. No significant differences were found in retinal ganglion cell number. Our findings suggest that CIH induces oxidative stress, inflammation, and upregulation of HIF-1α in the retina, akin to early-stage glaucoma.

Keywords: chronic intermittent hypoxia; glaucoma; inflammation; obstructive sleep apnea; oxidative stress.


Conflict of interest statement

The authors declare no conflicts of interest.

Figures

Figure 1
Figure 1
Experimental design. (1) Rats were randomly assigned to either normoxia or CIH treatment groups. Seven days before the initiation of the CIH protocol, the rats’ home cages were placed into Oxycycler chambers to acclimatize the rats to the chambers under normoxic conditions (21% oxygen). (2) CIH was performed for the CIH group over 8 h starting at 2100 h during the sleep phase of the circadian cycle. The protocol consisted of oxygen reduction from 21% (room air) to 10% oxygen, then returned to 21% oxygen in 6 min cycles per hour (10 cycles/hour) over 8 h/day. For the remaining 16 h, animals were exposed to room air. Normoxic control rats remained in the Oxycycler chambers with room air (21% oxygen) for the duration. (3) Upon completion of the CIH protocol, rats were euthanized and the retinas were analyzed for markers of inflammation and oxidative stress using immunohistochemistry, capillary electrophoresis, thiobarbituric acid reactive substance (TBARS) assay, and Milliplex immunoassay. Schematic created using BioRender.
Figure 2
Figure 2
(A) Representative immunohistochemistry images assessing expression of HIF-1α (green) in the normoxic (upper panels) and CIH group (lower panels). Sections were also immunolabeled for retinal ganglion cells (RBPMS, magenta) and cell nuclei (DAPI, blue). Scale bar = 50 μm. n (sample size) = 2 rats per group. (B) Capillary electrophoresis (CE) assessing the protein expression of HIF-1α in the CIH group compared to normoxia showed a significant increase in HIF-1α in the CIH group (* p = 0.0198). (C) SIRTUIN-1 (SIRT-1) expression was unchanged across groups (p = 0.5325), as measured by capillary electrophoresis; n = 4 rats per group. Error bars represent mean ± SEM. GCL = ganglion cell layer; INL = inner nuclear layer; ONL = outer nuclear layer. Electropherograms of HIF-1α and SIRTUIN-1 have been included as Supplementary Materials (Supplementary Figures S1 and S2).
Figure 3
Figure 3
CIH induces oxidative stress. (A) Representative images from immunohistochemistry assessing oxidative stress using an antibody directed against 8-OHdG (green) in the normoxic (upper panels) and CIH group (lower panels). Arrows (white) point to RGCs labeled with an antibody against RBPMS (magenta) in the GCL immunolabeled with 8-OHdG. Cell nuclei labeled with DAPI (blue). Scale bar = 50 μm, n = 2 rats per group. (B) Quantified fluorescence intensity of 8-OHdG showed increased nucleic acid-associated oxidative stress damage in the CIH compared to the normoxic group (* p = 0.0483). (C) A TBARS assay quantifying lipid peroxidation in the normoxic group compared to CIH showed no difference across groups (p = 0.8666); n = 6 per group. Error bars represent mean ± SEM. GCL = ganglion cell layer; INL = inner nuclear layer; ONL = outer nuclear layer.
Figure 4
Figure 4
CIH induces retinal inflammation. (A) Representative immunohistochemistry images showing the expression of the cytokine TNF-α (green) in the normoxic (upper panels) and CIH groups (lower panels). Retinas were colabeled with RBPMS, specific for retinal ganglion cells (magenta), and also stained with DAPI for cell nuclei (blue). (B) Quantification of fluorescence intensity showed increased expression of the cytokine TNF-α in the CIH group compared to normoxia control (*** p = 0.0002; n = 2 rats per group. (C) ELISA showed a significant increase in TNF-α in the CIH group over normoxia (* p = 0.0379, n = 4 rats per group). (D) IHC images of IL-6 (green) in the normoxic (upper panels) and CIH group (lower panels). RBPMS (magenta) and DAPI (blue). (E) Quantifying IL-6 fluorescence intensity showed comparable expression of IL-6 in both normoxia and CIH groups. Error bars represent mean ± SEM. GCL = ganglion cell layer; INL = inner nuclear layer; ONL = outer nuclear layer. Scale bar = 50 μm, n = 2 rats per group.
Figure 5
Figure 5
(A) Microglia immunolabeled using Iba-1 (green) in the normoxic (upper panels) and CIH group (lower panels). Retinal ganglion cells (magenta) and cell nuclei (DAPI, blue) are labeled for context. Arrows (white) point to Iba1-positive microglia somata. (B) Quantification of fluorescence intensity showed elevated levels of Iba-1 in the CIH group compared to the control (**** p = 0.0001). Error bars represent mean ± SEM. GCL = ganglion cell layer; INL = inner nuclear layer; ONL = outer nuclear layer. Scale bar = 50 μm, n = 2 rats per group.
Figure 6
Figure 6
(A) Quantification of RGC somata in the normoxic and CIH groups (p = 0.3414) shows that this degree of hypoxia is not sufficient to lead to RGC apoptosis. RGCs were counted in retinal sections, with each point representing a separate section; numbers are expressed as cells per mm of GCL length. (B) Representative immunolabeling from normoxia and (C) CIH retina with RGCs immunolabeled with RBPMS (magenta) and DAPI for cell nuclei (blue). Scale bar = 20 μm.
Figure 7
Figure 7
Effect of CIH on retinal metabolic enzymes and transporters as measured by capillary electrophoresis. (A) PDK-1 protein was significantly reduced in the CIH group retina compared to the control (* p = 0.03). (B) LDH-A protein levels were not affected by exposure to CIH (p = 0.9692). (C) The expression of GLUT-1 was significantly increased in CIH compared to the normoxia control group (* p = 0.0118). (D) GLUT-3 protein was not different across CIH and normoxia control groups (p = 0.2007). Error bars represent mean ± SEM; GCL = ganglion cell layer; INL = inner nuclear layer; ONL = outer nuclear layer; n = 4 rats per group. Electropherograms of LDH-A, PDK-1, GLUT1, and GLUT 3 have been included as Supplementary Materials (Supplementary Figures S3–S6).

Similar articles

Cited by

References

    1. Tham Y.-C., Li X., Wong T.Y., Quigley H.A., Aung T., Cheng C.-Y. Global Prevalence of Glaucoma and Projections of Glaucoma Burden through 2040: A Systematic Review and Meta-Analysis. Ophthalmology. 2014;121:2081–2090. doi: 10.1016/j.ophtha.2014.05.013. - DOI - PubMed
    1. Iwase A., Sawaguchi S., Araie M. Differentiating Diagnosed and Undiagnosed Primary Angle-Closure Glaucoma and Open-Angle Glaucoma: A Population-Based Study. Ophthalmol. Glaucoma. 2022;5:160–169. doi: 10.1016/j.ogla.2021.07.010. - DOI - PubMed
    1. Sheybani A., Scott R., Samuelson T.W., Kahook M.Y., Bettis D.I., Ahmed I.I.K., Stephens J.D., Kent D., Ferguson T.J., Herndon L.W. Open-Angle Glaucoma: Burden of Illness, Current Therapies, and the Management of Nocturnal IOP Variation. Ophthalmol. Ther. 2020;9:1–14. doi: 10.1007/s40123-019-00222-z. - DOI - PMC - PubMed
    1. Tribble J.R., Hui F., Quintero H., El Hajji S., Bell K., Di Polo A., Williams P.A. Neuroprotection in glaucoma: Mechanisms beyond intraocular pressure lowering. Mol. Asp. Med. 2023;92:101193. doi: 10.1016/j.mam.2023.101193. - DOI - PubMed
    1. Wareham L.K., Calkins D.J. The Neurovascular Unit in Glaucomatous Neurodegeneration. Front. Cell Dev. Biol. 2020;8:452. doi: 10.3389/fcell.2020.00452. - DOI - PMC - PubMed

LinkOut - more resources