. 2024 Jun 28;12(7):1442.
doi: 10.3390/biomedicines12071442.

Cannabidiol and Beta-Caryophyllene Combination Attenuates Diabetic Neuropathy by Inhibiting NLRP3 Inflammasome/NFκB through the AMPK/sirT3/Nrf2 Axis

Affiliations

Cannabidiol and Beta-Caryophyllene Combination Attenuates Diabetic Neuropathy by Inhibiting NLRP3 Inflammasome/NFκB through the AMPK/sirT3/Nrf2 Axis

Islauddin Khan et al. Biomedicines. .

Abstract

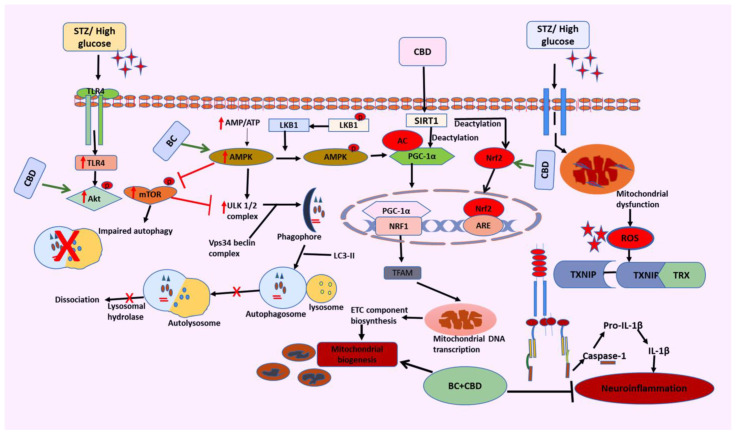
Background: In this study, we investigated in detail the role of cannabidiol (CBD), beta-caryophyllene (BC), or their combinations in diabetic peripheral neuropathy (DN). The key factors that contribute to DN include mitochondrial dysfunction, inflammation, and oxidative stress.

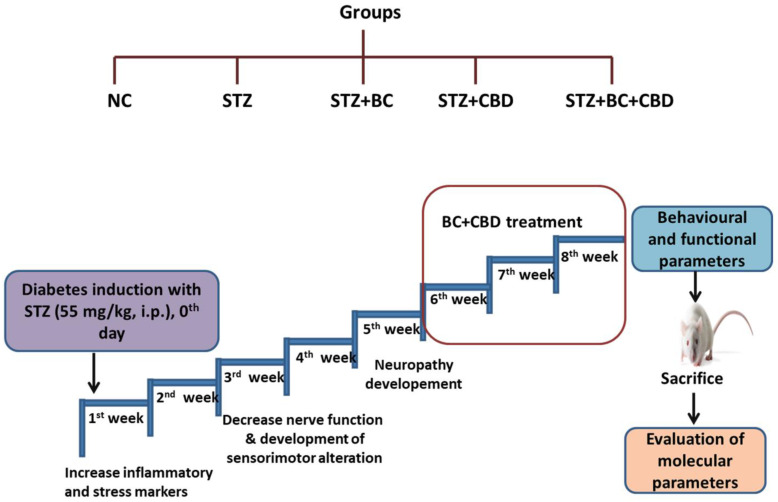
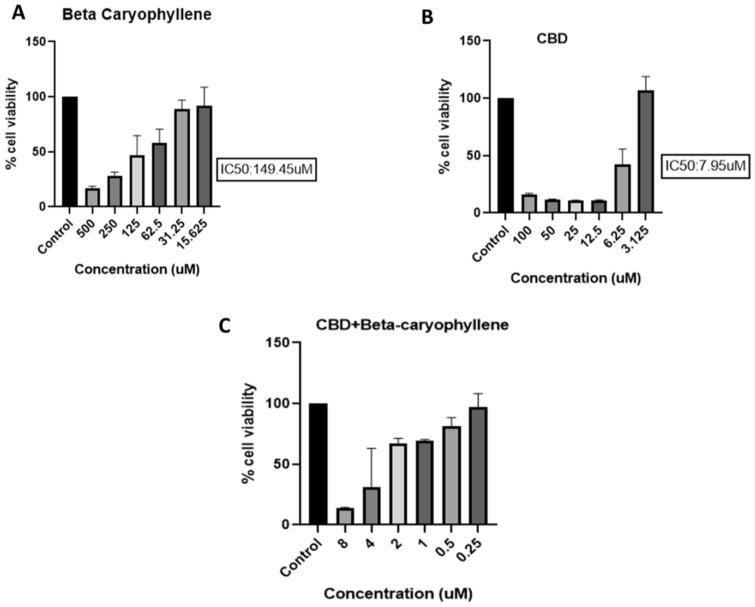
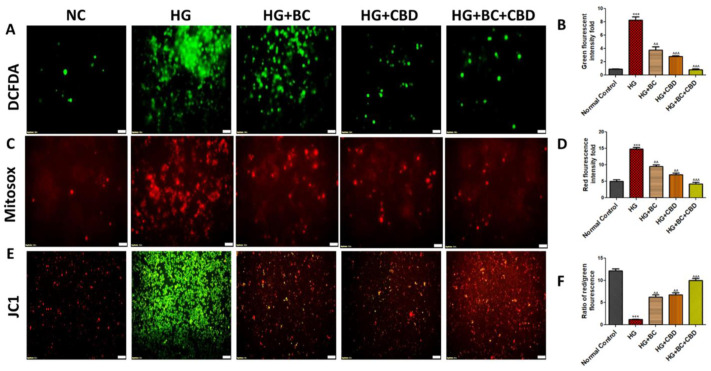
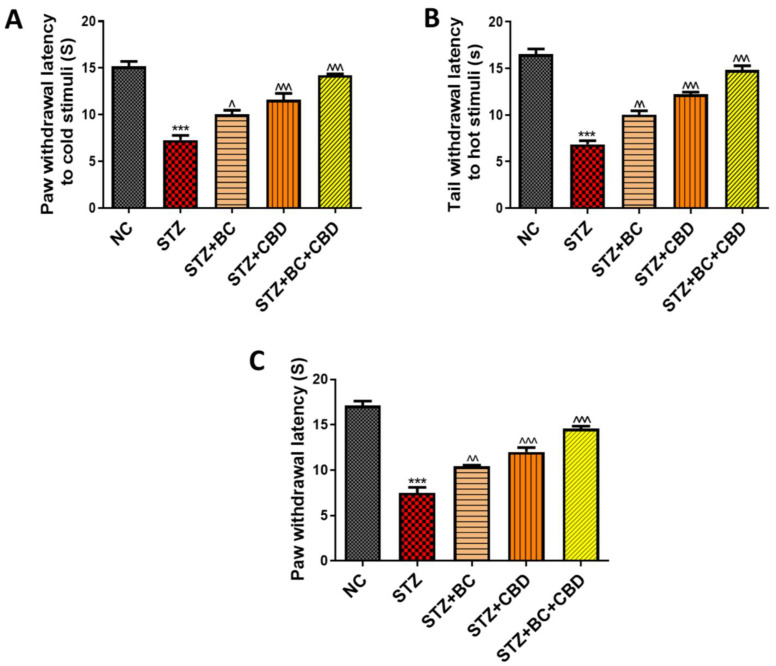
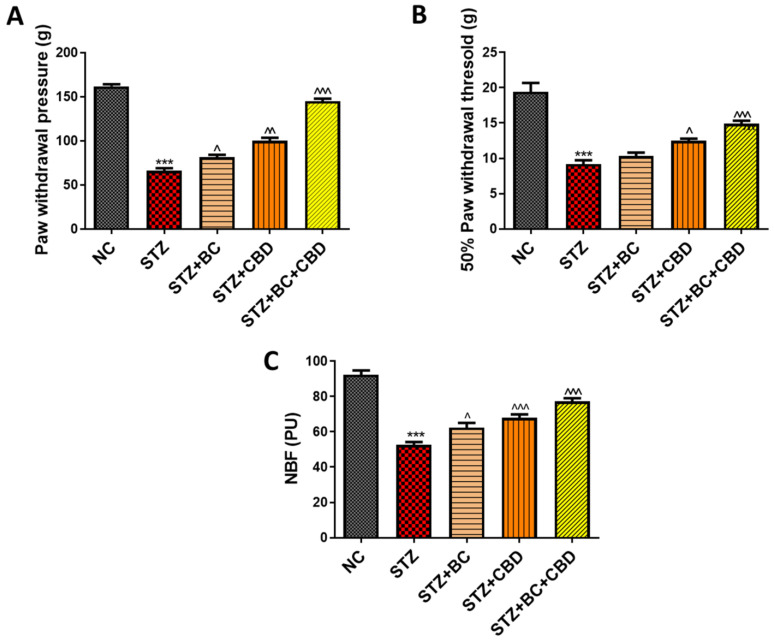
Methods: Briefly, streptozotocin (STZ) (55 mg/kg) was injected intraperitoneally to induce DN in Sprague-Dawley rats, and we performed procedures involving Randall Sellito calipers, a Von Frey aesthesiometer, a hot plate, and cold plate methods to determine mechanical and thermal hyperalgesia in vivo. The blood flow to the nerves was assessed using a laser Doppler device. Schwann cells were exposed to high glucose (HG) at a dose of 30 mM to induce hyperglycemia and DCFDA, and JC1 and Mitosox staining were performed to determine mitochondrial membrane potential, reactive oxygen species, and mitochondrial superoxides in vitro. The rats were administered BC (30 mg/kg), CBD (15 mg/kg), or combination via i.p. injections, while Schwann cells were treated with 3.65 µM CBD, 75 µM BC, or combination to assess their role in DN amelioration.

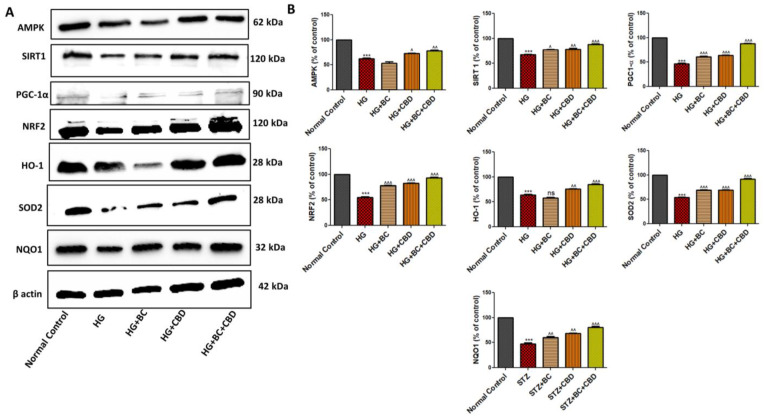
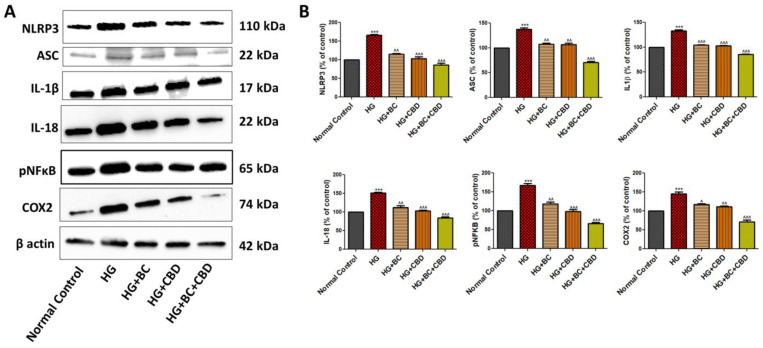
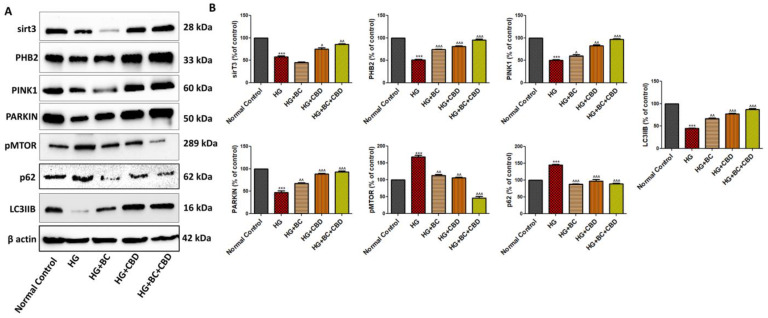
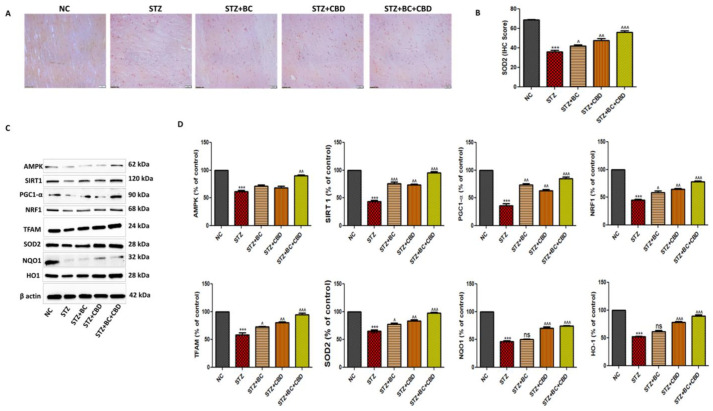
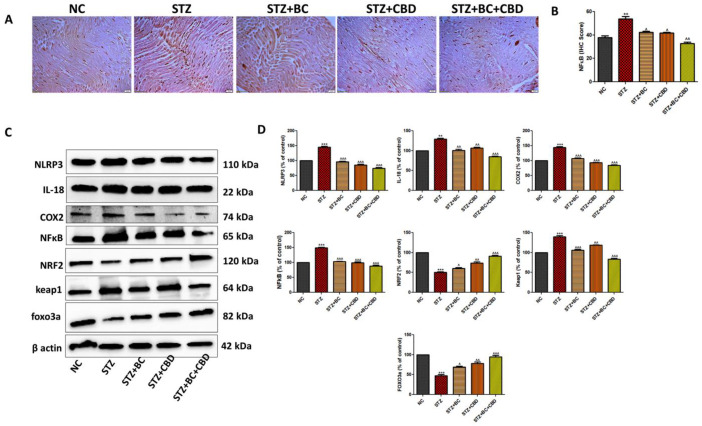
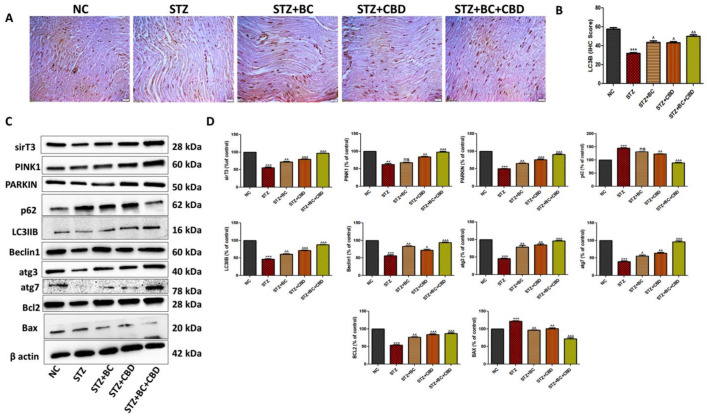
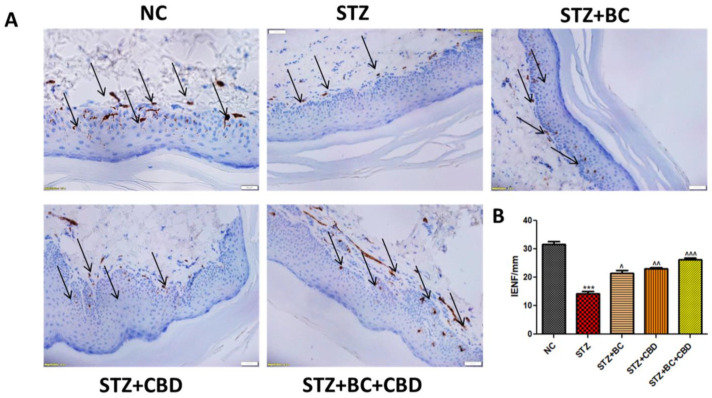
Results: Our results revealed that exposure to BC and CBD diminished HG-induced hyperglycemia in Schwann cells, in part by reducing mitochondrial membrane potential, reactive oxygen species, and mitochondrial superoxides. Furthermore, the BC and CBD combination treatment in vivo could prevent the deterioration of the mitochondrial quality control system by promoting autophagy and mitochondrial biogenesis while improving blood flow. CBD and BC treatments also reduced pain hypersensitivity to hyperalgesia and allodynia, with increased antioxidant and anti-inflammatory action in diabetic rats. These in vivo effects were attributed to significant upregulation of AMPK, sirT3, Nrf2, PINK1, PARKIN, LC3B, Beclin1, and TFAM functions, while downregulation of NLRP3 inflammasome, NFκB, COX2, and p62 activity was noted using Western blotting.

Conclusions: the present study demonstrated that STZ and HG-induced oxidative and nitrosative stress play a crucial role in the pathogenesis of diabetic neuropathy. We find, for the first time, that a CBD and BC combination ameliorates DN by modulating the mitochondrial quality control system.

Keywords: AMPK; NLRP3; autophagy; beta-caryophyllene; cannabidiol; mitochondrial biogenesis; sirT3.


Conflict of interest statement

The authors declare no competing interests.

Figures

Figure 1
Figure 1
Experimental design. There were 5 groups of healthy male SD rats. A single dose of STZ, 55 mg/kg, i.p. was given to the SD rats and BC (30 mg/kg, i.p), CBD (15 mg/kg, i.p.), and BC+CBD (30 mg/kg, i.p, and 15 mg/kg, i.p., respectively) were given for the last 3 weeks. Functional and behavioural parameters were recorded for normal control SD rats (NC, n = 6), STZ-induced SD rats (STZ, n = 8), STZ-induced SD rats with BC (STZ+BC, n = 6), STZ-induced SD rats with CBD (STZ+CBD, n = 6), and STZ-induced SD rats with BC and CBD (STZ+BC+CBD, n = 6).
Figure 2
Figure 2
Effects of BC, CBD, and their combination on cell viability. BC and CBD have shown significant toxicity at above 200 µM and 20 µM concentrations, respectively. Schwann cells were treated at different concentrations of (A) BC (500–15.625 µM), (B) CBD (100–3.125 µM), and (C) BC+CBD (8–0.25 µM), respectively. Data values are represented as means ± SEM (n = 3).
Figure 3
Figure 3
Effects of BC, CBD, and their combination on ROS, superoxide, and mitochondrial membrane potential in HG-induced Schwann cells. (A,B) Fluorescence microscopic images and bar graph of Schwann cells indicating the reactive oxygen species. (C,D) Fluorescence microscopic images and bar graph of Schwann cells indicating mitochondrial membrane potential. (E,F) Fluorescence microscopic images and bar graph of Schwann cells indicating mitochondrial superoxide generation. Photographs were captured at a 40× magnification. Scale shows a length of 50 µm. All the data values are represented as means ± SEM (n = 3). ^^^ p < 0.001, ^^ p < 0.01 vs. HG, *** p < 0.001 vs. Normal Control. Normal Control: normal Schwann cells; HG: Schwann cells exposed to high glucose (30 mM); HG+BC: HG-induced cells treated with BC 75 µM; HG+CBD: HG-induced cells treated with CBD 8 µM; HG+BC+CBD: High-glucose-induced cells treated BC and CBD with 75 µM and 3.64 µM, respectively.
Figure 4
Figure 4
Effects of BC, CBD, and their combination on mitochondrial biogenesis and their antioxidant effects through the expression of AMPK, SIRT1, and NRF2 in HG-induced Schwann cells. (A) Western blots of respective proteins AMPK, SIRT1, NRF2, PGC-1α, HO1, SOD2, NQO1, and β-actin. (B) Densitometric analyses of the respective blots. All the data values are represented in the form of mean ± SEM (n = 3). ns = non significance, ^^^ p < 0.001, ^^ p < 0.01, ^ p < 0.05 vs. HG, *** p < 0.001 vs. Normal Control. Normal Control: normal Schwann cells; HG: Schwann cells exposed to high glucose (30 mM); HG+BC: HG-induced cells treated with BC 75 µM; HG+CBD: HG-induced cells treated with CBD 8 µM; HG+BC+CBD: high-glucose-induced cells treated with BC and CBD with 75 µM and 3.64 µM, respectively.
Figure 5
Figure 5
Effects of BC, CBD, and their combination on mitochondrial function and autophagy in HG-induced Schwann cells. (A) the Western blotting of NLRP3, ASC, IL1β, IL18, pNFkB, COX2, and β-actin. (B) Densitometric analysis of NLRP3, ASC, IL-1β, IL18, pNFkB, and COX2 expression in Schwann cells. All data values are expressed as means ± SEM (n = 3). ^^^ p < 0.001, ^^ p < 0.01, ^ p < 0.05 vs. HG, *** p < 0.001, vs. Normal Control. Normal Control: normal Schwann cells; HG: Schwann cells exposed to high glucose (30 mM); HG+BC: HG-induced cells treated with BC 75 µM; HG+CBD: HG-induced cells treated with CBD 8 µM; HG+BC+CBD: high-glucose-induced cells treated BC and CBD with 75 µM and 3.64 µM, respectively.
Figure 6
Figure 6
Effects of BC, CBD, and their combination on neuroinflammation in HG-induced Schwann cells. (A) Western blotting of sirT3, PHB2, PARKIN, PINK1, pMTOR, p62, LC3IIB, and β-actin (B) Densitometric analysis of sirT3, PHB2, PARKIN, PINK1, pMTOR, p62, and LC3IIB levels in Schwann cells. All data values are presented as means ± SEM (n = 3). ^^^ p < 0.001, ^^ p < 0.01, ^ p < 0.05, vs. HG, *** p < 0.001, vs. Normal Control. Normal Control: normal Schwann cells; HG: Schwann cells exposed to high glucose (30 mM); HG+BC: HG-induced cells treated with BC 75 µM; HG+CBD: HG-induced cells treated with CBD 8 µM; HG+BC+CBD: high-glucose-induced cells treated with BC and CBD with 75 µM and 3.64 µM, respectively.
Figure 7
Figure 7
Effects of BC, CBD, and their combination on thermal stimuli in diabetic rats. The thermal stimuli (A) cold immersion test (B) hot immersion test, and (C) Hargreaves test, (n = 6). All the data values are presented as means ± SEM. ^^^ p < 0.001, ^^ p < 0.01, ^ p < 0.05 vs. STZ, *** p < 0.001 vs. NC. NC: normal control; STZ: diabetic control, STZ+BC; diabetic control treated with BC 30 mg/kg, STZ+CBD; diabetic control treated with CBD 15 mg/kg; STZ+BC+CBD: diabetic control treated with BC and CBD at 30 mg/kg and 15 mg/kg body wt, respectively.
Figure 8
Figure 8
Effects of BC, CBD, and their combination on mechanical stimuli and nerve function in diabetic rats. The mechanical stimuli, (A) Von Frey filaments test, (B) Randall–Selitto apparatus test (n = 6), (C) nerve blood flow test (NBF) (n = 3). All the data values are presented as means ± SEM. ^^^ p < 0.001, ^^ p < 0.01, ^ p < 0.05 vs. STZ, *** p < 0.001 vs. NC. NC: normal control; STZ: diabetic control; STZ+BC: diabetic control treated with BC 30 mg/kg; STZ+CBD: diabetic control treated with CBD 15 mg/kg; STZ+BC+CBD: diabetic control treated with BC and CBD at 30 mg/kg and 15 mg/kg body wt, respectively.
Figure 9
Figure 9
Effects of BC, CBD, and their combination on AMPK, SIRT1-mediated mitochondrial biogenesis in SD rats. (A) The expression of SOD2 immunopositivity in the SD rats’ sciatic nerves. (B) The bar graph of the respective images. Photographs were taken at 40× magnification. Scale bars show a length of 50 µm. (C) Western blots of AMPK, SIRT1, NRF1, PGC-1α, TFAM, NQO1, SOD2, HO1 and β-actin in the sciatic nerve of the diabetic rats. (D) The corresponding graphical representation of the blots based on the densitometric analysis. All the data values are represented as means ± SEM (n = 3). ns = non significance ^^^ p < 0.001, ^^ p < 0.01, ^ p < 0.05 vs. STZ, *** p < 0.001, vs. NC. NC: normal control; STZ: diabetic control; STZ+BC: diabetic control treated with BC 30 mg/kg; STZ+CBD: diabetic control treated with CBD 15 mg/kg; STZ+BC+CBD: diabetic control treated with BC and CBD at 30 mg/kg and 15 mg/kg body wt, respectively.
Figure 10
Figure 10
Effects of BC, CBD, and their combination on inflammasome and Nrf2-linked antioxidant defense in SD rats. (A) Representative immunohistochemical representation of NFkB immunopositivity in the sciatic nerves of the rats. (B) Bar graph of the respective images. Photographs were captured at 40× magnification. Scale bars show a length of 50 µm. (C) Representative Western blots of NLRP3, IL-18, COX2, NFkB, Nrf2, keap1, Foxo3a, and β-actin in the diabetic rats. (D) Corresponding graphical representation of the blots based on a densitometric analysis. All the data values are represented as means ± SEM (n = 3). ^^^ p < 0.001, ^^ p < 0.01, ^ p < 0.05 vs. STZ, *** p < 0.001, ** p < 0.01, vs. NC. NC: normal control; STZ: diabetic control; STZ+BC: diabetic control treated with BC 30 mg/kg; STZ+CBD: diabetic control treated with CBD 15 mg/kg; and STZ+BC+CBD: diabetic control treated with BC and CBD at 30 mg/kg and 15 mg/kg body wt, respectively.
Figure 11
Figure 11
Effects of BC, CBD, and their combination on autophagy in SD rats. (A) The expression of LC3B immunopositivity in the sciatic nerves of rats. (B) Bar graph for the respective photographs. Photographs were taken at 40× magnification. Scale bars show a length of 50 µm. (C) Representative Western blots of SirT3, PINK1, PARKIN, p62, LC3B, pMTOR, atg3, atg7, BCL2, and β-actin in diabetic rats. (D) Corresponding graphical representation of the blots based on a densitometric analysis. All the data values are represented as means ± SEM (n = 3). ns = non significance, ^^^ p < 0.001, ^^ p < 0.01, ^ p < 0.05 vs. STZ, *** p < 0.001, ** p < 0.01 vs. NC. NC: normal control; STZ: diabetic control; STZ+BC: diabetic control treated with BC 30 mg/kg; STZ+CBD: diabetic control treated with CBD 15 mg/kg; STZ+BC+CBD: diabetic control treated with BC and CBD at 30 mg/kg and 15 mg/kg body wt, respectively.
Figure 12
Figure 12
Effects of BC, CBD, and their combination on IENF degeneration in SD rats. (A) Representative immunohistochemistry images of PGP 9.5 in the diabetic rat planter skin. The photographs were captured at 40× magnification. Scale bars show a length of 50 µm. (B) Bar graph shows IENF/mm. The results are represented as means ± SEM (n = 3). ^^^ p < 0.001, ^^ p < 0.01, ^ p < 0.05 vs. STZ, *** p < 0.001, vs. NC. NC: normal control; STZ: diabetic control; STZ+BC: diabetic control treated with BC 30 mg/kg; STZ+CBD: diabetic control treated with CBD 15 mg/kg; and STZ+BC+CBD: diabetic control treated with BC and CBD at 30 mg/kg and 15 mg/kg body wt, respectively.
Figure 13
Figure 13
Hypothesized mechanism of BC and CBD via AMPK/SIRT1/Nrf2 activation and NLRP3 inactivation. Peripheral nerves may accumulate more glucose and ROS because of diabetes-associated oxidative stress/nitrosative stress and dysfunctional mitochondria, which act as priming and activation signals for the activation of NLRP3 and release of IL-1β. On the other side, NLRP3 activation comes from abnormal clearance of damaged mitochondria caused by defective autophagy, which fails to balance mitochondrial homeostasis. To combat the NLRP3-linked neuroinflammation that is thought to be responsible for the onset and maintenance of diabetic neuropathy, BC and CBD, which are antioxidants, enhance Nrf2-mediated p62 induction and improve both autophagy and antioxidant effects. On the other hand, activation of AMPK, SIRT1, and Nrf2 and the inhibition of mTOR by BC and CBD promote autophagy. PGC-1α deacetylation and associated transcriptional activation of NRF1-mediated mitochondriogenesis are both outcomes of BC and CBD, facilitating SIRT1. Additionally, ROS-linked neuroinflammation and oxidative stress can be prevented by activating AMPK and SIRT1. Under hyperglycemic conditions of DN, these AMPK and SIRT1-mediated impacts on redox balance and mitochondrial homeostasis can avoid neuronal damage. Overall, the ROS-directed mitochondrial dysfunction and oxidative stress within the cellular system are reduced by the newly synthesized healthy mitochondria and via autophagy. AMPK: AMP-activated protein kinase; SIRT1: silent mating type information-regulation 2 homolog; PGC-1α: peroxisome proliferator-activated receptor-γ coactivator; Nrf2: nuclear respiratory factor 2; p62: Sequestome1; TFAM: transcription factor A; mTOR: mammalian target of rapamycin.

Similar articles

Cited by

References

    1. Yang H., Sloan G., Ye Y., Wang S., Duan B., Tesfaye S., Gao L. New Perspective in Diabetic Neuropathy: From the Periphery to the Brain, a Call for Early Detection, and Precision Medicine. Front. Endocrinol. 2019;10:929. doi: 10.3389/fendo.2019.00929. - DOI - PMC - PubMed
    1. Feldman E.L., Callaghan B.C., Pop-Busui R., Zochodne D.W., Wright D.E., Bennett D.L., Bril V., Russell J.W., Viswanathan V. Diabetic neuropathy. Nat. Rev. Dis. Prim. 2019;5:42. doi: 10.1038/s41572-019-0092-1. - DOI - PMC - PubMed
    1. Sun H., Saeedi P., Karuranga S., Pinkepank M., Ogurtsova K., Duncan B.B., Stein C., Basit A., Chan J.C.N., Mbanya J.C., et al. IDF Diabetes Atlas: Global, regional and country-level diabetes prevalence estimates for 2021 and projections for 2045. Diabetes Res. Clin. Pract. 2022;183:109119. doi: 10.1016/j.diabres.2021.109119. - DOI - PMC - PubMed
    1. Shiferaw W.S., Akalu T.Y., Work Y., Aynalem Y.A. Prevalence of diabetic peripheral neuropathy in Africa: A systematic review and meta-analysis. BMC Endocr. Disord. 2020;20:49. doi: 10.1186/s12902-020-0534-5. - DOI - PMC - PubMed
    1. Arruri V.K., Gundu C., Khan I., Khatri D.K., Singh S.B. PARP overactivation in neurological disorders. Mol. Biol. Rep. 2021;48:2833–2841. doi: 10.1007/s11033-021-06285-1. - DOI - PubMed

LinkOut - more resources