. 2024 Jun 28;12(7):1449.
doi: 10.3390/biomedicines12071449.

The Strong Activation of p53 Tumor Suppressor Drives the Synthesis of the Enigmatic Isoform of DUSP13 Protein

Affiliations

The Strong Activation of p53 Tumor Suppressor Drives the Synthesis of the Enigmatic Isoform of DUSP13 Protein

Małgorzata Krześniak et al. Biomedicines. .

Abstract

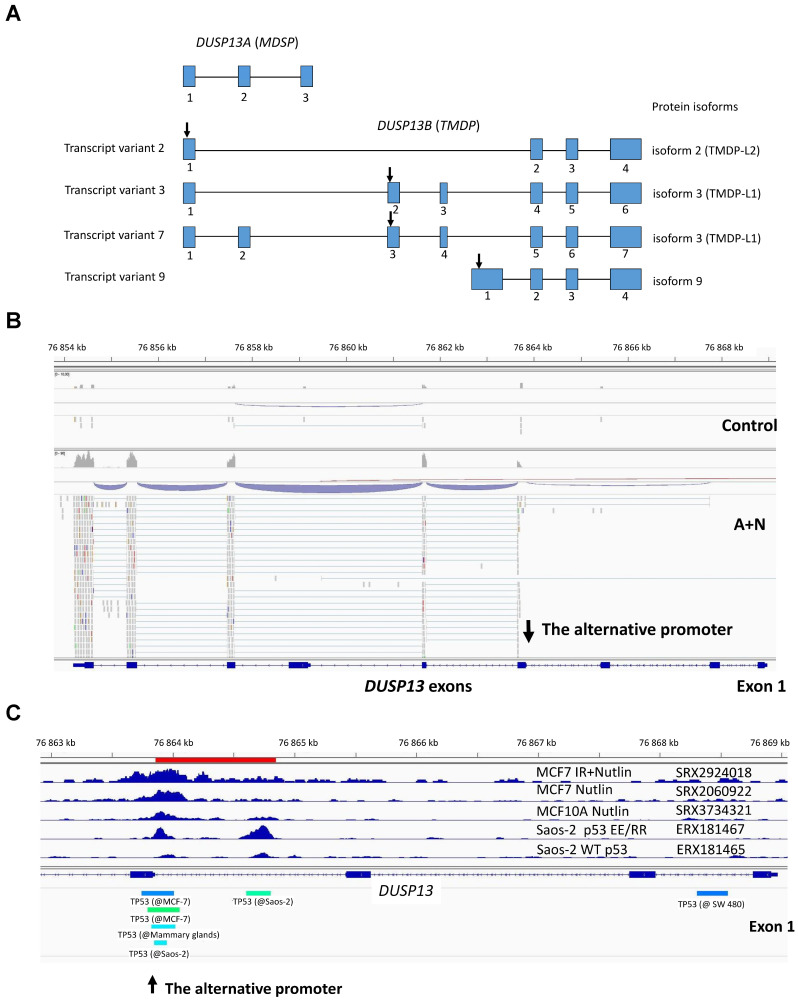
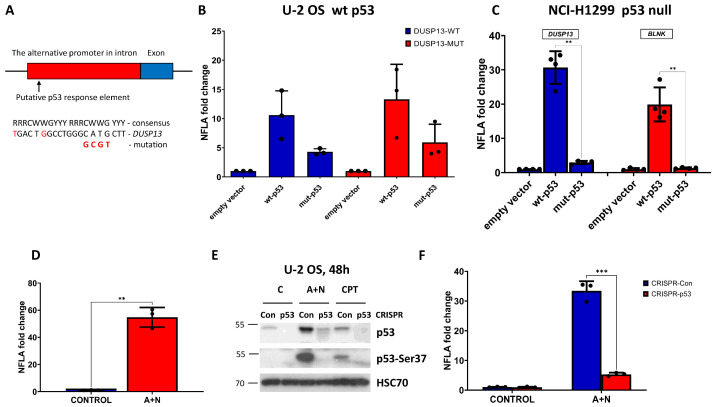
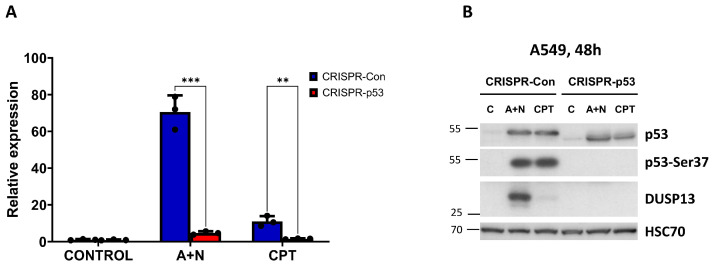
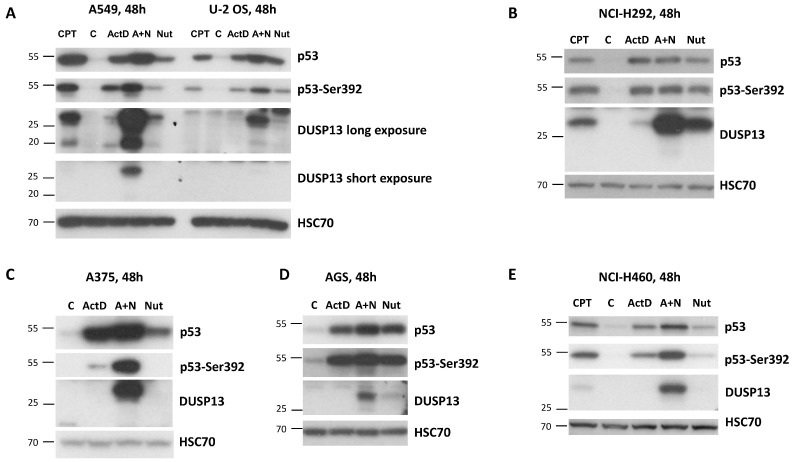
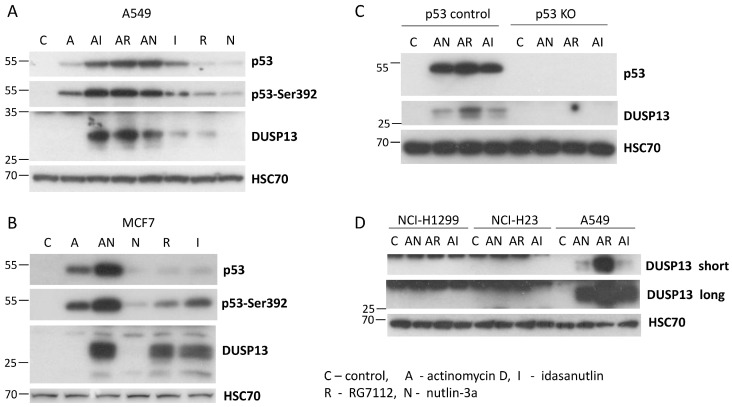
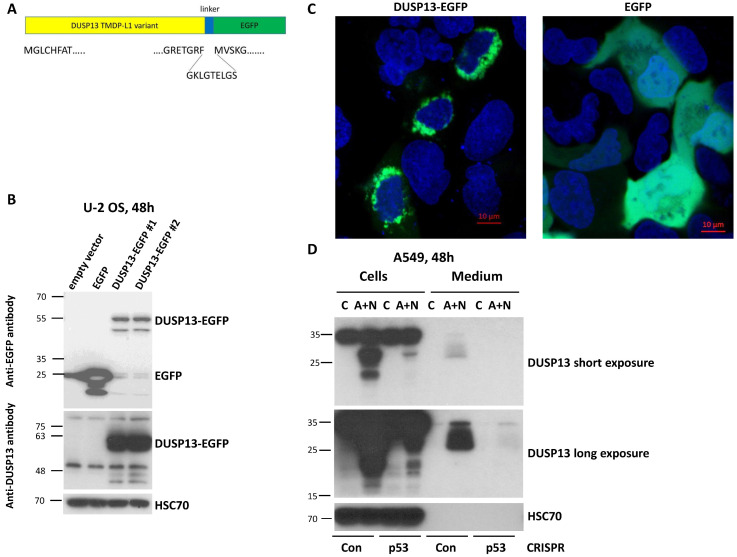
The p53 tumor suppressor protein activates various sets of genes depending on its covalent modifications, which are controlled by the nature and intensity of cellular stress. We observed that actinomycin D and nutlin-3a (A + N) collaborate in inducing activating phosphorylation of p53. Our recent transcriptomic data demonstrated that these substances strongly synergize in the upregulation of DUSP13, a gene with an unusual pattern of expression, coding for obscure phosphatase having two isoforms, one expressed in the testes and the other in skeletal muscles. In cancer cells exposed to A + N, DUSP13 is expressed from an alternative promoter in the intron, resulting in the expression of an isoform named TMDP-L1. Luciferase reporter tests demonstrated that this promoter is activated by both endogenous and ectopically expressed p53. We demonstrated for the first time that mRNA expressed from this promoter actually produces the protein, which can be detected with Western blotting, in all examined cancer cell lines with wild-type p53 exposed to A + N. In some cell lines, it is also induced by clinically relevant camptothecin, by nutlin-3a acting alone, or by a combination of actinomycin D and other antagonists of p53-MDM2 interaction-idasanutlin or RG7112. This isoform, fused with green fluorescent protein, localizes in the perinuclear region of cells.

Keywords: DUSP13; MDM2; alternative promoter; dual-specificity phosphatase; p53.


Conflict of interest statement

The authors declare no conflicts of interest.

Figures

Figure 1
Figure 1
Treatment with A + N activates an alternative promoter in the intron of the DUSP13 gene. (A) The structure of the DUSP13 locus. The exons are displayed as blue boxes and the starts of open reading frames for individual isoforms are marked as arrows. For clarity, only the relevant transcript variants are shown. The GeneCards database splits DUSP13 into two genes, DUSP13A (alias MDSP) and DUSP13B (alias TMDP). The exons are numbered for each individual transcript variant. Drawn according to data from ncbi.nlm.nih.gov/gene/51207 (accessed on 15 April 2024). (B) Genome Browser (IGV) views of RNA-Seq reads mapped to the DUSP13 gene in mock-treated (control) A549 cells and cells exposed to A + N for 30 h. The raw sequencing data are deposited in the Sequence Read Archive under accession number PRJNA757776. The IGV numbers DUSP13 exons from right to left. All exons utilized to splice individual transcript variants are shown. (C) Genome Browser (IGV) views of p53 binding peaks in the 5′ part of the DUSP13 gene. Using the ChIP-Atlas tool [19], we imported publicly available coverage tracks from five ChIP-Seq experiments aimed at finding p53 binding sites in the MCF7 cell line exposed to ionizing radiation (IR) and Nutlin (sample ID SRX2924018), MCF7 cells treated with Nutlin (sample ID SRX2060922), MCF 10A cells from non-cancerous breast epithelium exposed to Nutlin (sample ID SRX3734321), the Saos-2 cell line ectopically expressing wild-type p53 (sample ID ERX181465), and Saos-2 cells ectopically expressing pairs of engineered p53 molecules with strong cooperative binding of p53 monomers (sample ID ERX181467). The red, thick horizontal line marks the location of the cloned promoter. The location of ChIP-Seq peaks identified by ChIP-Atlas are shown by horizontal bars at the bottom of the graph.
Figure 2
Figure 2
The p53 protein activates the alternative promoter of DUSP13. (A) The sequence of a putative p53-response element within the alternative DUSP13 promoter is shown together with the consensus sequence of the response element and the mutations we generated. (B) The relative values of NFLA (normalized firefly luciferase activity) in U-2 OS cells transfected with (bars from left to right): plasmid with wild-type DUSP13 promoter and empty expression vector, plasmid with wild-type DUSP13 promoter and wild-type p53 expression vector, plasmid with wild-type DUSP13 promoter and mutant p53 expression vector, plasmid with mutant DUSP13 promoter and empty expression vector, plasmid with mutant DUSP13 promoter and wild-type p53 expression vector, and plasmid with mutant DUSP13 promoter and mutant p53 expression vector. The means and standard deviations from three biological repeats performed in triplicate are shown. (C) The relative values of NFLA in p53-null NCI-H1299 cells transfected with reporter plasmids with a cloned DUSP13 promoter (blue bars) or with the cloned promoter of another p53-regulated gene BLNK (red bars). The reporter plasmids were co-transfected with a control empty vector, the vector expressing wild-type p53, or the vector expressing mutant p53. The statistical significance was calculated by multiple unpaired t-tests; ** p ≤ 0.01. The calculation was performed using GraphPad Prism version 9.5.1 (2023) for Windows, GraphPad Software, Boston, MA, USA, www.graphpad.com, accessed on 15 April 2024. (D) The relative value of NFLA in U-2 OS cells transfected with a plasmid with wild-type DUSP13 promoter growing in control conditions (mock treatment) or exposed to A + N. The results represent means and standard deviations from three biological replicates, and the p value was calculated with an unpaired t-test, ** p ≤ 0.01. The calculation was performed using GraphPad Prism version 9.5.1. (E) The expression of total p53, p53 with phosphorylated Ser37 and HSC70 as a loading control in U-2 OS cells with p53 expression knocked-down by CRISPR/Cas 9 (CRISPR-p53), and in control cells for knockdown (CRISPR-Con) growing in control conditions (mock treatment—C) or exposed to A + N or camptothecin (CPT). The expression of indicated proteins was determined by Western blotting. (F) The relative values of NFLA in U-2 OS cells transfected with a plasmid with wild-type DUSP13 promoter. The transfection was performed in p53-deficient cells (CRISPR-p53) and their controls (CRISPR-Con) exposed to A + N for 24 h (A + N) or mock-treated (CONTROL). The results represent means and standard deviations from three biological replicates, and the p value was calculated with multiple unpaired t-tests; *** p ≤ 0.001. The calculation was performed using GraphPad Prism version 9.5.1.
Figure 3
Figure 3
Expression of DUSP13 measured at mRNA and protein levels is attenuated in p53-deficient cells. (A) The expression of DUSP13 mRNA was measured with semi-quantitative RT-PCR in mock-treated cells (CONTROL) or cells exposed to A + N or camptothecin (CPT) for 30 h. The p53 knockdown was performed with CRISPR/Cas9 technology. The results represent mean and standard deviations from three biological replicates, and the p values were calculated with multiple t-tests; ** p ≤ 0.01, *** p ≤ 0.001. The calculations were performed using GraphPad Prism version 9.5.1 (2023) for Windows. (B) The expression of p53, its form with phosphorylated Ser37 and DUSP13 in p53-deficient cells (CRISPR-p53), and their controls (CRISPR-Con) were prepared as described in (A) and exposed to A + N or camptothecin (CPT) for 48 h or mock-treated (C). The expression of indicated proteins was determined with Western blotting.
Figure 4
Figure 4
The expression of DUSP13 is induced by A + N in all examined cell lines with the wild-type p53 gene. (AE) Western blots showing expression of indicated proteins in selected cell lines with wild-type p53 mock-treated (C) or incubated for 48 h with actinomycin D (ActD), nutlin-3a (Nut), both substances (A + N), or camptothecin (CPT).
Figure 5
Figure 5
The other antagonists of MDM2–p53 interaction, idasanutlin, and RG7112 also synergize with actinomycin D in inducing the expression of DUSP13. (A) A549 cells were exposed for 48 h, as shown, to various combinations of actinomycin D (A) and the antagonists of MDM2–p53 interaction: nutlin-3a (N), idasanutlin (I), and RG7112 (R). The expression of the indicated proteins was determined with Western blotting. (B) MCF7 cells were exposed for 48 h to actinomycin D, actinomycin D with nutlin-3a, and to the antagonists of MDM2–p53 interaction acting alone. (C) The expression of p53 and DUSP13 proteins in the control clone of p53-proficient A549 cells and in the clone of p53-knockout cells (p53 KO), mock-treated (C), or exposed to indicated drug combinations. (D) The expression of DUSP13 in p53 wild-type cells (A549), in p53 mutant cells (NCI-H23), and in p53-null cells (NCI-H1299). The cells were mock-treated (C) or exposed to combinations of actinomycin D and the antagonists of MDM2-p53 interaction. To visualize DUSP13, we performed two exposures (long and short) to photosensitive film.
Figure 6
Figure 6
The DUSP13 isoform with the attached enhanced green fluorescent protein localizes to the perinuclear region of U-2 OS cells. (A) The structure of the fusion protein expressed from the engineered plasmid. The variant of DUSP13 is fused by the plasmid-coded linker to the enhanced green fluorescent protein (EGFP). The amino acid sequences of the DUSP13 N- and C-ends, the linker, and the start of EGFP are shown. (B) The Western blot showing the expression of EGFP and DUSP13-EGFP fusion protein expressed from two clones of the plasmid. The positions of the molecular weight markers (kDa) are placed on the left. The expected size of the unmodified DUSP13 variant is 32 kDa. Two separate blots were probed either with an anti-EGFP antibody or with an anti-DUSP13 antibody. (C) The localization of the proteins expressed from the plasmids transfected to U-2 OS cells. The living cells were observed using a Zeiss confocal microscope 24 h after the start of transfection. The nuclei were stained using Hoechst 33342. (D) The expression of DUSP13 in cells and in the concentrated medium of cells growing in the control condition (mock treatment, C) or exposed to A + N for 48 h. We used p53 knockdown cells (CRISPR-p53) and the controls for knockdown with wild-type p53 (CRISPR-Con). The expression of indicated proteins was determined with Western blotting. Both panels show the same blot with short (upper) and long (bottom) exposure times.

Similar articles

References

    1. Levine A.J. The many faces of p53: Something for everyone. J. Mol. Cell Biol. 2019;11:524–530. doi: 10.1093/jmcb/mjz026. - DOI - PMC - PubMed
    1. Shen J., Wang Q., Mao Y., Gao W., Duan S. Targeting the p53 signaling pathway in cancers: Molecular mechanisms and clinical studies. MedComm. 2023;4:e288. doi: 10.1002/mco2.288. - DOI - PMC - PubMed
    1. Łasut-Szyszka B., Rusin M. The Wheel of p53 Helps to Drive the Immune System. Int. J. Mol. Sci. 2023;24:7645. doi: 10.3390/ijms24087645. - DOI - PMC - PubMed
    1. Tebaldi T., Zaccara S., Alessandrini F., Bisio A., Ciribilli Y., Inga A. Whole-genome cartography of p53 response elements ranked on transactivation potential. BMC Genom. 2015;16:464. doi: 10.1186/s12864-015-1643-9. - DOI - PMC - PubMed
    1. Łasut-Szyszka B., Małachowska B., Gdowicz-Kłosok A., Krześniak M., Głowala-Kosińska M., Zajkowicz A., Rusin M. Transcriptome Analysis of Cells Exposed to Actinomycin D and Nutlin-3a Reveals New Candidate p53-Target Genes and Indicates That CHIR-98014 Is an Important Inhibitor of p53 Activity. Int. J. Mol. Sci. 2021;22:11072. doi: 10.3390/ijms222011072. - DOI - PMC - PubMed

LinkOut - more resources