. 2024 Jul 12;12(7):1553.
doi: 10.3390/biomedicines12071553.

Ketosis Suppression and Ageing (KetoSAge) Part 2: The Effect of Suppressing Ketosis on Biomarkers Associated with Ageing, HOMA-IR, Leptin, Osteocalcin, and GLP-1, in Healthy Females

Affiliations

Ketosis Suppression and Ageing (KetoSAge) Part 2: The Effect of Suppressing Ketosis on Biomarkers Associated with Ageing, HOMA-IR, Leptin, Osteocalcin, and GLP-1, in Healthy Females

Isabella D Cooper et al. Biomedicines. .

Abstract

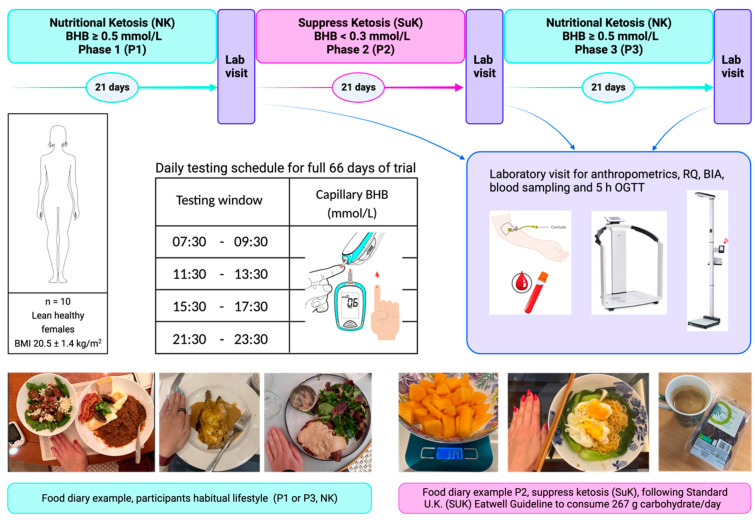
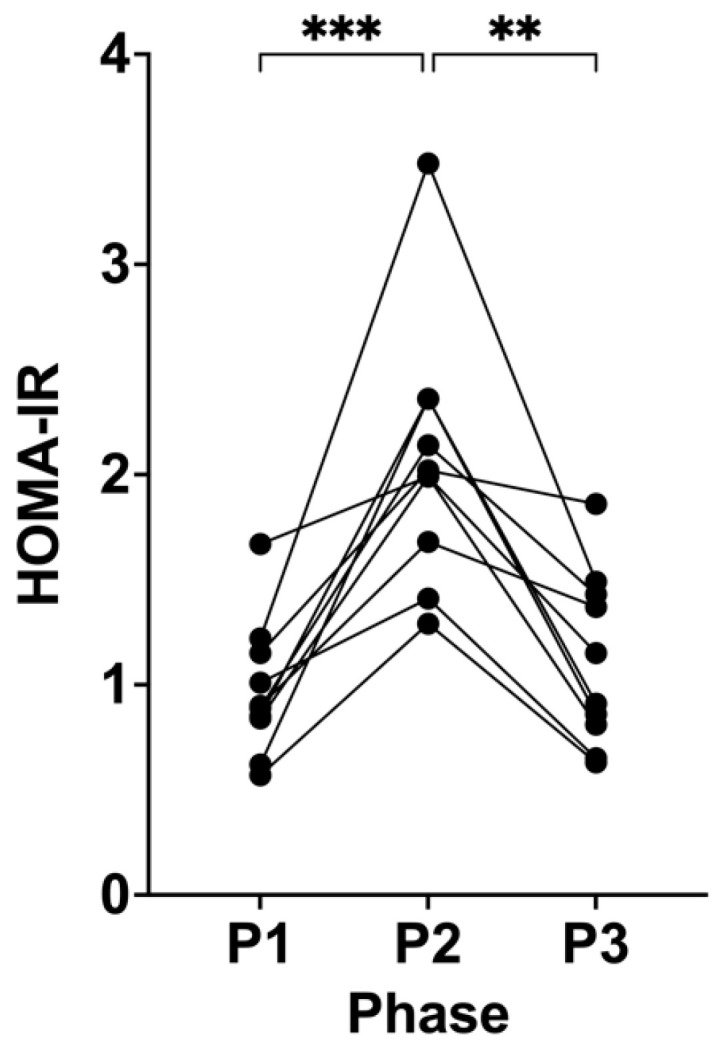
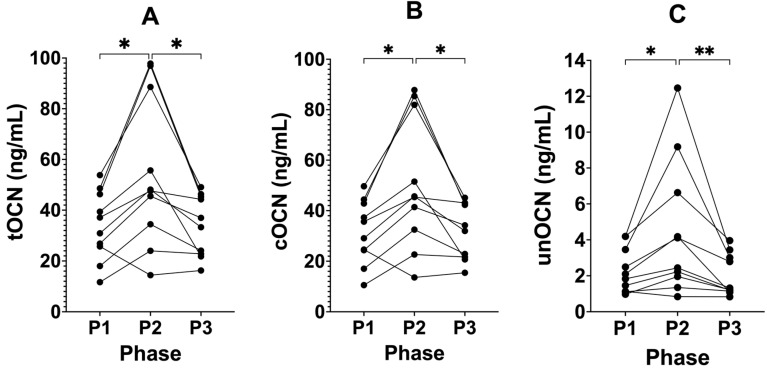
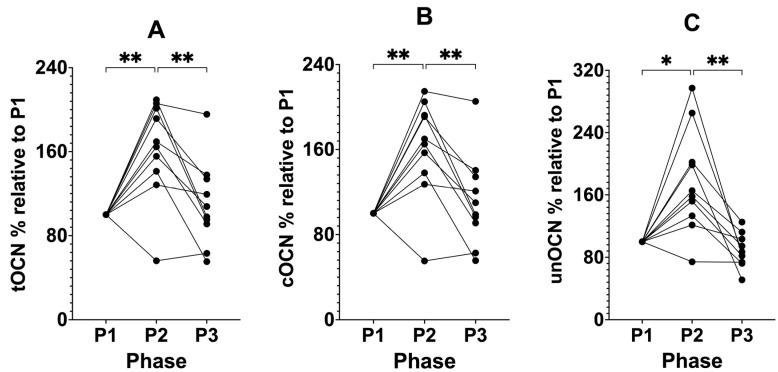
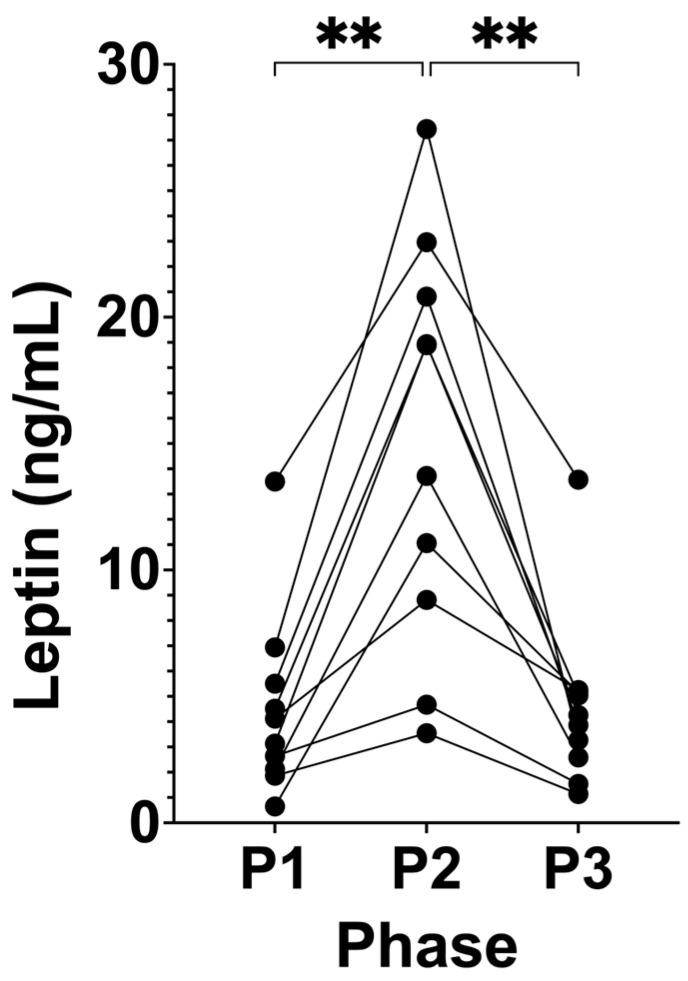
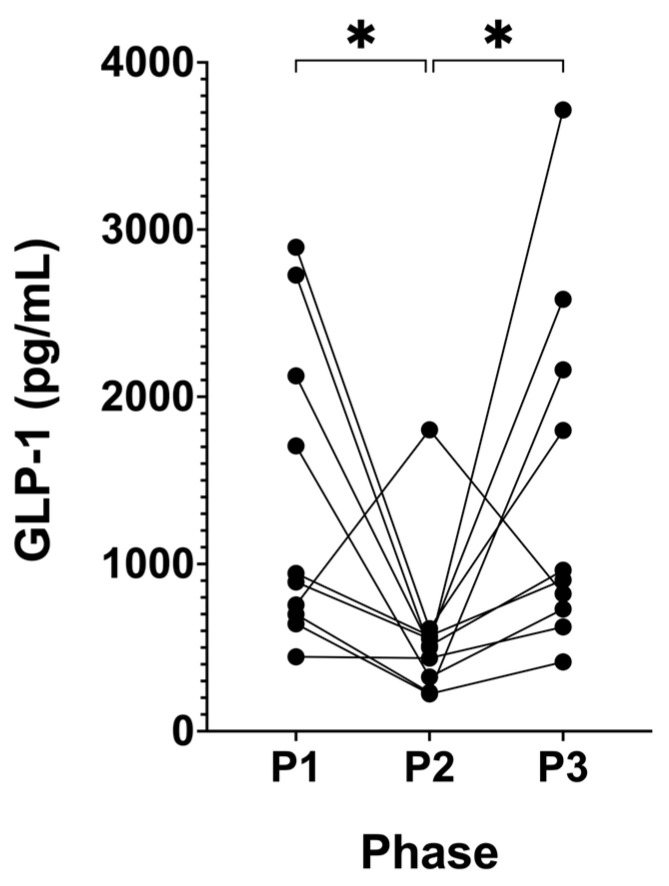
Metabolic dysfunctions are among the best documented hallmarks of ageing. Cardiovascular disease, Alzheimer's disease, cancer, type 2 diabetes mellitus, metabolic-dysfunction-associated steatosis liver disease, and fragility fractures are diseases of hyperinsulinaemia that reduce life and healthspan. We studied the effect of suppressing ketosis in 10 lean (BMI 20.5 kg/m2 ± 1.4), metabolically healthy, pre-menopausal women (age 32.3 ± 8.9 years) maintaining nutritional ketosis (NK) for an average of 3.9 years (± 2.3) who underwent three 21-day phases: nutritional ketosis (NK; P1), suppressed ketosis (SuK; P2), and returned to NK (P3). Ketosis suppression significantly increased insulin, 1.83-fold (p = 0.0006); glucose, 1.17-fold (p = 0.0088); homeostasis model assessment for insulin resistance (HOMA-IR), 2.13-fold (p = 0.0008); leptin, 3.35-fold (p = 0.0010); total osteocalcin, 1.63-fold (p = 0.0138); and uncarboxylated osteocalcin, 1.98-fold (p = 0.0417) and significantly decreased beta-hydroxybutyrate, 13.50-fold (p = 0.0012) and glucagon-like peptide-1 (GLP-1), 2.40-fold (p = 0.0209). Sustained NK showed no adverse health effects and may mitigate hyperinsulinemia. All biomarkers returned to basal P1 levels after removing the intervention for SuK, indicating that metabolic flexibility was maintained with long-term euketonaemia.

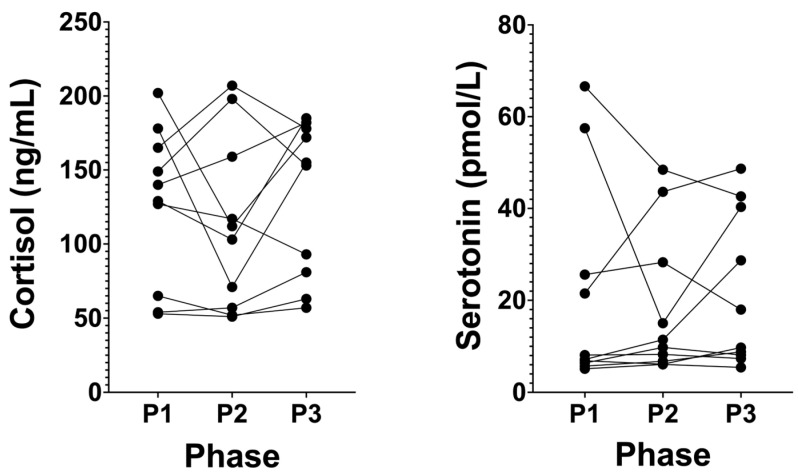
Keywords: GLP-1; HOMA-IR; ageing; cortisol; hyperinsulinaemia; insulin resistance; ketosis; leptin; metabolic syndrome; osteocalcin.


Conflict of interest statement

The authors declare no conflicts of interest.

Figures

Figure 1
Figure 1
KetoSAge study design. Phase 1 and 3 covered the participants’ habitual nutritional ketosis lifestyle. Phase 2 was the interventional phase to suppress ketosis (SuK). Each phase was monitored via finger prick testing of capillary beta-hydroxybutyrate (BHB) concentration (mmol/L). Testing was conducted four times per day, prior to mealtimes, at evenly spaced intervals. At the end of each phase, participants underwent a laboratory testing day for body composition and biochemical tests. Participants were given an oral glucose tolerance test (75 g glucose in 250 mL water) described in our earlier publication [7]. Blood samples were taken at seven time points over 5 hours. Whole blood glucose and BHB were measured sequentially in real time using the Keto-MojoTM meter, and plasma insulin sensitivity assay was conducted later using ELISA. Body mass index (BMI); oral glucose tolerance test (OGGT); respiratory quotient (RQ).
Figure 2
Figure 2
Homeostatic model assessment for insulin resistance (HOMA-IR) across all phases in KetoSAge participants. Fasting serum concentrations of insulin and plasma glucose were measured following each of the study phases: baseline nutritional ketosis (NK), P1; intervention to suppress ketosis (SuK), P2; and removal of SuK returning to NK, P3. Insulin was determined by via Simple Plex Assay (Ella™, Bio-Techne, Minneapolis, USA) and glucose was measured by Biosen C-Line Clinic Glucose and Lactate analyser. HOMA-IR adopts the following formula to index insulin resistance: fasting plasma insulin (uIU/mL) × fasting plasma glucose (mmol/L)/22.5 [1,17,18]. Homeostasis model assessment for insulin resistance (HOMA-IR). Samples were taken at 8 a.m. after a 12 h overnight fast (n = 10). Data were analysed by repeated measures one-way ANOVA. ** p < 0.01; and *** p < 0.001.
Figure 3
Figure 3
tOCN, cOCN, and unOCN across all phases in KetoSAge participants. Fasting plasma concentrations of (A) tOCN, (B) cOCN, and (C) unOCN were measured following each of the study phases: baseline nutritional ketosis (NK), P1; intervention to suppress ketosis (SuK), P2; and removal of SuK returning to NK, P3; total OCN (tOCN) and uncarboxylated OCN (unOCN) were determined by ELISA and carboxylated OCN (cOCN) was calculated by subtracting unOCN from tOCN. Samples were taken at 8 a.m. after a 12 h overnight fast; (n = 10); tOCN and cOCN data were analysed by repeated measures one-way ANOVA with Tukey’s correction for multiple comparisons, unOCN data were analysed using the Friedman test with Dunn’s correction for multiple comparisons. * p < 0.05 and ** p < 0.01.
Figure 4
Figure 4
Percentage change from baseline P1 at 100% for tOCN, cOCN, and unOCN across all phases in KetoSAge participants. Fasting plasma concentrations of (A) tOCN, (B) cOCN, and (C) unOCN were measured following each of the study phases: baseline nutritional ketosis (NK), P1; intervention to suppress ketosis (SuK), P2; and removal of SuK returning to NK, P3; total OCN (tOCN) and uncarboxylated OCN (unOCN) were determined by ELISA, carboxylated OCN (cOCN) was calculated by subtracting unOCN from tOCN. Samples were taken at 8 a.m. after a 12 h overnight fast; (n = 10); data were analysed by repeated measures one-way ANOVA with Tukey’s correction for multiple comparisons. * p < 0.05 and ** p < 0.01.
Figure 5
Figure 5
Serum leptin across all phases in KetoSAge participants. Fasting serum concentrations of leptin were measured following each of the study phases: baseline nutritional ketosis (NK), P1; intervention to suppress ketosis (SuK), P2; and removal of SuK returning to NK, P3. Leptin was determined by via ELISA (DuoSet, R&D Systems, Minneapolis, MN, USA). Samples were taken at 8 a.m. after a 12 h overnight fast; (n = 10). Data were analysed by repeated measures one-way ANOVA. ** p < 0.01.
Figure 6
Figure 6
Serum cortisol and serotonin across all phases in KetoSAge participants. Fasting serum concentrations of cortisol and plasma serotonin were measured following each of the study phases: baseline nutritional ketosis (NK), P1; intervention to suppress ketosis (SuK), P2; and removal of SuK returning to NK, P3; cortisol was measured externally by SYNLAB Belgium (Alexander Fleming, 3–6220 Heppignies–Company No: 0453.111.546), serotonin was measured by ELISA (Abcam, Cambridge, UK). Samples were taken at 8 a.m. after a 12 h overnight fast; (n = 10). Data were analysed by Friedman test with Dunn’s correction for multiple comparisons.
Figure 7
Figure 7
Serum concentrations of active GLP-1 across all phases in KetoSAge participants. Serum concentrations of active GLP-1 were measured following each of the study phases: baseline nutritional ketosis (NK), P1; intervention to suppress ketosis (SuK), P2; and removal of SuK returning to NK, P3. GLP-1 was determined by ELISA (Abcam, Cambridge, UK). Glucagon-like peptide-1 (GLP-1). Samples were taken at 8 a.m. after a 12 h overnight fast; (n = 10). Data were analysed by repeated measures one-way ANOVA. * p < 0.05.

References

    1. Yang H., Gong R., Liu M., Deng Y., Zheng X., Hu T. HOMA-IR is positively correlated with biological age and advanced aging in the US adult population. Eur. J. Med. Res. 2023;28:470. doi: 10.1186/s40001-023-01448-1. - DOI - PMC - PubMed
    1. Cooper I.D., Kyriakidou Y., Petagine L., Edwards K., Elliott B.T. Bio-hacking better health—Leveraging metabolic biochemistry to maximise healthspan. Antioxidants. 2023;12:1749. doi: 10.3390/antiox12091749. - DOI - PMC - PubMed
    1. UN World Population Ageing 2019: Highlights. [(accessed on 13 September 2023)]. Available online: https://www.un.org/en/development/desa/population/publications/pdf/agein....
    1. WHO Global Health Estimates: Leading Causes of Death. 2019. [(accessed on 13 September 2023)]. Available online: https://www.who.int/data/gho/data/themes/mortality-and-global-health-est....
    1. ONS Death Registration Summary Statistics, England and Wales—Office for National Statistics. ONS Website. [(accessed on 14 September 2023)];2023 Available online: https://www.ons.gov.uk/peoplepopulationandcommunity/birthsdeathsandmarri....

LinkOut - more resources