. 2024 Jun 25;14(7):756.
doi: 10.3390/biom14070756.

Evaluation of the Effect of β-Wrapin AS69 in a Mouse Model Based on Alpha-Synuclein Overexpression

Affiliations

Evaluation of the Effect of β-Wrapin AS69 in a Mouse Model Based on Alpha-Synuclein Overexpression

Lennart Höfs et al. Biomolecules. .

Abstract

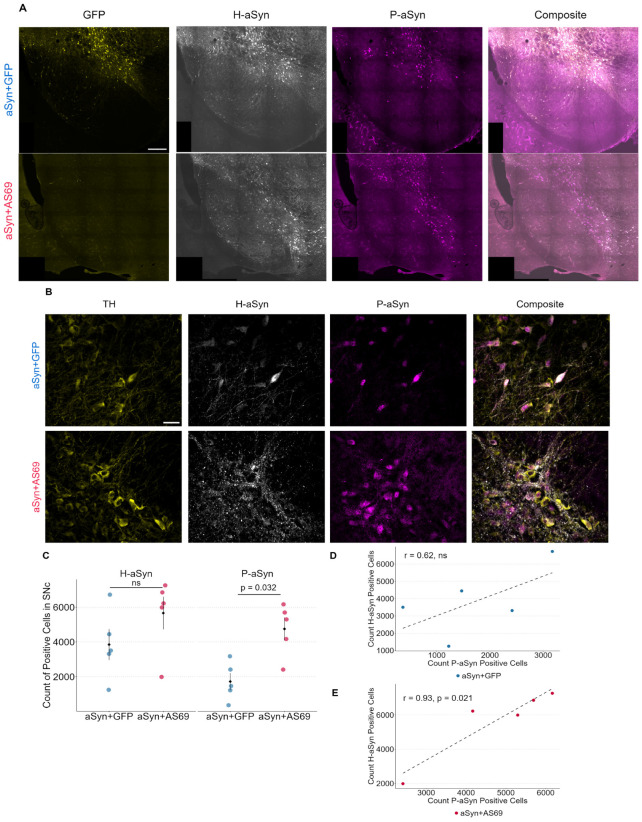
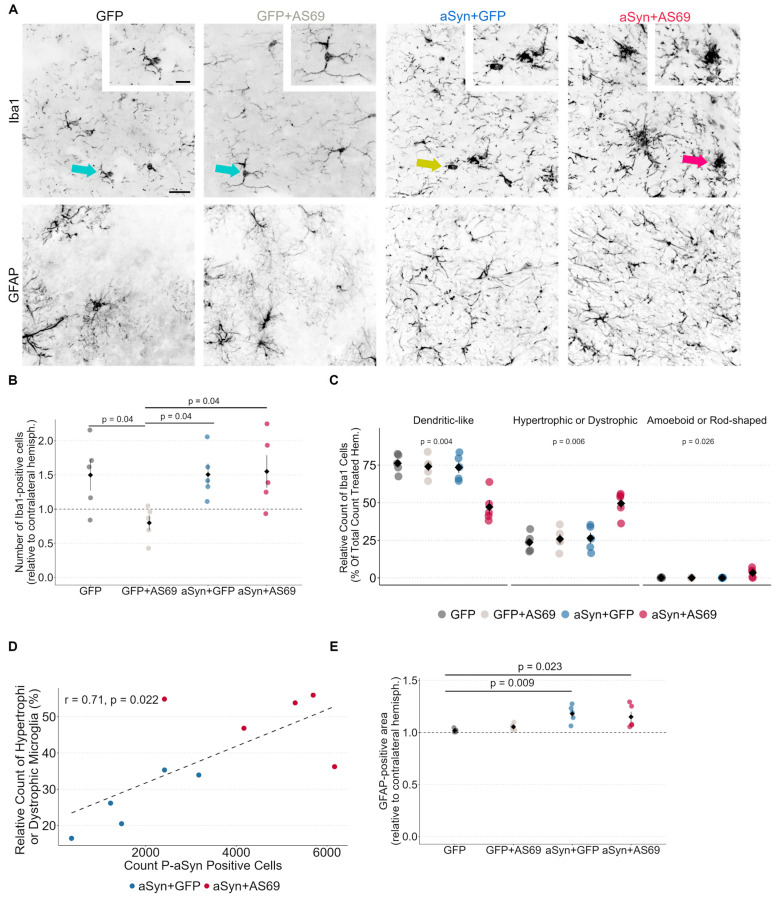
Aggregation of the protein α-Synuclein (αSyn) is a hallmark of Parkinson's disease (PD), dementia with Lewy bodies (DLB) and multiple systems atrophy, and alleviating the extent of αSyn pathology is an attractive strategy against neurodegeneration. The engineered binding protein β-wrapin AS69 binds monomeric αSyn. AS69 reduces primary and secondary nucleation as well as fibril elongation in vitro. It also mitigates aSyn pathology in a mouse model based on intrastriatal injection of aSyn pre-formed fibrils (PFFs). Since the PFF-based model does not represent all aspects of PD, we tested here whether AS69 can reduce neurodegeneration resulting from αSyn overexpression. Human A53T-αSyn was overexpressed in the mouse Substantia nigra (SN) by using recombinant adeno-associated viral vector (rAAV). AS69 was also expressed by rAAV transduction. Behavioral tests and immunofluorescence staining were used as outcomes. Transduction with rAAV-αSyn resulted in αSyn pathology as reported by phospho-αSyn staining and caused degeneration of dopaminergic neurons in the SN. The co-expression of rAAV-AS69 did not reduce αSyn pathology or the degeneration of dopaminergic neurons. We conclude that αSyn monomer binding by rAAV-AS69 was insufficient to protect from aSyn pathology resulting from αSyn overexpression.

Keywords: AS69; PD; Parkinson’s disease; Substantia nigra; aggregation inhibitors; alpha-Synuclein; amyloid aggregation inhibitors; in vivo; mouse model; rAAV; recombinant adeno-associated viral vector; synuclein overexpression; α-Synuclein; β-wrapin.


Conflict of interest statement

The authors declare no conflicts of interest.

Figures

Figure 1
Figure 1
rAAV-AS69 does not attenuate αSyn-induced motor deficits. (A) Illustration of the study design. Five mice per group received unilateral stereotactic injections of rAAV into the substantia nigra pars compacta. Cylinder tests were performed one day before injection and four weeks and eight weeks after injection of rAAV. (B) Time required for 25 forepaw contacts with the glass cylinder wall at the indicated time points. Markers represent individual animals (n = 5). Kruskal–Wallis multiple comparisons followed by Dunn’s test as post hoc analysis, p-values were adjusted with the Holm method (p-value = 0.016 for GFP vs. αSyn + GFP). Non-significant results are not annotated or if shown are indicated by “ns”.
Figure 2
Figure 2
rAAV-AS69 does not prevent the degeneration of TH-positive neurons and dendrites. (A) Representative images for each cohort of the SN in the mouse midbrain stained for TH. Cohorts as indicated above each image. SNc is highlighted in blue and SNr is encircled in red. Scale bar: 200 μm. (B) Number of TH-positive neurons in the substantia nigra pars compacta relative to the contralateral hemisphere. Markers represent individual animals (n = 5). Comparison by two-way ANOVA (p-value = 0.0001 for factor GFP vs. αSyn; p-value = 0.942 for factor GFP vs. AS69). (C) Signal intensity of TH-positive dendrites in the SNr relative to the contralateral hemisphere. Labels represent individual animals (n = 5 animals per group). Comparison by two-way ANOVA (p-value = 0.0002 for GFP vs. αSyn; p-value = 0.531 for GFP vs. AS69). (D) Representative images of dopaminergic axon terminals, labeled by TH, in the striatum. Cohorts as indicated above each image. Scale bar: 30 μm. (E) TH-positive area in the striatum relative to the contralateral hemisphere. Markers represent individual animals (n = 5 for αSyn + GFP and n = 3 for αSyn + AS69). Non-significant results are annotated as “ns”.
Figure 3
Figure 3
Transduction with rAAV-AS69 is associated with an increase in P-αSyn pathology. (A) Representative images of the SN showing GFP (yellow), H-αSyn (gray) and P-αSyn (magenta). Cohorts as indicated by row labels. Scale bar: 200 μm. (B) Representative high magnification images of TH-positive neurons (yellow), H-αSyn (gray) and P-αSyn (magenta) in the SNc. Scale bar: 30 μm. (C) Count of positive cells for H-αSyn and P-αSyn in the SNc of indicated cohorts. Markers represent individual animals (n = 5). Comparisons by Wilcoxon rank sum exact test (p-value = 0.22 for H-αSyn and annotated with non-significant “ns”; p-value = 0.032 for P-αSyn). (D) Correlation of H-αSyn and P-αSyn in animals transduced with rAAV-αSyn and rAAV-GFP. Pearson’s product–moment correlation at r = 0.63 (p-value = 0.26 and annotated with “ns”). Dotted line represents the corresponding generalized linear mixed model. (E) Correlation of H-αSyn and P-αSyn in animals transduced with rAAV-αSyn and rAAV-AS69. Pearson’s product–moment correlation at r = 0.93 (p-value = 0.021). Dotted line represents the corresponding generalized linear mixed model.
Figure 4
Figure 4
Microglia are particularly activated in αSyn + AS69-expressing mice and astrogliosis is not attenuated by rAAV-AS69. (A) Representative images of Iba1-positive microglia and GFAP-positive astrocytes in the SNc. Ramified microglia are highlighted by the green arrows. The yellow arrow indicates a dystrophic microglial cell and the red arrow shows an amoeboid microglial cell. Cohorts as indicated by the column names. Scale bar: 40 μm. Individual cells are shown in higher magnification in the inset. Scale bar: 20 μm. (B) Count of Iba1-positive cells in the SNc relative to the contralateral hemisphere. Labels represent individual animals (n = 5). Comparisons by multiple t-tests, p-values were adjusted for multiple testing with the Benjamini–Hochberg method (p-value= 0.04 for GFP vs. GFP + AS69, GFP + AS69 vs. αSyn + GFP and GFP + AS69 vs. αSyn + AS69). (C) Occurrence of each morphological microglia phenotype relative to the total count of microglia in the injected SNc. Labels represent individual animals (n = 5). Comparisons by two-way ANOVA followed by Tukey’s HSD (dendrite-like: p-value = 0.0008 for GFP vs. αSyn, p-value = 0.001 for GFP vs. AS69, p-value = 0.004 for the interaction; post hoc analysis: p-value = 0.0001 for GFP vs. αSyn + AS69, p-value = 0.0004 for GFP + AS69 vs. αSyn + AS69, p-value = 0.0005 for αSyn + GFP vs. αSyn + AS69; hypertrophic or dystrophic: p-value = 0.001 for GFP vs. αSyn, p-value = 0.001 for GFP vs. AS69, p-value = 0.007 for the interaction; post hoc analysis: p-value = 0.0003 for GFP vs. αSyn + AS69, p-value = 0.0007 for GFP + AS69 vs. αSyn + AS69, p-value = 0.0009 for αSyn + GFP vs. αSyn + AS69; amoeboid or rod-shaped: p-value = 0.029 for GFP vs. αSyn, p-value = 0.027 for GFP vs. AS69, p-value = 0.0256 for the interaction; post hoc analysis: p-value = 0.017 for GFP vs. αSyn + AS69, p-value = 0.016 for GFP + AS69 vs. αSyn + AS69, p-value = 0.015 for αSyn + GFP vs. αSyn + AS69). (D) Correlation of the count of P-αSyn-positive cells in the SN and microglia classified as “hypertrophic or dystrophic microglia” in the SN. Pearson’s product-moment correlation r = 0.71 (p-value = 0.022). Dotted line represents the corresponding generalized linear mixed model. (E) GFAP-positive area in the SNc relative to the contralateral hemisphere. Labels represent individual animals (n = 5). Kruskal–Wallis multiple comparisons followed by Dunn’s test as post hoc analysis, p-values were adjusted with the Holm method (p-value = 0.009 for GFP vs. αSyn + GFP, p-value = 0.023 for GFP vs. αSyn + AS69).

Similar articles

Cited by

References

    1. Obeso J.A., Stamelou M., Goetz C.G., Poewe W., Lang A.E., Weintraub D., Burn D., Halliday G.M., Bezard E., Przedborski S., et al. Past, Present, and Future of Parkinson’s Disease: A Special Essay on the 200th Anniversary of the Shaking Palsy. Mov. Disord. 2017;32:1264–1310. doi: 10.1002/mds.27115. - DOI - PMC - PubMed
    1. Rodger A.T., ALNasser M., Carter W.G. Are Therapies That Target α-Synuclein Effective at Halting Parkinson’s Disease Progression? A Systematic Review. Int. J. Mol. Sci. 2023;24:11022. doi: 10.3390/ijms241311022. - DOI - PMC - PubMed
    1. Mirecka E.A., Shaykhalishahi H., Gauhar A., Akgül Ş., Lecher J., Willbold D., Stoldt M., Hoyer W. Sequestration of a β-Hairpin for Control of α-Synuclein Aggregation. Angew. Chem. Int. Ed. 2014;53:4227–4230. doi: 10.1002/anie.201309001. - DOI - PubMed
    1. Agerschou E.D., Flagmeier P., Saridaki T., Galvagnion C., Komnig D., Heid L., Prasad V., Shaykhalishahi H., Willbold D., Dobson C.M., et al. An Engineered Monomer Binding-Protein for α-Synuclein Efficiently Inhibits the Proliferation of Amyloid Fibrils. eLife. 2019;8:e46112. doi: 10.7554/eLife.46112. - DOI - PMC - PubMed
    1. Szegő É.M., Boß F., Komnig D., Gärtner C., Höfs L., Shaykhalishahi H., Wördehoff M.M., Saridaki T., Schulz J.B., Hoyer W., et al. A β-Wrapin Targeting the N-Terminus of α-Synuclein Monomers Reduces Fibril-Induced Aggregation in Neurons. Front. Neurosci. 2021;15:696440. doi: 10.3389/fnins.2021.696440. - DOI - PMC - PubMed

LinkOut - more resources