. 2024 Jul 10;25(14):7565.
doi: 10.3390/ijms25147565.

Melanocortin-4 Receptor PLC Activation Is Modulated by an Interaction with the Monocarboxylate Transporter 8

Affiliations

Melanocortin-4 Receptor PLC Activation Is Modulated by an Interaction with the Monocarboxylate Transporter 8

Larissa Anthofer et al. Int J Mol Sci. .

Abstract

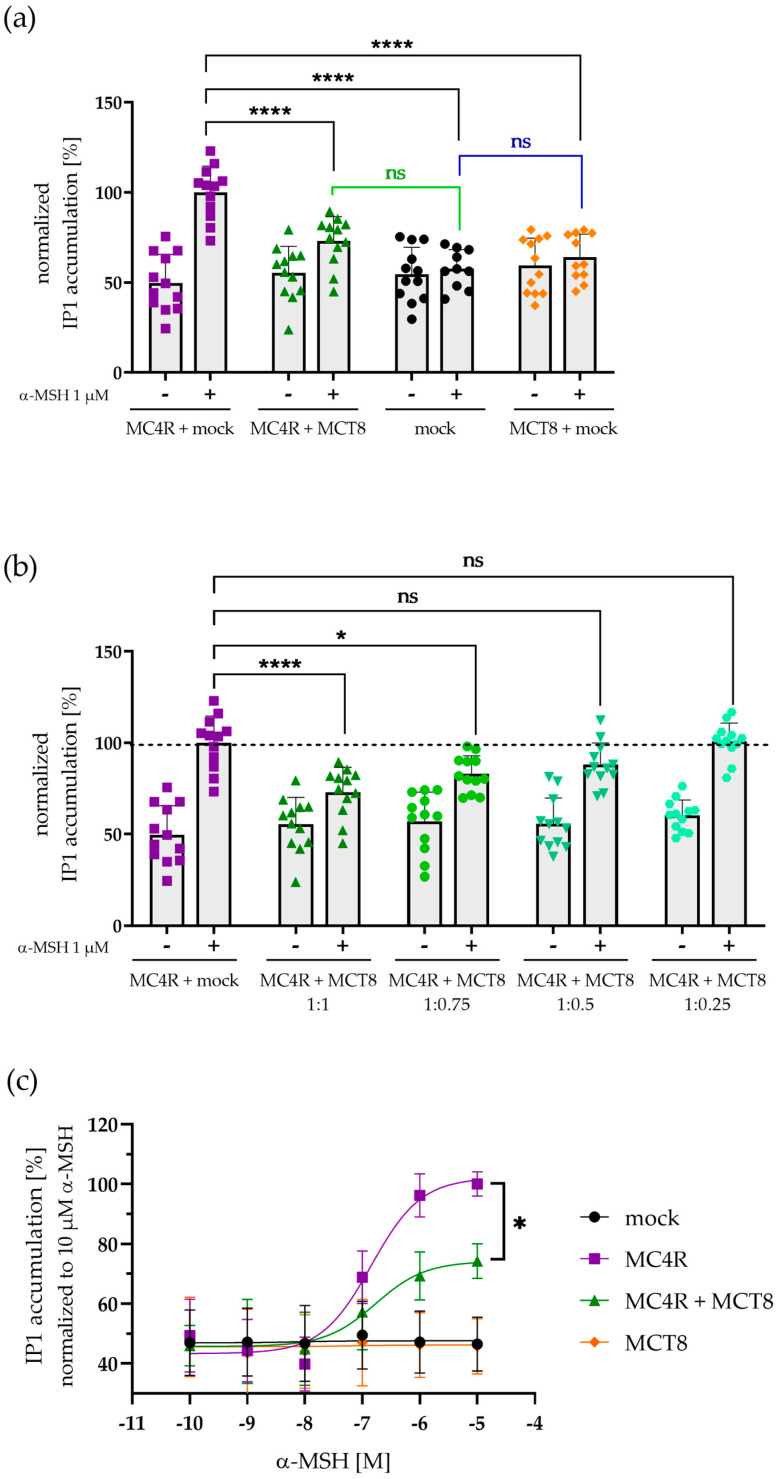
The melanocortin-4 receptor (MC4R) is a key player in the hypothalamic leptin-melanocortin pathway that regulates satiety and hunger. MC4R belongs to the G protein-coupled receptors (GPCRs), which are known to form heterodimers with other membrane proteins, potentially modulating receptor function or characteristics. Like MC4R, thyroid hormones (TH) are also essential for energy homeostasis control. TH transport across membranes is facilitated by the monocarboxylate transporter 8 (MCT8), which is also known to form heterodimers with GPCRs. Based on the finding in single-cell RNA-sequencing data that both proteins are simultaneously expressed in hypothalamic neurons, we investigated a putative interplay between MC4R and MCT8. We developed a novel staining protocol utilizing a fluorophore-labeled MC4R ligand and demonstrated a co-localization of MC4R and MCT8 in human brain tissue. Using in vitro assays such as BRET, IP1, and cAMP determination, we found that MCT8 modulates MC4R-mediated phospholipase C activation but not cAMP formation via a direct interaction, an effect that does not require a functional MCT8 as it was not altered by a specific MCT8 inhibitor. This suggests an extended functional spectrum of MCT8 as a GPCR signaling modulator and argues for the investigation of further GPCR-protein interactions with hitherto underrepresented physiological functions.

Keywords: BRET; MC4R; MCT8; fluorophore-labeled ligand; heterodimerization; protein–protein interaction.


Conflict of interest statement

The authors declare no conflicts of interest.

Figures

Figure 1
Figure 1
Staining of MCT8 and MC4R in tissue of the human paraventricular hypothalamus. Tissue was stained with anti-MCT8 ((b), green) and TAMRA-NDP-α-MSH ((c), red) to enable MC4R staining. Nuclei were counterstained with DAPI ((a), blue). In addition to extensive MCT8 staining in endothelial cells ((b), top left, indicated by green arrow), MCT8 and MC4R co-staining was found in neurons ((d), purple soma indicated by white arrow).
Figure 2
Figure 2
Investigation of MC4R–MCT8 heterodimer formation. An interaction between MC4R and MCT8 was analyzed with the NanoBRET™ assay using C-terminally tagged constructs. (a) HEK293 cells were co-transfected with the BRET partners MCT8-HaloTag (HT) and NanoLuciferase (NL)-tagged MC4R/TSHR/Rab6b. The close proximity of the BRET partners results in energy transfer manifesting in a high BRET ratio. While the negative control pair Rab6b–MCT8 demonstrated a low BRET ratio, the pair under investigation (MC4R–MCT8) showed a higher BRET ratio than the positive control TSHR-MCT8. Values represent mean ± SEM from four independent experiments with three technical replicates. Individual values from technical replicates were pooled and the mean was used for analysis. A one-way ANOVA was performed for statistical analysis and the mean of the positive control TSHR–MCT8 was compared to the mean of all other BRET pairs. Statistical significance was defined as *** p < 0.001 and **** p < 0.0001. (b) A Donor Saturation Assay was performed to investigate the specificity of the MC4R–MCT8 interaction. HEK293 cells were transfected with an increasing amount of donor (MC4R-NL, Rab6b-NL, TSHR-NL) while keeping the amount of acceptor (MCT8-HT) constant. The positive control (TSHR–MCT8) and MC4R–MCT8 demonstrated a specific interaction, while the negative control (Rab6b–MCT8) resulted in a linear increase in the BRET ratio, demonstrating a non-specific interaction. Values represent mean ± SEM from two independent experiments.
Figure 3
Figure 3
MC4R-mediated cAMP formation in the presence and absence of MCT8. (a) Time-dependent changes in GloSensor™ cAMP luminescence after stimulation with α-MSH were determined. HEK293 cells were co-transfected with MC4R + mock or MC4R + MCT8 in addition to luciferase-containing F22 reporter plasmid, stimulated with α-MSH in concentrations ranging from 10−6 M to 10−8 M (time point of stimulation indicated by black arrow), and cAMP formation was measured. No significant differences in cAMP concentrations were observed in the absence or presence of MCT8, shown by the calculated area under the curve (b). Values represent mean ± SEM from four independent experiments. Each experiment contained six biological replicates, whose individual values were pooled for analysis. Statistical analysis was performed using an ordinary two-way ANOVA with Sidak’s multiple comparison test with statistical significance set at p < 0.05, nonsignificant marked as ns. (c) Concentration–response curve of MC4R-mediated cAMP accumulation after stimulation with α-MSH in concentrations ranging from 10−12 M to 10−6 M. HEK293 cells were co-transfected with MC4R + mock or MC4R + MCT8 and cAMP accumulation was measured using the AlphaScreen® assay. No differences were detected in MC4R-dependent cAMP formation in the presence of MCT8 compared to its absence, neither when stimulated nor in basal conditions (d). Concentration–response curves were analyzed by fitting a non-linear regression model for sigmoidal response. Values represent individual measurement values ± SD from four independent experiments with three biological replicates.
Figure 4
Figure 4
MC4R-mediated IP1 accumulation after stimulation with α-MSH is dependent on the presence and concentration of MCT8. (a) HEK293 cells were co-transfected with MC4R + mock or MC4R + MCT8 and IP1 accumulation was measured in basal conditions and after stimulation with 1 µM α-MSH. IP1 concentrations were calculated using a standard curve and normalized to MC4R + mock. There were no significant differences in IP1 formation in basal conditions. When stimulated with 1 µM α-MSH, significant differences in IP1 concentrations were detected in the presence of MCT8 (black asterisks). Mock- and MCT8 + mock-transfected samples (blue line) along with MC4R + MCT8- and mock-transfected samples (green line) demonstrated no significant differences in IP1 accumulation. (b) HEK293 cells were co-transfected with MC4R + mock or MC4R + MCT8 in different ratios (indicated on the x-axis) and stimulated with 1 µM α-MSH. With decreasing concentrations of MCT8, significant differences in IP1 accumulation were no longer present, and IP1 concentrations approached MC4R + mock-transfected levels again. Values represent individual measurement values ± SD from four independent experiments with three technical replicates. After testing for normal distribution of the data, a one-way ANOVA was performed for statistical analysis, and Holm–Sidak’s multiple comparison test was performed by comparing the values of MC4R + mock to other values. Statistical significance was defined as * p < 0.05 and **** p < 0.0001. (c) HEK293 cells were co-transfected with MC4R + mock or MC4R + MCT8 in a 1:1 ratio and IP1 accumulation was measured after stimulation with α-MSH in concentrations ranging from 10−5 M to 10−10 M. IP1 concentrations were calculated analogously to above. The presence of MCT8 resulted in a significant decrease in the efficacy of MC4R-mediated PLC activation. Values represent individual measurement values ± SD from four independent experiments with three technical replicates. Statistical analysis was performed using an unpaired one-way ANOVA with the Kruskal–Wallis test to compare the Emax of MC4R + mock and MC4R + MCT8. Statistical significance was defined as * p < 0.05, nonsignificant marked as ns.
Figure 5
Figure 5
Analysis of MC4R and MCT8 cell surface expression with biotinylation and HiBiT assays. (a) HEK293 cells were transfected with SNAP–MC4R + mock, HA–MCT8 + mock, or co-transfected with SNAP–MC4R + HA–MCT8. Western blotting of biotinylated cell surface proteins demonstrated no change in the cell surface expression of MC4R or MCT8 in the presence or absence of one another. Pan-Cadherin, a plasma membrane marker protein, was used as a loading control. (b) HEK293 cells were co-transfected with HiBiT–MC4R + mock or HiBiT–MC4R + MCT8. The cell surface and total expression levels of HiBiT-MC4R did not show a significant change in the presence of MCT8 compared to its absence. Values represent mean ± SEM from three independent experiments. A two-way ANOVA was performed for statistical analysis with Dunn’s multiple comparison test. Nonsignificant marked as ns.

Similar articles

References

    1. Kühnen P., Krude H., Biebermann H. Melanocortin-4 Receptor Signalling: Importance for Weight Regulation and Obesity Treatment. Trends Mol. Med. 2019;25:136–148. doi: 10.1016/j.molmed.2018.12.002. - DOI - PubMed
    1. Ju S.H., Cho G.-B., Sohn J.-W. Understanding melanocortin-4 receptor control of neuronal circuits: Toward novel therapeutics for obesity syndrome. Pharmacol. Res. 2018;129:10–19. doi: 10.1016/j.phrs.2018.01.004. - DOI - PubMed
    1. Gantz I., Konda Y., Tashiro T., Shimoto Y., Miwa H., Munzert G., Watson S.J., DelValle J., Yamada T. Molecular cloning of a novel melanocortin receptor. J. Biol. Chem. 1993;268:8246–8250. doi: 10.1016/S0021-9258(18)53088-X. - DOI - PubMed
    1. Clément K., Biebermann H., Farooqi I.S., van der Ploeg L., Wolters B., Poitou C., Puder L., Fiedorek F., Gottesdiener K., Kleinau G., et al. MC4R agonism promotes durable weight loss in patients with leptin receptor deficiency. Nat. Med. 2018;24:551–555. doi: 10.1038/s41591-018-0015-9. - DOI - PubMed
    1. Newman E.A., Chai B.-X., Zhang W., Li J.-Y., Ammori J.B., Mulholland M.W. Activation of the melanocortin-4 receptor mobilizes intracellular free calcium in immortalized hypothalamic neurons. J. Surg. Res. 2006;132:201–207. doi: 10.1016/j.jss.2006.02.003. - DOI - PubMed

MeSH terms

LinkOut - more resources