. 2024 Jul 10;25(14):7568.
doi: 10.3390/ijms25147568.

Morphological and Functional Alterations in the CA1 Pyramidal Neurons of the Rat Hippocampus in the Chronic Phase of the Lithium-Pilocarpine Model of Epilepsy

Affiliations

Morphological and Functional Alterations in the CA1 Pyramidal Neurons of the Rat Hippocampus in the Chronic Phase of the Lithium-Pilocarpine Model of Epilepsy

Tatyana Y Postnikova et al. Int J Mol Sci. .

Abstract

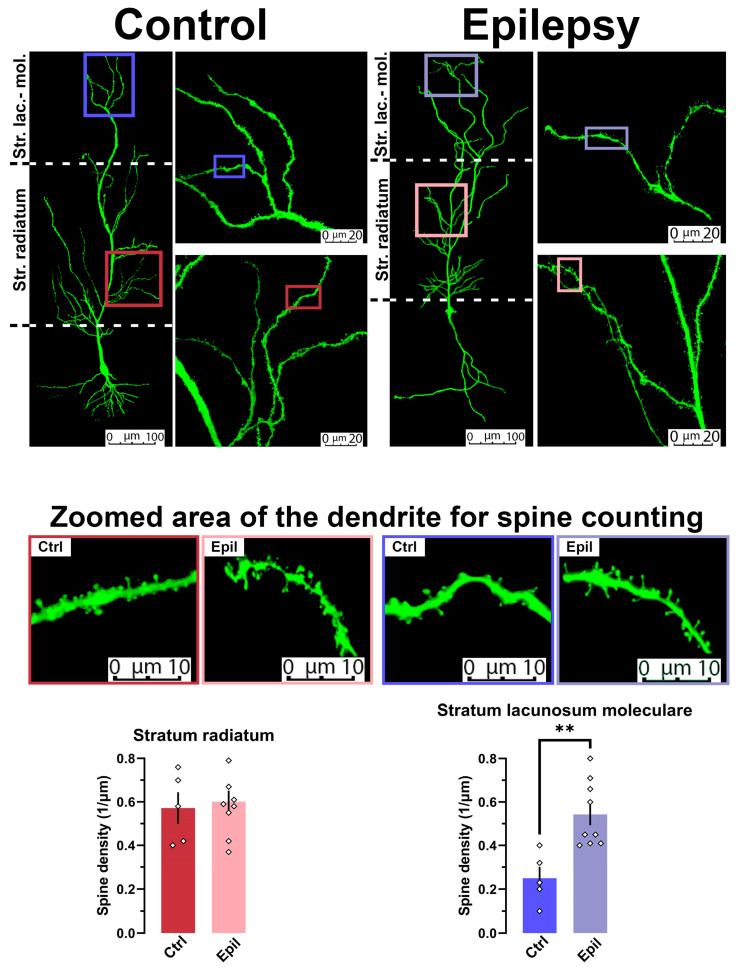
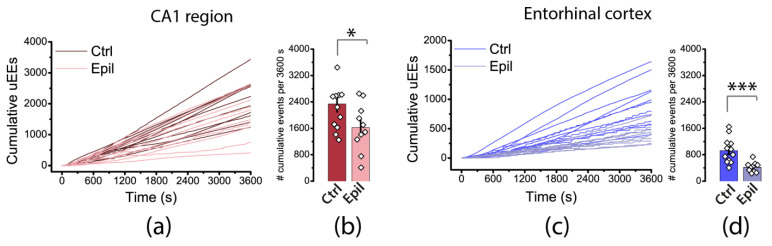
Epilepsy is known to cause alterations in neural networks. However, many details of these changes remain poorly understood. The objective of this study was to investigate changes in the properties of hippocampal CA1 pyramidal neurons and their synaptic inputs in a rat lithium-pilocarpine model of epilepsy. In the chronic phase of the model, we found a marked loss of pyramidal neurons in the CA1 area. However, the membrane properties of the neurons remained essentially unaltered. The results of the electrophysiological and morphological studies indicate that the direct pathway from the entorhinal cortex to CA1 neurons is reinforced in epileptic animals, whereas the inputs to them from CA3 are either unaltered or even diminished. In particular, the dendritic spine density in the str. lacunosum moleculare, where the direct pathway from the entorhinal cortex terminates, was found to be 2.5 times higher in epileptic rats than in control rats. Furthermore, the summation of responses upon stimulation of the temporoammonic pathway was enhanced by approximately twofold in epileptic rats. This enhancement is believed to be a significant contributing factor to the heightened epileptic activity observed in the entorhinal cortex of epileptic rats using an ex vivo 4-aminopyridine model.

Keywords: 4-aminopyridine model; action potential; entorhinal cortex; hippocampus; ictal discharge; pyramidal neuron; temporal lobe epilepsy.


Conflict of interest statement

The authors declare no conflicts of interest. The funders had no role in the design of the study; in the collection, analyses, or interpretation of data; in the writing of the manuscript; or in the decision to publish the results.

Figures

Figure A1
Figure A1
Epileptiform activity induced by 4-aminopyridine in hippocampal–entorhinal cortex slices. (a) Simultaneous LFP recordings in brain slices from epileptic rats showing the development of ep-ileptiform activity after application of a proepileptic solution. Expanded views of an initial (b) and a steady (c) period of epileptiform activity are shown in the frames.
Figure 1
Figure 1
Nissl staining of neurons in the hippocampus in control (n = 7) and epileptic (n = 8) rats. The diagrams show the average number of Nissl-stained neurons per 100 µm of the cell layer. The dots show the individual values for each rat. Asterisks denote significant differences between groups based on Student’s t-test: * p < 0.05; *** p < 0.001.
Figure 2
Figure 2
Firing patterns of CA1 pyramidal neurons in control (Ctrl) and epileptic (Epil) rats. (a) Representative examples of the membrane responses to the steps of hyperpolarizing and subthreshold depolarizing current in CA1 neurons from control and epileptic animals showing that the membrane input resistance and τ are unaltered. (b) Representative examples of the membrane responses of CA1 neurons to the depolarizing steps of the rheobase current (bottom), 2 x rheobase current (middle), and current sufficient to elicit the depolarizing block (top). (c) Representative examples of the fast and medium AHP phases of the APs in CA1 neurons. (d) The current–frequency curves for the same neurons shown in (b). (e) Averaged current–frequency curves of CA1 neurons.
Figure 3
Figure 3
Firing properties in CA1 pyramidal cells from control (Ctrl) and epileptic (Epil) rats. The dots show the individual values for each neuron. Asterisks denote significant differences between groups based on Student’s t-test: ** p < 0.01.
Figure 4
Figure 4
The inputs from the entorhinal cortex and the CA3 region of the hippocampus to CA1 pyramidal neurons are altered in epileptic rats. (a) Schematic representation of the location of the electrodes used for the stimulation of Schaffer’s collaterals and the temporoammonic pathways. (b,d) Representative examples of recordings of two-pulse (b) and train (d) evoked excitatory postsynaptic currents (eEPSCs) of Shaffer collaterals (red) and temporoammonic pathway (blue) in control (ctrl) and epileptic (epil) rats. (c) Bar graphs illustrating the paired-pulse ratios in the various groups. The dots show the individual values for each neuron. * p < 0.05, Student’s t-test. (e) Normalized amplitude of eEPSCs obtained during short-train stimulation. A repeated measures ANOVA was conducted, followed by the Šidák post hoc test; * p < 0.05, ** p < 0.01, and *** p < 0.001.
Figure 5
Figure 5
In epileptic rats, spine density is observed to increase on apical dendrites of pyramidal neurons in stratum lacunosum moleculare. The images above illustrate examples of biocytin-filled and confocal reconstructed pyramidal neurons in control and epileptic rats at different magnifications. The bottom bar diagrams illustrate the density of spines on dendrites of CA1 pyramidal neurons, with the data presented in different layers. The dots show the individual values for each neuron. ** p < 0.01, Student’s t-test.
Figure 6
Figure 6
Epileptiform activity induced by 4-aminopyridine in hippocampus–entorhinal cortex slices. (a) The drawing shows the position of the electrodes in the hippocampus and entorhinal cortex. Simultaneous LFP recordings in brain slices from control (b) and epileptic (c) rats showing the development of epileptiform activity after the application of a proepileptic solution. Expanded views of a representative period of epileptiform activity are displayed on a light brown background, with corresponding spectrograms shown on the right-hand side. Low-amplitude LFP changes correlating with ictal discharge are observed in the hippocampus of epileptic animals during ictal discharge in the entorhinal cortex (inset, light green background).
Figure 7
Figure 7
Cumulative plots of unitary epileptiform events (uEEs) in the hippocampus (a) and entorhinal cortex (c) of control and epileptic rats. The bar graphs on the right-hand side (b,d) display the average number of uEEs per hour of recording, along with their standard error of measurement. Each point on the graph represents one brain slice. Asterisks indicate significant differences between groups according to Student’s test: * p < 0.05; *** p < 0.001.
Figure 8
Figure 8
The frequency of uEEs may be reduced due to neurodegeneration in the hippocampus. The interevent intervals (IEIs) distributions in the hippocampi of control and epileptic rats are shown in (a). The bar graphs in (b) display the averages of the greatest mode of distributions of IEIs in control and epileptic rats. Each point on the graph represents one brain slice. Asterisk indicates significant differences between groups according to Student’s test: * p < 0.05.
Figure 9
Figure 9
The distribution of IEIs in the entorhinal cortex of control and epileptic rats for 1 h recordings (a) and for only ictal (b) and interictal (c) discharges. The bar graphs display the properties of the ictal discharges, including the latency of the first ictal discharge (d), the number of ictal discharges during 1 h recordings (e), the duration of ictal discharge (f), and the number of uEEs within an ictal discharge (g). Each dot on the graph represents one brain slice. Asterisks denote significant differences between groups based on Student’s t-test: * p < 0.05; ** p < 0.01.

Similar articles

Cited by

References

    1. World Health Organization Epilepsy. [(accessed on 29 January 2024)]. Available online: https://www.who.int/news-room/fact-sheets/detail/epilepsy.
    1. Wong R.K., Traub R.D., Miles R. Cellular Basis of Neuronal Synchrony in Epilepsy. Adv. Neurol. 1986;44:583–592. - PubMed
    1. Sills G.J., Rogawski M.A. Mechanisms of Action of Currently Used Antiseizure Drugs. Neuropharmacology. 2020;168:107966. doi: 10.1016/j.neuropharm.2020.107966. - DOI - PubMed
    1. Kloosterman F., van Haeften T., Lopes da Silva F.H. Two Reentrant Pathways in the Hippocampal-entorhinal System. Hippocampus. 2004;14:1026–1039. doi: 10.1002/hipo.20022. - DOI - PubMed
    1. Rolls E.T., Kesner R.P. A Computational Theory of Hippocampal Function, and Empirical Tests of the Theory. Prog. Neurobiol. 2006;79:1–48. doi: 10.1016/j.pneurobio.2006.04.005. - DOI - PubMed