. 2024 Jul 11;25(14):7593.
doi: 10.3390/ijms25147593.

CryoEM Workflow Acceleration with Feret Signatures

Affiliations

CryoEM Workflow Acceleration with Feret Signatures

Pierre Nottelet et al. Int J Mol Sci. .

Abstract

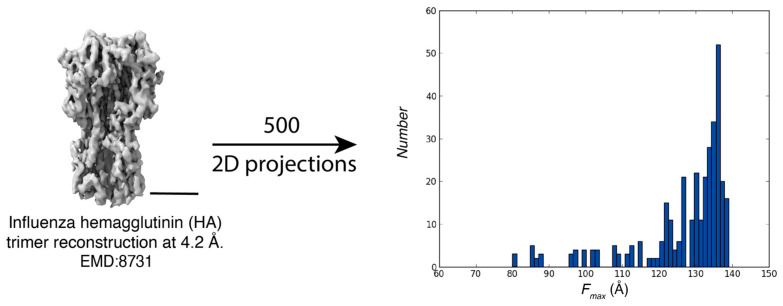
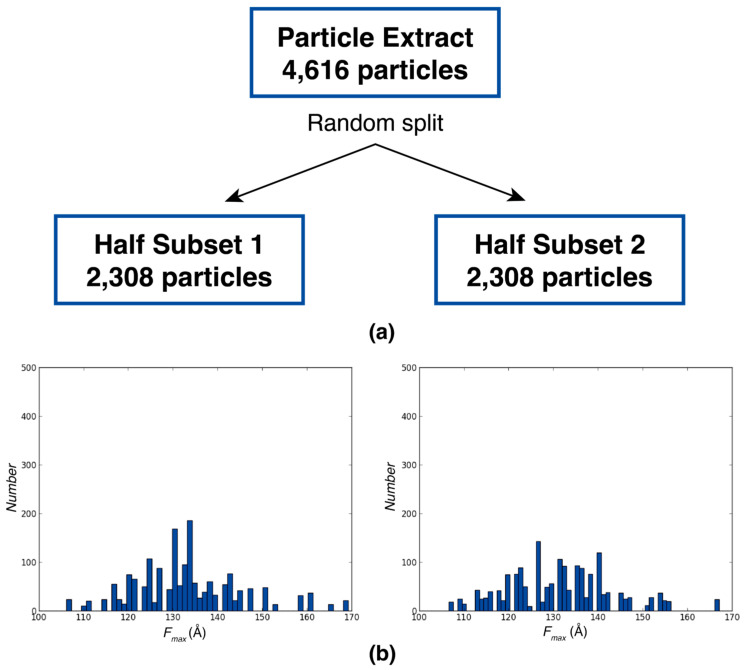
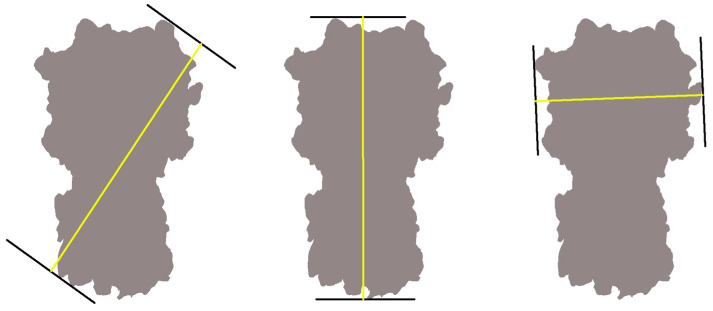
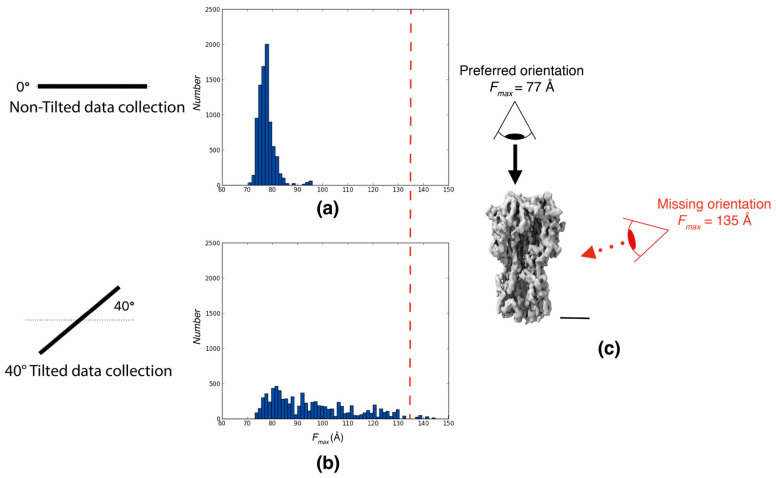
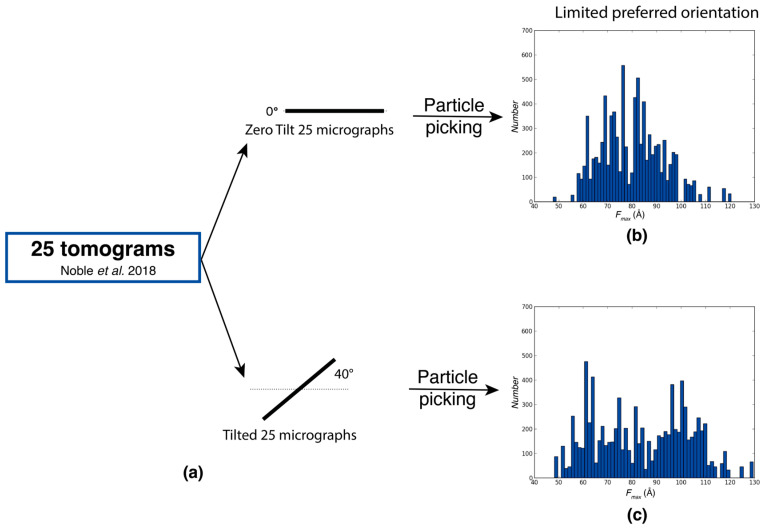
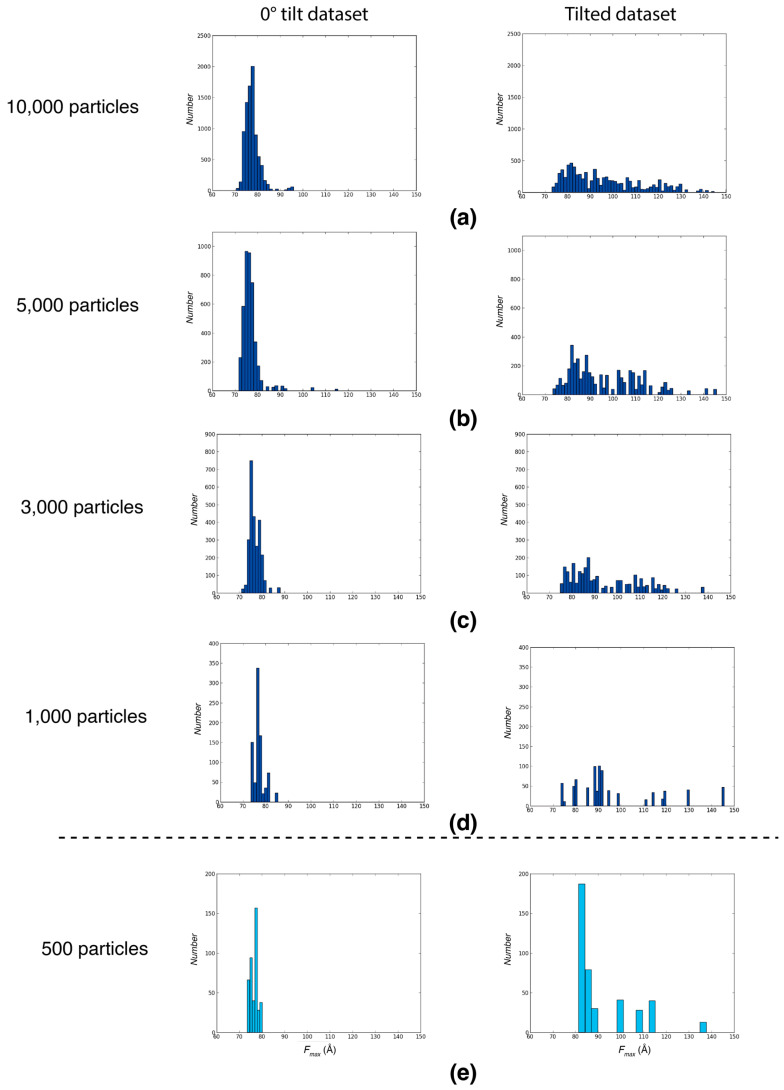
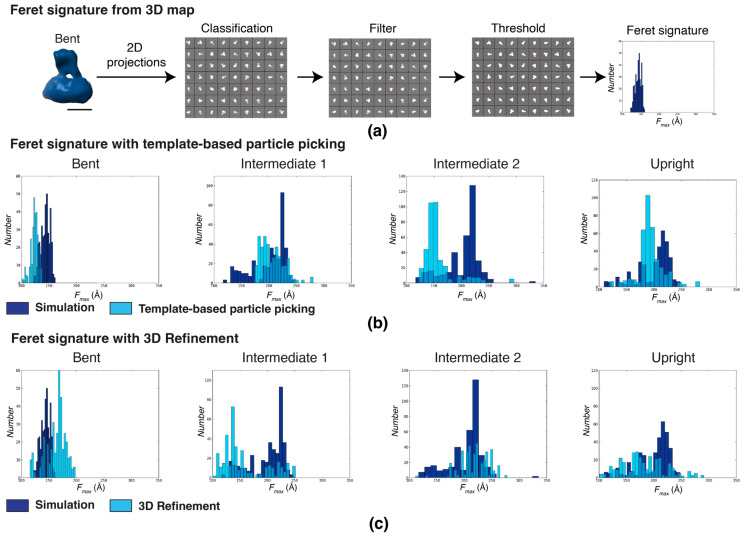
Common challenges in cryogenic electron microscopy, such as orientation bias, conformational diversity, and 3D misclassification, complicate single particle analysis and lead to significant resource expenditure. We previously introduced an in silico method using the maximum Feret diameter distribution, the Feret signature, to characterize sample heterogeneity of disc-shaped samples. Here, we expanded the Feret signature methodology to identify preferred orientations of samples containing arbitrary shapes with only about 1000 particles required. This method enables real-time adjustments of data acquisition parameters for optimizing data collection strategies or aiding in decisions to discontinue ineffective imaging sessions. Beyond detecting preferred orientations, the Feret signature approach can serve as an early-warning system for inconsistencies in classification during initial image processing steps, a capability that allows for strategic adjustments in data processing. These features establish the Feret signature as a valuable auxiliary tool in the context of single particle analysis, significantly accelerating the structure determination process.

Keywords: Feret signature; analytical tool; cryogenic electron microscopy; data processing; single particle analysis; structural biology; structure determination; workflow optimization.


Conflict of interest statement

The authors declare no conflicts of interest.

Figures

Figure A1
Figure A1
Characterization of preferred orientations using simulated Feret signatures. Fmax distributions from 2D projections of influenza hemagglutinin trimer reconstruction at 4.2 Å resolution (EMD:8731; scale bar = 40 Å).
Figure A2
Figure A2
Robustness of Feret signatures to random sampling. (a) Schematic of random split into two equivalent subsets. Initial dataset is beta-galactosidase extract from Relion tutorial. (b) Fmax distributions from particles randomly selected from first subset (left panel) and second subset (right panel).
Figure A3
Figure A3
Feret diameters. A Feret diameter (yellow) is the distance between two parallel tangents (black lines) of an object (gray); here, the side-view projection of Influenza Hemagglutinin. The projection can have many different Feret diameters, three are shown here, but only the maximum (center) is kept for the analysis.
Figure 1
Figure 1
An assessment of preferred orientation using Feret signatures. The Fmax distributions of particles randomly picked from particle extracts of 0° tilt and a tilted dataset of the Influenza hemagglutinin trimer from Tan et al. (2017) [8]. (a) Fmax distributions from particles picked from the 0° tilt dataset. (b) Fmax distributions from particles picked from the 40° tilt dataset. (c) Influenza hemagglutinin trimer reconstruction at 4.2 Å resolution (EMD:8731; scale bar = 40 Å). For all panels, black dots indicate the Fmax values for the preferred orientation, and red dots indicate the Fmax values for the missing orientation. The red line in (a,b) corresponds to the view marked in red in (c).
Figure 2
Figure 2
Assessment of limited preferred orientations using Feret signatures. Fmax distributions of particles randomly picked from 0° tilt dataset with limited preferred orientation, and tilted dataset of Rabbit Muscle Aldolase from Noble et al. (2018) [10]. (a) Extraction of micrographs and particle picking from tilt series at 0° tilt and 40° tilt. (b) Fmax distributions from particles selected from 0° tilt micrographs. (c) Fmax distributions from particles selected from 40° tilt micrographs.
Figure 3
Figure 3
Feret signature robustness during preferred orientation assessment. The Fmax distributions of particles randomly picked from a 0° tilt dataset with preferred orientation (left panels) and the respective tilted dataset (right panels) from Tan et al. (2017) [7], with the same dataset used for Figure 1. (a) Fmax distributions from 10,000 randomly picked particles per tilt. (b) Fmax distributions from 5000 randomly picked particles per tilt. (c) Fmax distributions from 3000 randomly picked particles per tilt. (d) Fmax distributions from 1000 randomly picked particles per tilt; the minimum number of particles required to detect a Feret signature. (e) Fmax distributions from 500 randomly picked particles per tilt. A detailed analysis of the influence of noise using simulation studies of differently sized and shaped particles [12] shows that the distinction between different Feret signatures is robust even if the signal-to-noise ratio is low. However, if the particles under investigation are nearly globular, the expected differences between the tilted and untilted distributions will be more subtle and a higher signal-to-noise ratio (i.e., more particles) may be necessary to make a robust conclusion about preferred orientations. Nevertheless, the number of required images will still be small compared to high-resolution datasets.
Figure 4
Figure 4
Feret signatures identify inconsistency in classification during the early stages of image processing. Fmax distributions of particles randomly picked using low-resolution templates of the four conformations determined by Xu et al. (2016) [15] (scale bar = 60 Å). (a) The procedure to generate the simulated Feret signature from synthetic 2D projections of a cryoEM template and (b) Fmax distributions of the simulated Feret signatures from the four integrin conformations: bent, intermediate 1, intermediate 2, and upright (from left to right, represented in dark blue). These are superimposed with the corresponding experimental Fmax distributions (light blue) derived by template-based particle picking. (c) Simulated Fmax distributions from the four integrin conformations (dark blue), superimposed with the corresponding experimental Fmax distributions derived from particles classified by 3D refinement.

Similar articles

Cited by

References

    1. Kühlbrandt W. The Resolution Revolution. Science. 2014;343:1443–1444. doi: 10.1126/science.1251652. - DOI - PubMed
    1. Subramaniam S. The Cryo-EM Revolution: Fueling the next Phase. IUCrJ. 2019;6:1–2. doi: 10.1107/S2052252519000277. - DOI - PMC - PubMed
    1. Callaway E. The Protein-Imaging Technique Taking over Structural Biology. Nature. 2020;578:201. doi: 10.1038/d41586-020-00341-9. - DOI - PubMed
    1. Danev R., Yanagisawa H., Kikkawa M. Cryo-Electron Microscopy Methodology: Current Aspects and Future Directions. Trends Biochem. Sci. 2019;44:837–848. doi: 10.1016/j.tibs.2019.04.008. - DOI - PubMed
    1. Xu Y., Dang S. Recent Technical Advances in Sample Preparation for Single-Particle Cryo-EM. Front. Mol. Biosci. 2022;9:892459. doi: 10.3389/fmolb.2022.892459. - DOI - PMC - PubMed

MeSH terms

LinkOut - more resources