Maternal Serum Metabolomics in Mid-Pregnancy Identifies Lipid Pathways as a Key Link to Offspring Obesity in Early Childhood
- PMID: 39062861
- PMCID: PMC11276882
- DOI: 10.3390/ijms25147620
Maternal Serum Metabolomics in Mid-Pregnancy Identifies Lipid Pathways as a Key Link to Offspring Obesity in Early Childhood
Abstract
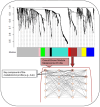
Maternal metabolism during pregnancy shapes offspring health via in utero programming. In the Healthy Start study, we identified five subgroups of pregnant women based on conventional metabolic biomarkers: Reference (n = 360); High HDL-C (n = 289); Dyslipidemic-High TG (n = 149); Dyslipidemic-High FFA (n = 180); Insulin Resistant (IR)-Hyperglycemic (n = 87). These subgroups not only captured metabolic heterogeneity among pregnant participants but were also associated with offspring obesity in early childhood, even among women without obesity or diabetes. Here, we utilize metabolomics data to enrich characterization of the metabolic subgroups and identify key compounds driving between-group differences. We analyzed fasting blood samples from 1065 pregnant women at 18 gestational weeks using untargeted metabolomics. We used weighted gene correlation network analysis (WGCNA) to derive a global network based on the Reference subgroup and characterized distinct metabolite modules representative of the different metabolomic profiles. We used the mummichog algorithm for pathway enrichment and identified key compounds that differed across the subgroups. Eight metabolite modules representing pathways such as the carnitine-acylcarnitine translocase system, fatty acid biosynthesis and activation, and glycerophospholipid metabolism were identified. A module that included 189 compounds related to DHA peroxidation, oxidative stress, and sex hormone biosynthesis was elevated in the Insulin Resistant-Hyperglycemic vs. the Reference subgroup. This module was positively correlated with total cholesterol (R:0.10; p-value < 0.0001) and free fatty acids (R:0.07; p-value < 0.05). Oxidative stress and inflammatory pathways may underlie insulin resistance during pregnancy, even below clinical diabetes thresholds. These findings highlight potential therapeutic targets and strategies for pregnancy risk stratification and reveal mechanisms underlying the developmental origins of metabolic disease risk.
Keywords: WGCNA; gestational diabetes mellitus; lipids; metabolomics; pregnancy.
Conflict of interest statement
The authors declare no conflicts of interest. The funders had no role in the design of the study; in the collection, analyses, or interpretation of data; in the writing of the manuscript; or in the decision to publish the results.
Figures


References
-
- Powe C.E., Allard C., Battista M.-C., Doyon M., Bouchard L., Ecker J.L., Perron P., Florez J.C., Thadhani R., Hivert M.-F. Heterogeneous Contribution of Insulin Sensitivity and Secretion Defects to Gestational Diabetes Mellitus. Diabetes Care. 2016;39:1052–1055. doi: 10.2337/dc15-2672. - DOI - PMC - PubMed
-
- White S.L., Begum S.I., Vieira M.C., Seed P., Lawlor D.L., Sattar N., Nelson S.M., Welsh P., Pasupathy D., Poston L., et al. Metabolic phenotyping by treatment modality in obese women with gestational diabetes suggests diverse pathophysiology: An exploratory study. PLoS ONE. 2020;15:e0230658. doi: 10.1371/journal.pone.0230658. - DOI - PMC - PubMed
MeSH terms
Substances
Grants and funding
LinkOut - more resources
Full Text Sources
Miscellaneous

