. 2024 Jul 11;25(14):7630.
doi: 10.3390/ijms25147630.

Adipokines-A Cohort Prospective Study in Children with Severe Burns

Affiliations

Adipokines-A Cohort Prospective Study in Children with Severe Burns

Silviu Constantin Badoiu et al. Int J Mol Sci. .

Abstract

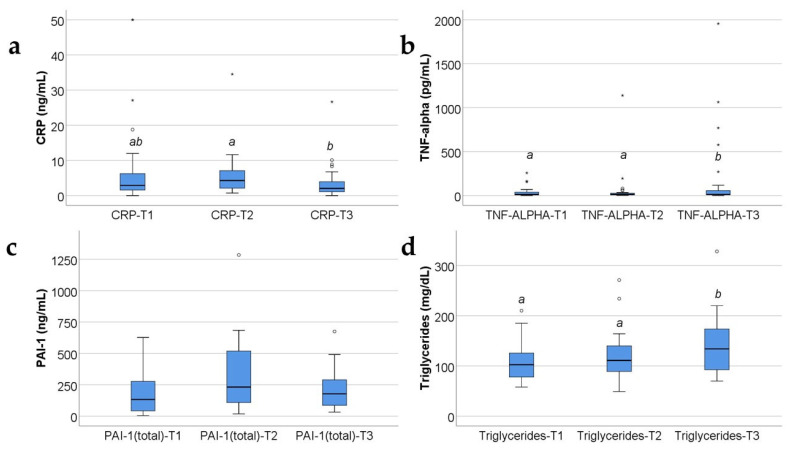
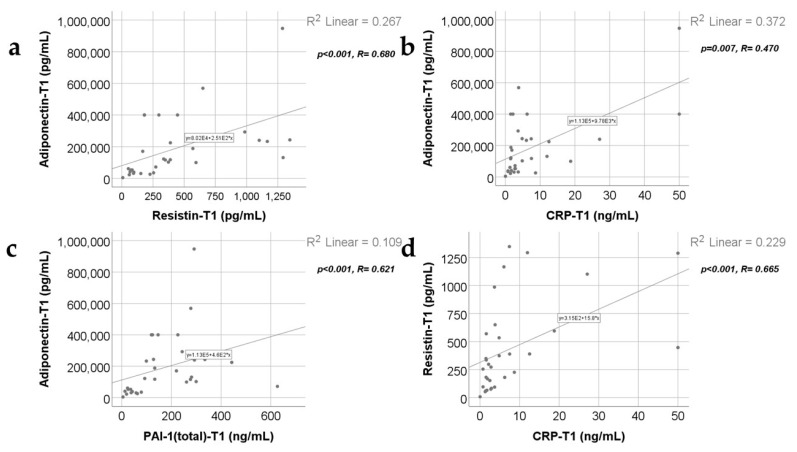
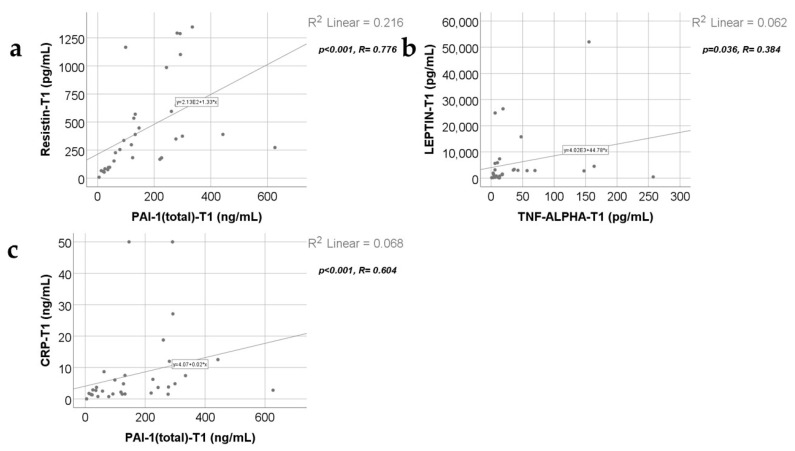
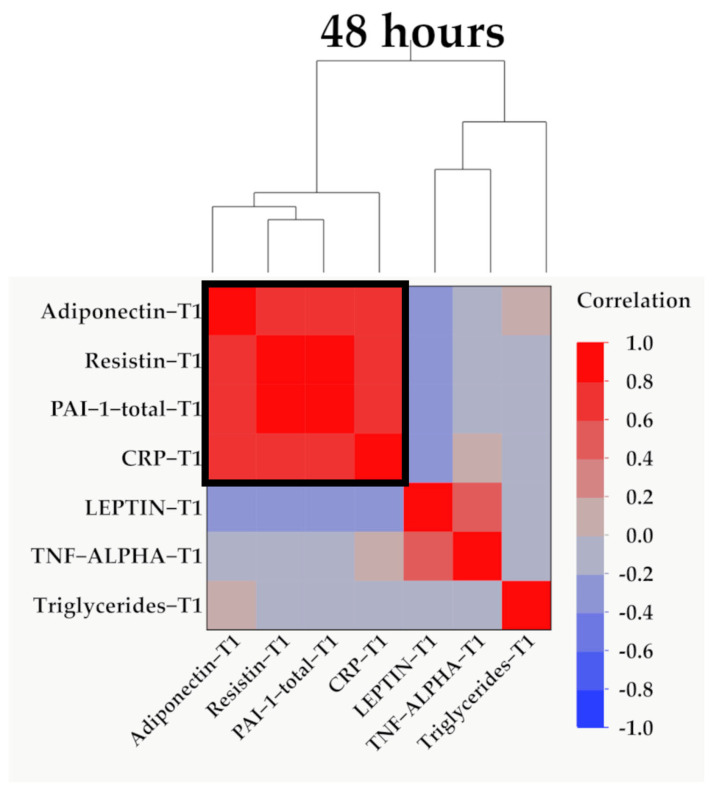
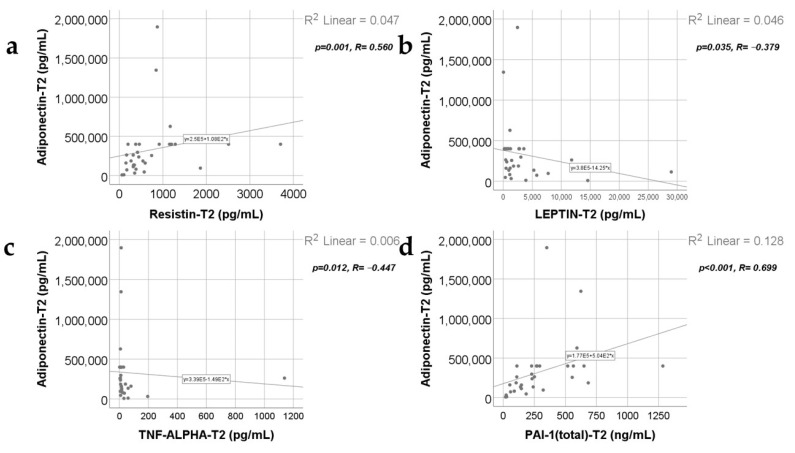
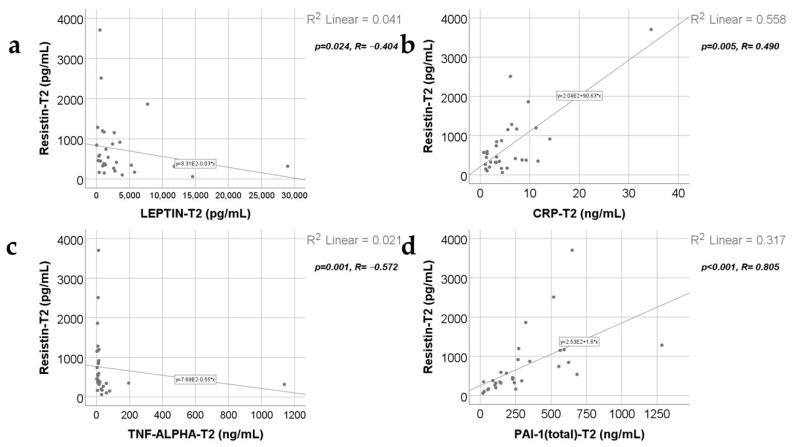
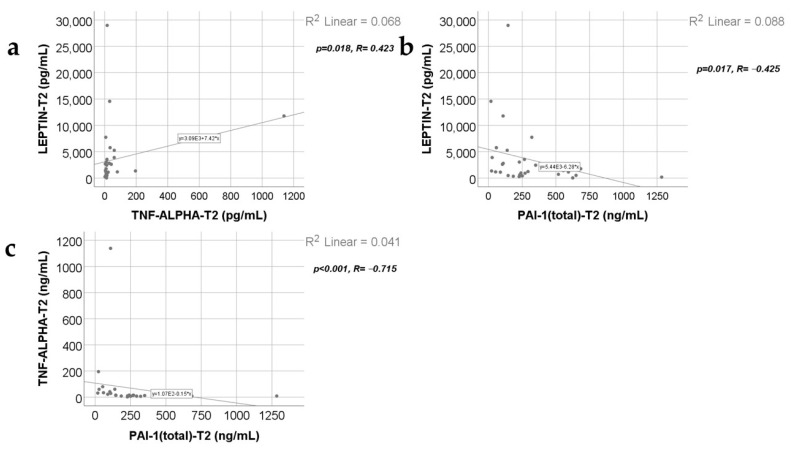
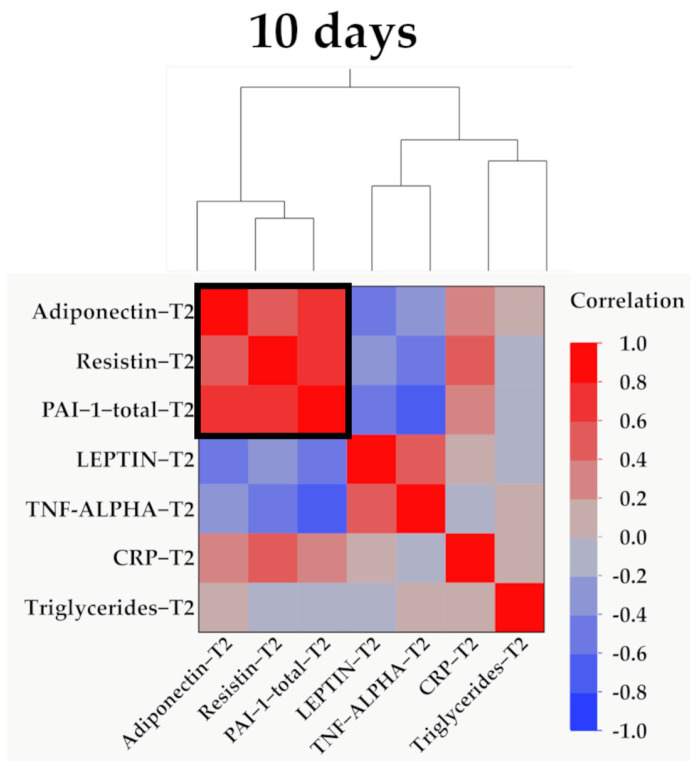
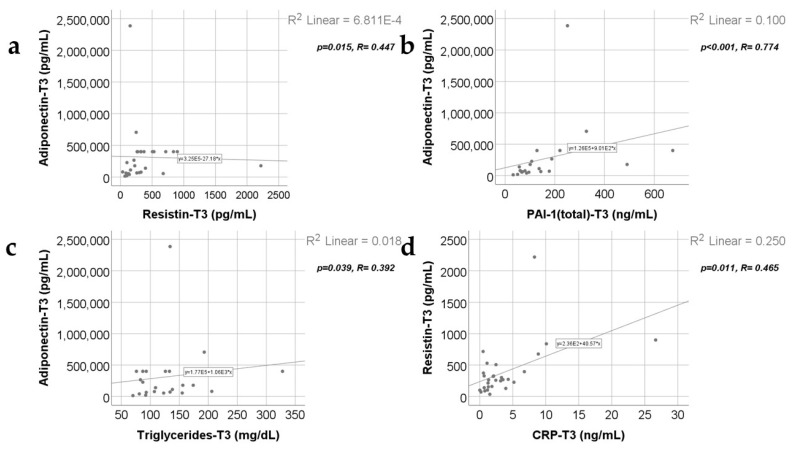
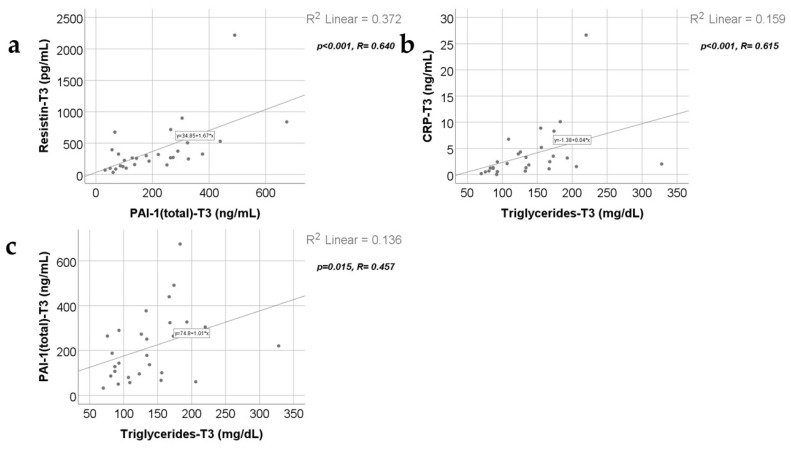
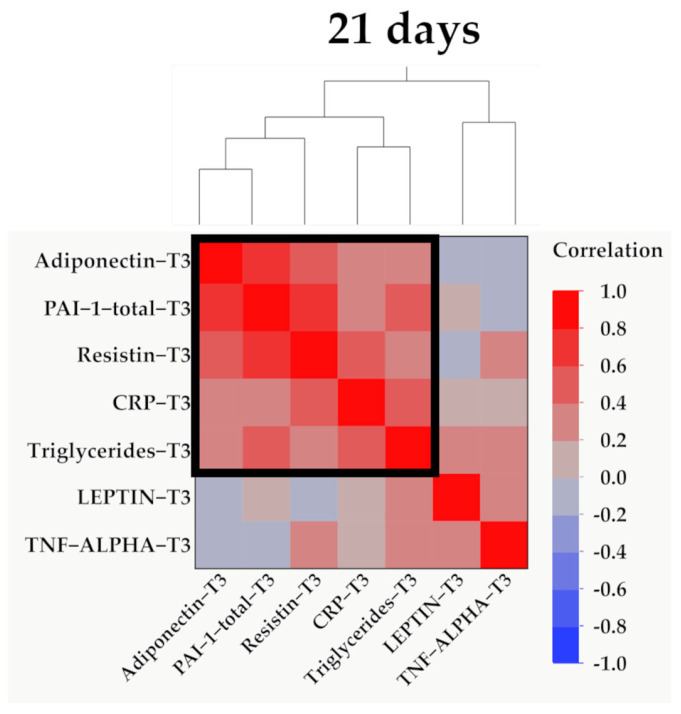
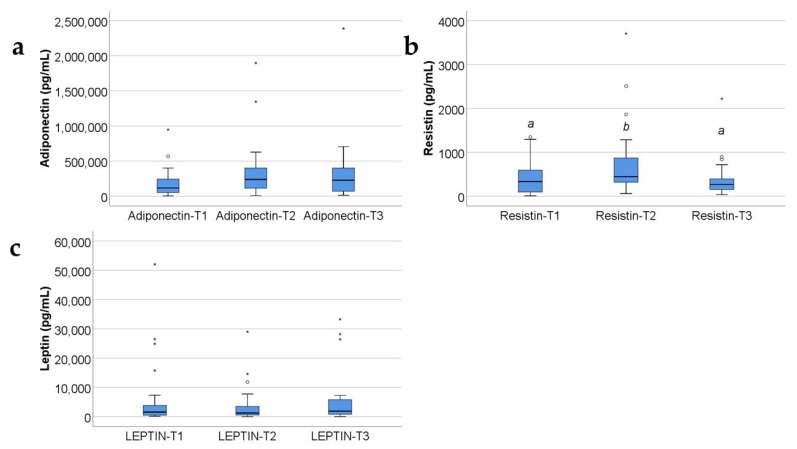
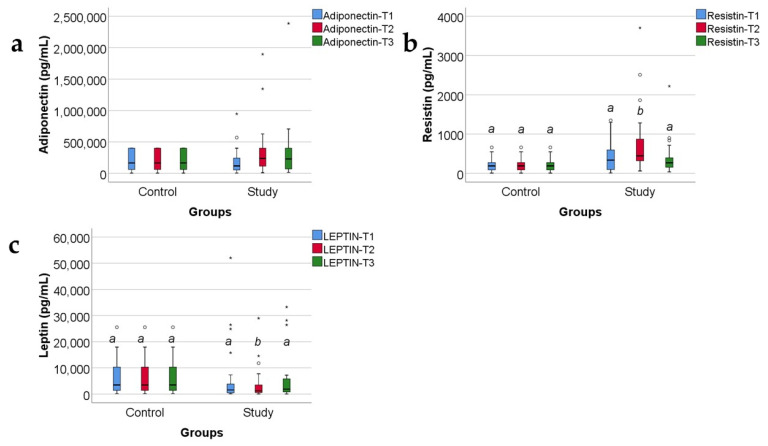
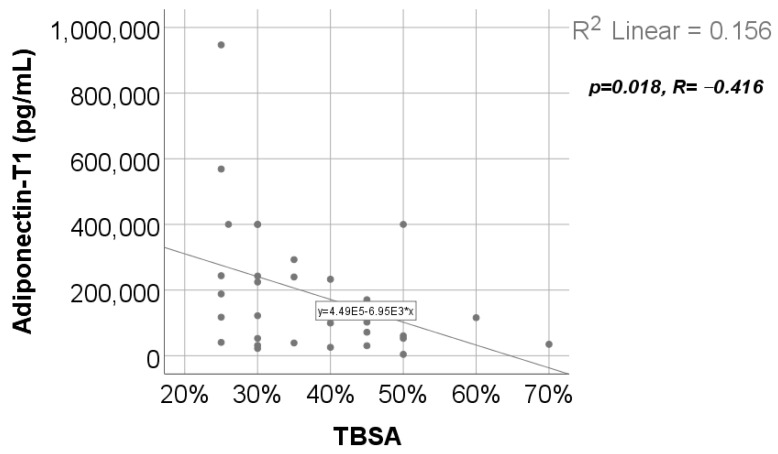
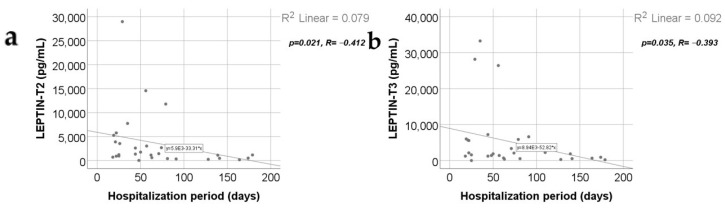
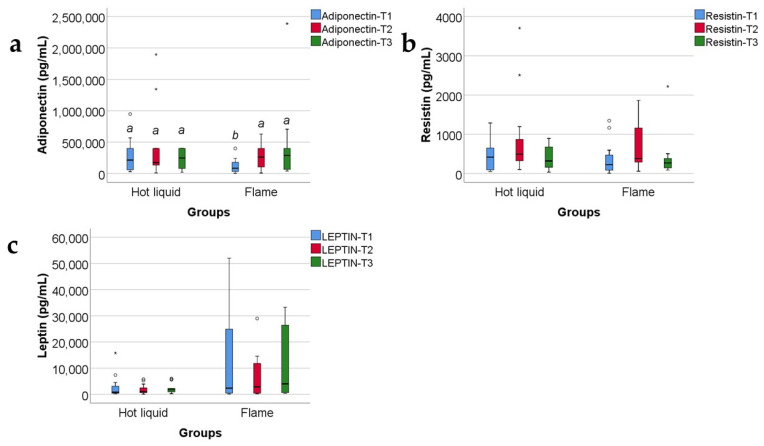
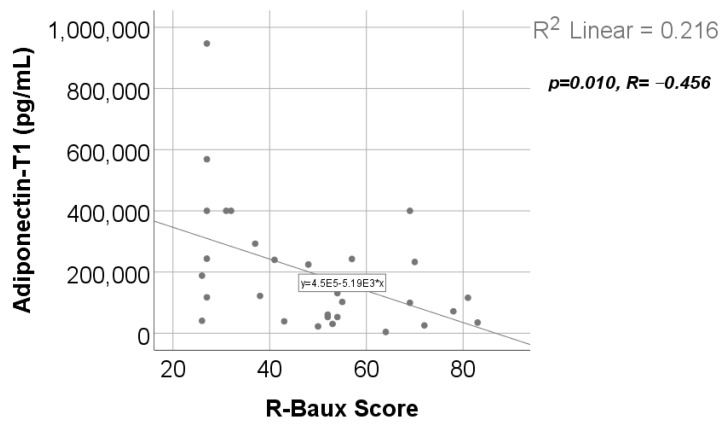
Burns generate every year an important burden of morbidity, being a major global public health problem through prolonged hospitalization, complications, and increased mortality. This study's purpose was to evaluate the serum levels of three adipokines and to establish significant correlations with other circulating molecules and with some clinical parameters. We evaluated 32 children with severe burns (over 25% total burned surface area-TBSA) at 48 h, day 10, and day 21 post burn, and 21 controls. The serum levels of adiponectin, resistin, leptin, tumor necrosis factor-α (TNF-α), plasminogen activator inhibitor-1 (PAI-1), and C-reactive protein (CRP) (among nine other biochemical parameters) were detected by Multiplex technique. Significant statistical differences were obtained for resistin and leptin compared to the control group, in different moments of measurements. Adiponectin serum levels presented statistically significant correlations with hot liquid mechanism of burn, the Revised Baux score, TBSA, resistin, PAI-1, CRP, TNF-α, and triglycerides (TGLs) serum levels. Resistin serum levels presented statistically significant correlations with adiponectin, CRP, PAI-1, leptin, and TNF-α. Additionally, we found statistically significant correlations between leptin serum levels and length of hospitalization, TNF-α, resistin, adiponectin, and PAI-1 serum levels. In severely burned children, adiponectin, resistin, and leptin specifically correlate with clinical parameters and with proteins involved in the systemic inflammatory response and the hypermetabolic response.

Keywords: adipokines; adiponectin; leptin; resistin; severe burns; tumor necrosis factor-α (TNF-α).


Conflict of interest statement

The authors declare no conflicts of interest.

Figures

Figure 3
Figure 3
The box-plot graphic illustration for acute-phase inflammation proteins (CRP (a), TNF-α (b), PAI-1 (c)) and for triacylglycerols (Triglycerides) (d) in the burned children group. The values of the studied molecules are medians with interquartile ranges. Concentrations measured in ng/mL for CRP and PAI-1, pg/mL for TNF-α and mg/dl for triglycerides. Friedman’s tests with Dunn–Bonferroni post hoc tests were applied for statistical analysis. For PAI-1, no statistically significant differences between measurements (p = 0.055) were identified. A significant difference between measurements is marked by unidentical lowercase letters. In the box-plot graphical representation, the ° symbol marks an outlier for a measurement < 1st quartile-1,5IQR or a measurement > 3rd quartile +1,5IQR. The * symbol marks an extreme outlier, for a measurement < 1st quartile-1,5IQR or a measurement > 3rd quartile +1,5IQR.
Figure 4
Figure 4
Correlations between adiponectin value at T1 and resistin value at T1 (a), CRP level at 48 h (b), and PAI-1 levels at T1 (48 h) (c), along with the correlation between resistin levels at T1 and CRP levels at T1 (d).
Figure 5
Figure 5
Correlations between resistin levels at T1 and PAI-1 levels at T1 (a), leptin value at T1 and TNF-α at T1 (b), and CRP value at T1 and PAI-1 value at T1 (c).
Figure 6
Figure 6
Hierarchical clustering of adipokines, inflammatory parameters, and triglyceride values at 48 h (T1). Variables were transformed to base10 logarithm values for data normalization. Data show the clustering of Pearson’s correlation coefficients, where a cluster between adiponectin, resistin, PAI-1, and CRP is indicated by the outlined box.
Figure 7
Figure 7
Correlations between adiponectin levels at T2 and resistin levels at T2 (a), leptin value at T2 (b), TNF-α value at T2 (c), and PAI-1 levels at T2 (d).
Figure 8
Figure 8
Correlations between resistin levels at T2 and leptin levels at T2 (a), CRP value at T2 (b), TNF-α value at T2 (c), and PAI-1 levels at T2 (d).
Figure 9
Figure 9
Correlations between leptin levels at T2 and TNF-α levels at T2 (a), PAI-1 value at T2 (b), and the correlation between TNF-α and PAI-1 values at T2 (c).
Figure 10
Figure 10
Hierarchical clustering of adipokines, inflammatory parameters, and triglyceride values at 10 days (T2). Variables were transformed to base10 logarithm values for data normalization. Data show the clustering of Pearson’s correlation coefficients, where a cluster between adiponectin, resistin, and PAI-1 is indicated by the outlined box.
Figure 11
Figure 11
Correlations between adiponectin values at T3 (21 days) and resistin levels at T3 (21 days) (a), PAI-1 levels at T3 (21 days) (b), triglycerides value at T3 (c), along with the correlation between resistin and CRP values at T3 (d).
Figure 12
Figure 12
Correlation between resistin levels at T3 (21 days) and PAI-1 levels at T3 (21 days) (a), along with the correlations between triglycerides value at T3 and CRP value at T3 (b) and PAI-1 values at T3 (c).
Figure 13
Figure 13
Hierarchical clustering of adipokines, inflammatory parameters, and triglyceride values at 21 days (T3). Variables were transformed to base10 logarithm values for data normalization. Data show the clustering of Pearson’s correlation coefficients, where a cluster between adiponectin, PAI-1, resistin, CRP, and triglycerides is indicated by the outlined box.
Figure 1
Figure 1
The box-plot representation for adiponectin (a), resistin (b), and leptin (c) variations in the target group (serum levels expressed in pg/mL). The values of the studied molecules are medians with interquartile ranges. Friedman’s tests with Dunn–Bonferroni post hoc tests were applied for statistical analysis. A significant difference between measurements is marked by unidentical lowercase letters. No statistically significant differences were observed for adiponectin (p = 0.104), nor for leptin (p = 0.097). In the box-plot graphical representation, the ° symbol marks an outlier for a measurement < 1st quartile-1,5IQR or a measurement > 3rd quartile +1,5IQR. The * symbol marks an extreme outlier, for a measurement < 1st quartile-1,5IQR or a measurement > 3rd quartile +1,5IQR.
Figure 2
Figure 2
Concentrations, in pg/mL, of the three adipokines (adiponectin (a), resistin (b), and leptin (c)) in the study group and the control group, expressed as medians with IQR. Mann–Whitney U tests for statistical analysis. A significant difference between measurements is marked by unidentical lowercase letters. No statistically significant differences were observed for adiponectin, nor for leptin (p > 0.05). In the box-plot graphical representation, the ° symbol marks an outlier for a measurement < 1st quartile-1,5IQR or a measurement > 3rd quartile +1,5IQR. The * symbol marks an extreme outlier, for a measurement < 1st quartile-1,5IQR or a measurement > 3rd quartile +1,5IQR.
Figure 14
Figure 14
Correlation between TBSA and adiponectin value at T1.
Figure 15
Figure 15
Correlations between hospitalization period and leptin value at T2 (a) and T3 (b).
Figure 16
Figure 16
The three adipokines variations in the target group, as related to the mechanism of burn: hot fluid versus flame (concentrations, in pg/mL). Medians with IQR are depicted. Mann–Whitney U tests—statistical analysis. A significant difference between measurements is marked by unidentical lowercase letters. No statistically significant differences were observed for resistin, nor for leptin (p > 0.05). In the box-plot graphical representation, the ° symbol marks an outlier for a measurement < 1st quartile-1,5IQR or a measurement > 3rd quartile +1,5IQR. The * symbol marks an extreme outlier, for a measurement < 1st quartile-1,5IQR or a measurement > 3rd quartile +1,5IQR.
Figure 17
Figure 17
Correlation between R-Baux Score and adiponectin value at T1.

References

    1. Porter C., Tompkins R.G., Finnerty C.C., Sidossis L.S., Suman O.E., Herndon D.N. The metabolic stress response to burn trauma: Current understanding and therapies. Lancet. 2016;388:1417–1426. doi: 10.1016/S0140-6736(16)31469-6. - DOI - PMC - PubMed
    1. Opriessnig E., Luze H., Smolle C., Draschl A., Zrim R., Giretzlehner M., Kamolz L.-P., Nischwitz S.P. Epidemiology of burn injury and the ideal dressing in global burn care–Regional differences explored. Burns. 2023;49:1–14. doi: 10.1016/j.burns.2022.06.018. - DOI - PubMed
    1. Huang Y.-Z., Lu G.-Z., Zhao H.-S., Liu L.-J., Jin J., Wu Y.-F., Wu J., Zhao F.-L., Liu N., Liu W.-M. Clinical features and mortality-related factors of extensive burns among young adults: The Kunshan disaster experience. Ann. Transl. Med. 2020;8:1053. doi: 10.21037/atm-20-288. - DOI - PMC - PubMed
    1. Kelter B., Holavanahalli R., Suman O., Ryan C., Schneider J. Recognizing the long-term sequelae of burns as a chronic medical condition. Burns. 2020;46:493–496. doi: 10.1016/j.burns.2019.10.017. - DOI - PMC - PubMed
    1. Ehlting C., Wolf S.D., Bode J.G. Acute-phase protein synthesis: A key feature of innate immune functions of the liver. Biol. Chem. 2021;402:1129–1145. doi: 10.1515/hsz-2021-0209. - DOI - PubMed