

Light Flux Density and Photoperiod Affect Growth and Secondary Metabolism in Fully Expanded Basil Plants
- PMID: 39063357
- PMCID: PMC11275332
- DOI: 10.3390/foods13142273
Light Flux Density and Photoperiod Affect Growth and Secondary Metabolism in Fully Expanded Basil Plants
Abstract
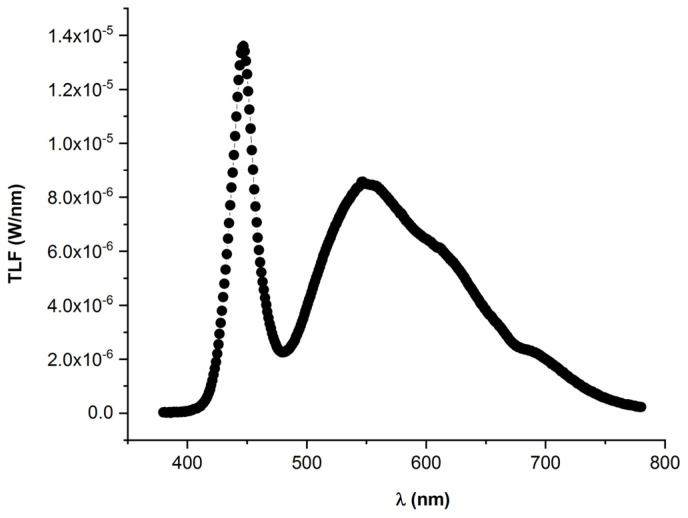
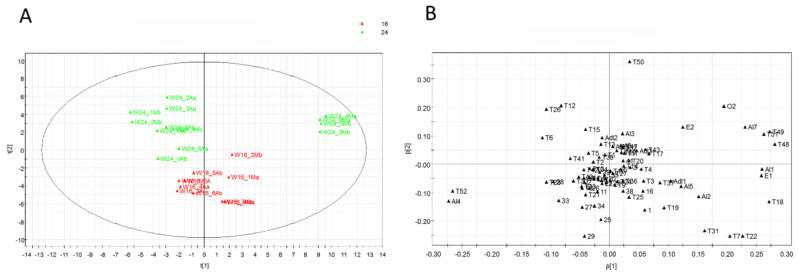
Indoor production of basil (Ocimum basilicum L.) is influenced by light spectrum, photosynthetic photon flux density (PPFD), and the photoperiod. To investigate the effects of different lighting on growth, chlorophyll content, and secondary metabolism, basil plants were grown from seedlings to fully expanded plants in microcosm devices under different light conditions: (a) white light at 250 and 380 μmol·m-2·s-1 under 16/8 h light/dark and (b) white light at 380 μmol·m-2·s-1 under 16/8 and 24/0 h light/dark. A higher yield was recorded under 380 μmol·m-2·s-1 compared to 250 μmol·m-2·s-1 (fresh and dry biomasses 260.6 ± 11.3 g vs. 144.9 ± 14.6 g and 34.1 ± 2.6 g vs. 13.2 ± 1.4 g, respectively), but not under longer photoperiods. No differences in plant height and chlorophyll content index were recorded, regardless of the PPFD level and photoperiod length. Almost the same volatile organic compounds (VOCs) were detected under the different lighting treatments, belonging to terpenes, aldehydes, alcohols, esters, and ketones. Linalool, eucalyptol, and eugenol were the main VOCs regardless of the lighting conditions. The multivariate data analysis showed a sharp separation of non-volatile metabolites in apical and middle leaves, but this was not related to different PPFD levels. Higher levels of sesquiterpenes and monoterpenes were detected in plants grown under 250 μmol·m-2·s-1 and 380 μmol·m-2·s-1, respectively. A low separation of non-volatile metabolites based on the photoperiod length and VOC overexpression under longer photoperiods were also highlighted.
Keywords: LED lighting; indoor farming; plant metabolomics; precision agriculture; volatile organic compounds.
Conflict of interest statement
Author Thierry Bodhuin was employed by the company FOS S.p.A., Via E. Melen 77, 16152 Genova, Italy. He participated in software and data curation in the study. The role of the company was as a co-owner of the Microcosm patent along with ENEA. The remaining authors declare that the research was conducted in the absence of any commercial or financial relationships that could be construed as a potential conflict of interest.
Figures


References
-
- Benke K., Tomkins B. Future food-production systems: Vertical farming and controlled-environment agriculture. Sustain. Sci. Pract. Policy. 2017;13:13–26. doi: 10.1080/15487733.2017.1394054. - DOI
-
- Skar S.L.G., Pineda-Martos R., Timpe A., Pölling B., Bohn K., Külvik M., Delgado C., Pedrash C.M.G., Paçoi T.A., Ćujić M., et al. Urban agriculture as a keystone contribution towards securing sustainable and healthy development for cities in the future. Blue-Green Syst. 2020;2:1–27. doi: 10.2166/bgs.2019.931. - DOI
-
- Viršilė A., Olle M., Duchovskis P. LED Lighting in Horticulture. In: Dutta Gupta S., editor. Light Emitting Diodes for Agriculture. Springer; Singapore: 2017. pp. 113–147. - DOI
-
- Gawande V., Raut D., Rai S., Beese S., Singh B.V., Agnihotri N. Artificial Light Spectra and Its Impact on Plant Physiological Processes and Secondary Metabolism. Int. J. Plant Soil Sci. 2023;35:2060–2070. doi: 10.9734/ijpss/2023/v35i183492. - DOI
Grants and funding
LinkOut - more resources
Full Text Sources
