. 2024 Jul 21;17(14):3596.
doi: 10.3390/ma17143596.

Thermo-Mechanical and Thermo-Electric Properties of a Carbon-Based Epoxy Resin: An Experimental, Statistical, and Numerical Investigation

Affiliations

Thermo-Mechanical and Thermo-Electric Properties of a Carbon-Based Epoxy Resin: An Experimental, Statistical, and Numerical Investigation

Giovanni Spinelli et al. Materials (Basel). .

Abstract

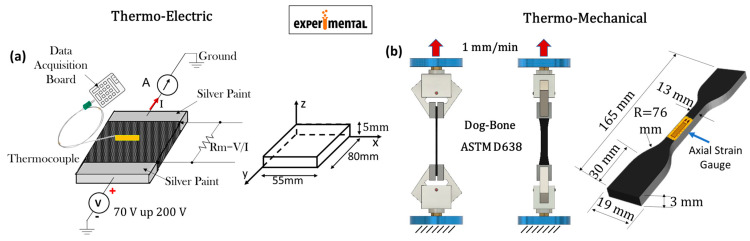
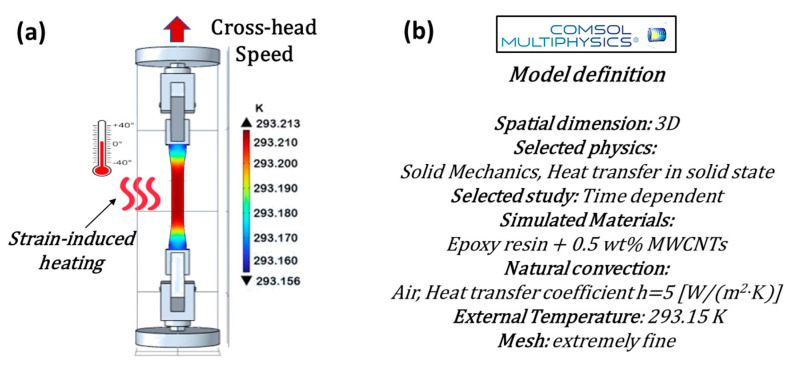
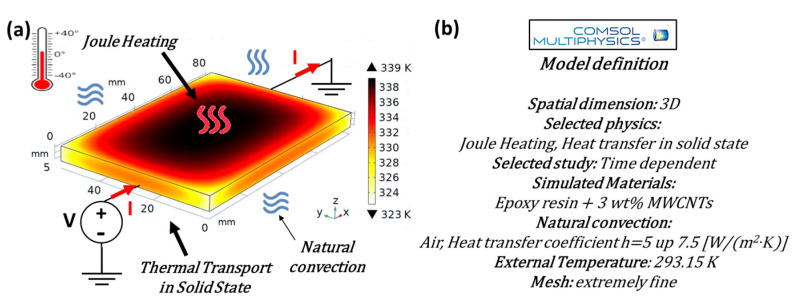
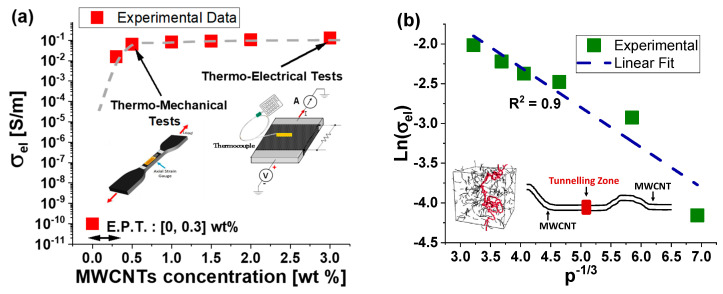
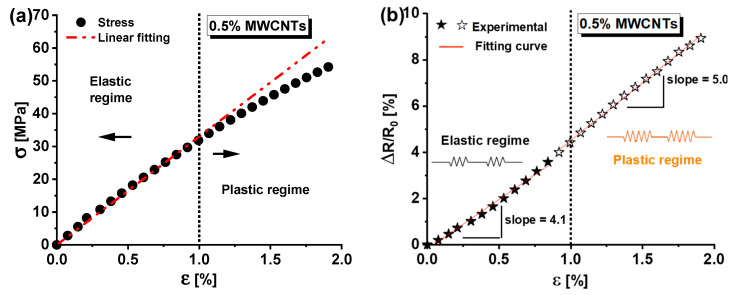
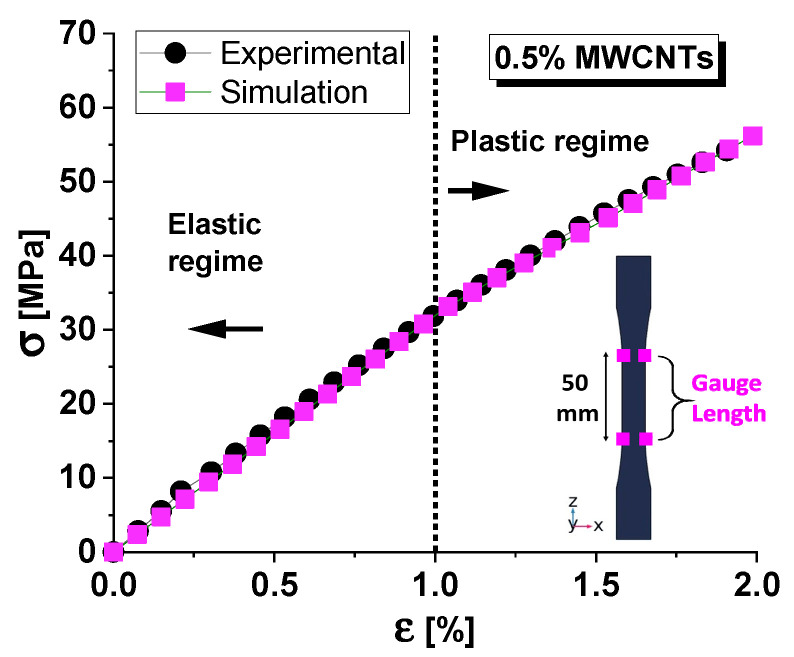
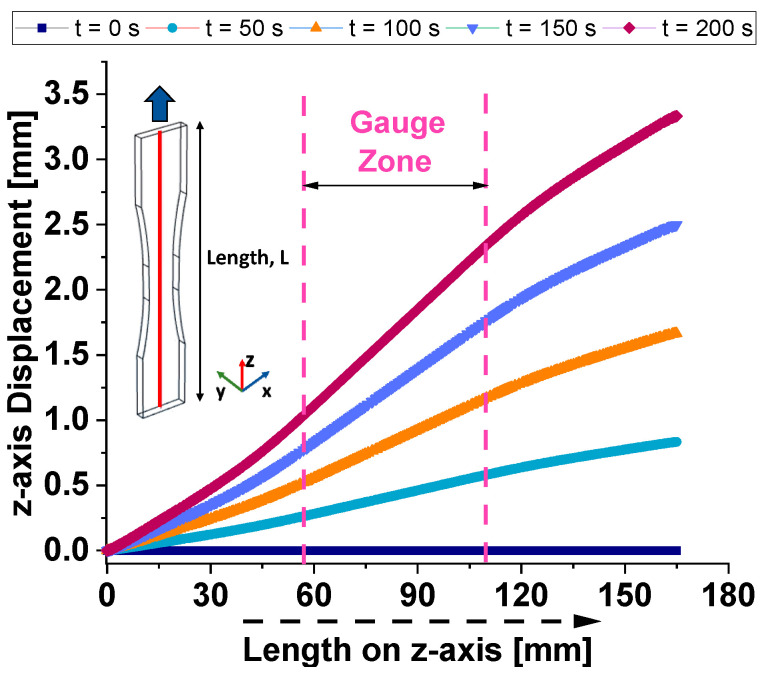
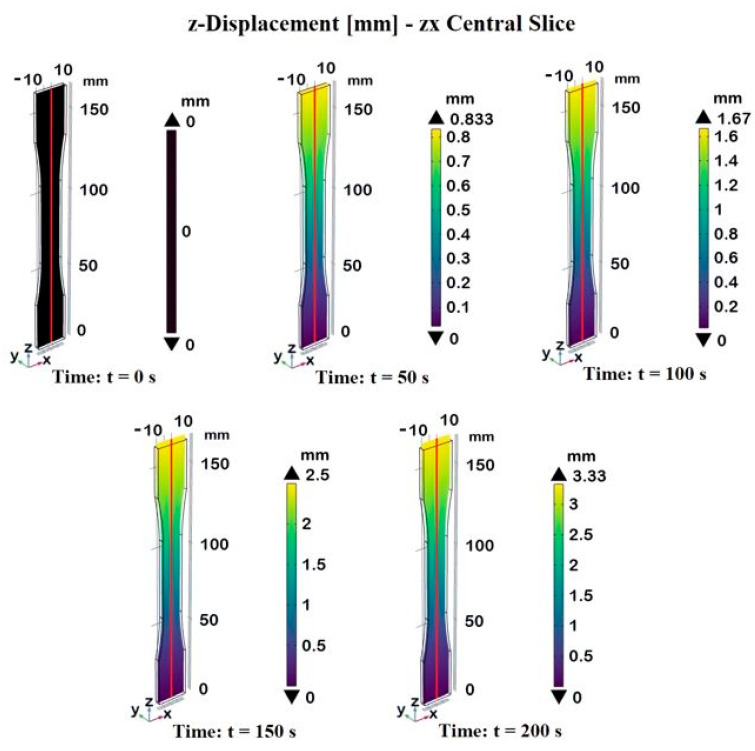
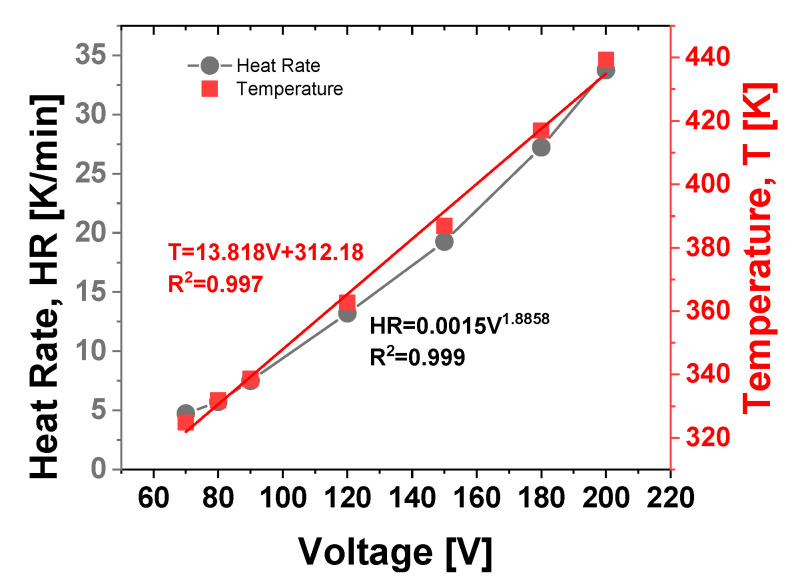
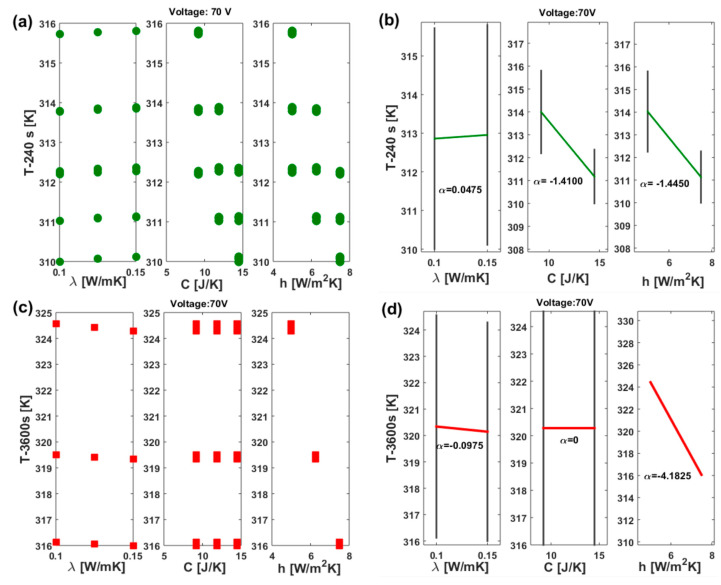
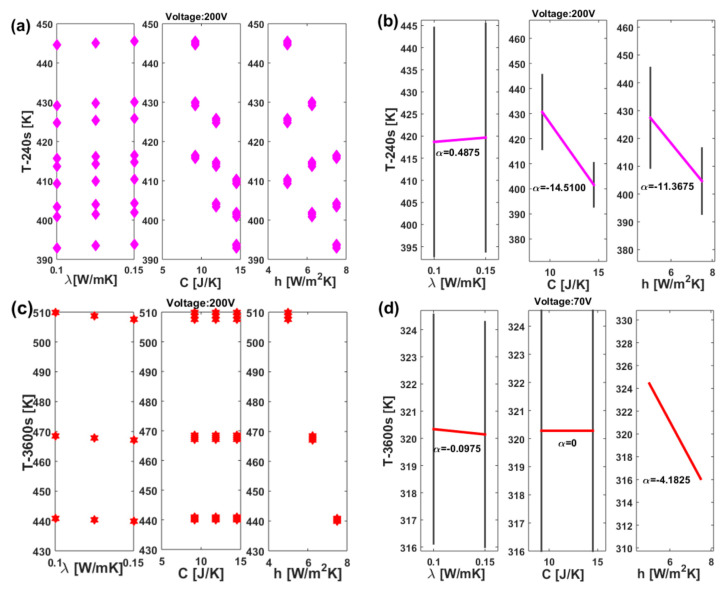
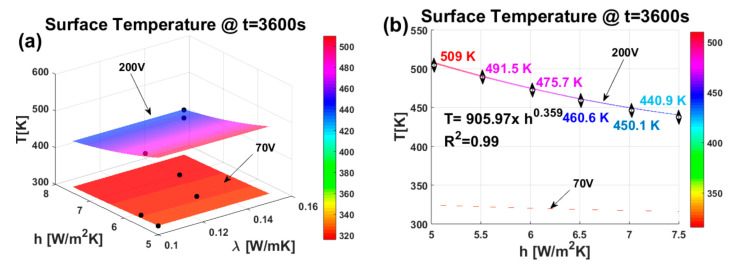
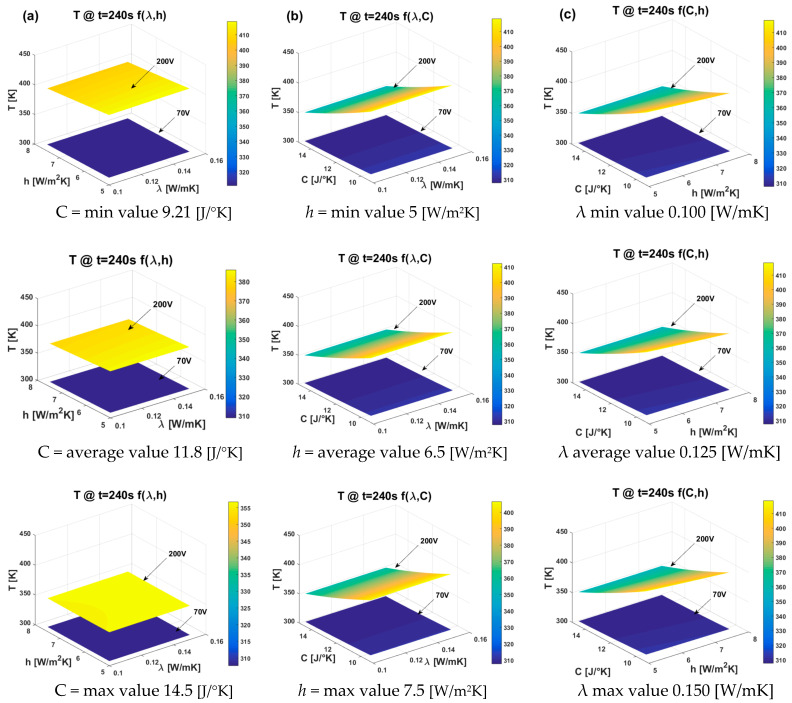
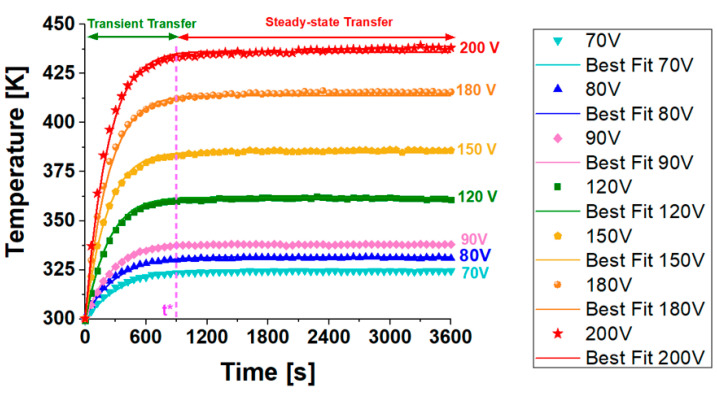
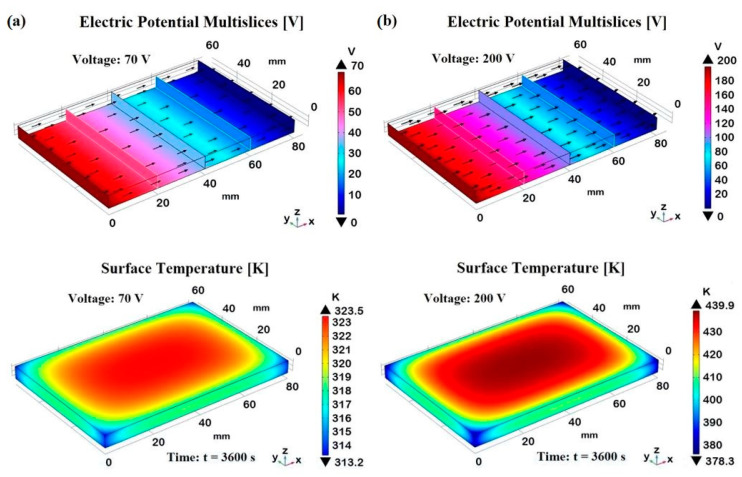
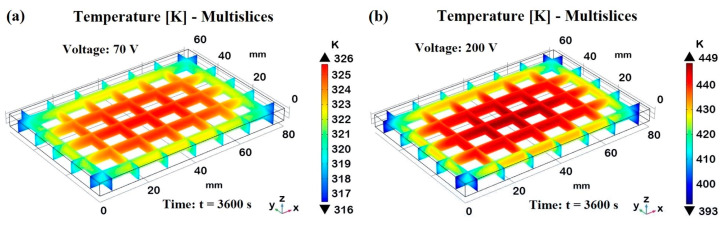
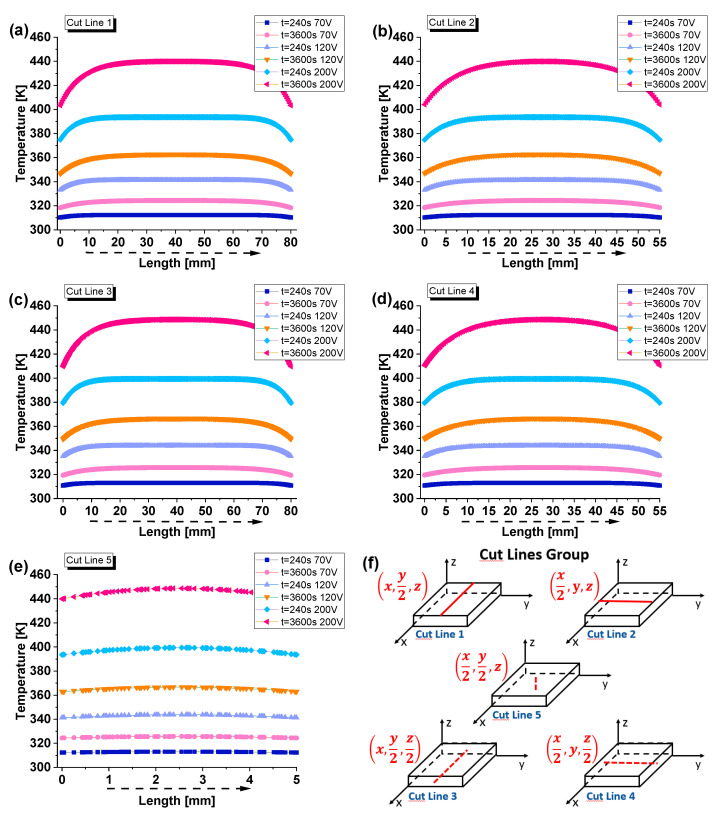
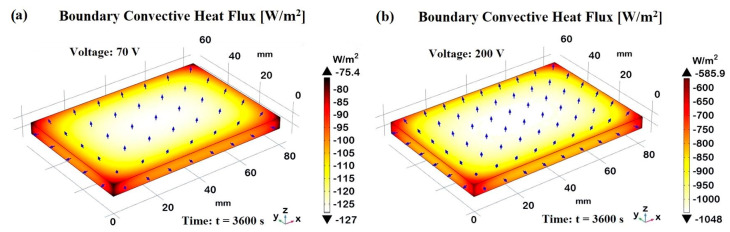
Due to their remarkable intrinsic physical properties, carbon nanotubes (CNTs) can enhance mechanical properties and confer electrical and thermal conductivity to polymers currently being investigated for use in advanced applications based on thermal management. An epoxy resin filled with varying concentrations of CNTs (up to 3 wt%) was produced and experimentally characterized. The electrical percolation curve identified the following two critical filler concentrations: 0.5 wt%, which is near the electrical percolation threshold (EPT) and suitable for exploring mechanical and piezoresistive properties, and 3 wt% for investigating thermo-electric properties due to the Joule effect with applied voltages ranging from 70 V to 200 V. Near the electrical percolation threshold (EPT), the CNT concentration in epoxy composites forms a sparse, sensitive network ideal for deformation sensing due to significant changes in electrical resistance under strain. Above the EPT, a denser CNT network enhances electrical and thermal conductivity, making it suitable for Joule heating applications. Numerical models were developed using multiphysics simulation software. Once the models have been validated with experimental data, as a perfect agreement is found between numerical and experimental results, a simulation study is performed to investigate additional physical properties of the composites. Furthermore, a statistical approach based on the design of experiments (DoE) was employed to examine the influence of certain thermal parameters on the final performance of the materials. The purpose of this research is to promote the use of contemporary statistical and computational techniques alongside experimental methods to enhance understanding of materials science. New materials can be identified through these integrated approaches, or existing ones can be more thoroughly examined.

Keywords: graphene nanoplatelets; multiphysics simulations; nanocomposites; structural epoxy resin; thermo-electric properties; thermo-mechanical properties.


Conflict of interest statement

The authors declare no conflicts of interest.

Figures

Figure 1
Figure 1
Setup adopted for the experimental thermo-electric and thermo-mechanical measurements, including the geometrical features of the test specimens in (a,b), respectively.
Figure 2
Figure 2
(a) Thermo-mechanical case study addressed in the present study; (b) main model definitions for the numerical investigation adopted in COMSOL Multiphysics®.
Figure 3
Figure 3
(a) Thermo-electric case study addressed in the present study; (b) main model definitions for the numerical investigation adopted in COMSOL Multiphysics®.
Figure 4
Figure 4
Electrical conductivity as a function of filler concentrations in (a); tunneling verification in nanocomposite systems in (b).
Figure 5
Figure 5
(a) Mechanical behavior and (b) resistance change ratio versus axial strain for samples reinforced with 0.5 wt% of MWCNTs.
Figure 6
Figure 6
Comparison between experimental and simulated data for model validation.
Figure 7
Figure 7
Z-axis displacement versus the dogbone length along the z-symmetry axis.
Figure 8
Figure 8
3D z-axis displacement versus the dogbone length on the central slice of the zx-plane passing through the axis of symmetry in the z-direction.
Figure 9
Figure 9
Von Mises stress profiles versus the dogbone length along the z-axis of symmetry.
Figure 10
Figure 10
Von Mises stress profiles (3D cross-sections) versus the dogbone’s length. The profile along the symmetry axis in the z-direction is clearly visible.
Figure 11
Figure 11
Temperature distribution in the dogbone sample at different time instants corresponding to different strain levels.
Figure 12
Figure 12
Thermal expansion in the dogbone sample for different cross-head speeds.
Figure 13
Figure 13
Temperature as a function of the cross-head speed.
Figure 14
Figure 14
Plastic energy dissipation density (average value) over time.
Figure 15
Figure 15
3D views of plastic energy dissipation density at different time instants/strain levels.
Figure 16
Figure 16
(a) Temperature patterns resulting from Joule heating at various applied voltage levels (from 70 V up to 90 V); (b) timeframe zoom of transient heat transfer for determining the heat rates for each voltage value.
Figure 17
Figure 17
Experimental data and corresponding curve fitting of the temperature values recorded at t = 3600 s and heat rate as a function of the voltage levels in the right and left axes, respectively.
Figure 18
Figure 18
DSP and MfP for the upper surface temperature of the sample powered with 70 V. More specifically, (a) DSP at 240 s; (b) MfP at t = 240 s; (c) DSP at 3600 s; and (d) MfP at t = 3600 s.
Figure 19
Figure 19
DSP and MfP for the upper surface temperature of the sample powered with 200 V. More specifically, (a) DSP at 240 s; (b) MfP at t = 240 s; (c) DSP at 3600 s; and (d) MfP at t = 3600 s.
Figure 20
Figure 20
(a) 3D response surface graphics (full quadratic model) for the temperature, depending on thermal conductivity and heat exchange coefficient. The black markers represent the experimental thermal data; (b) 2D view of the interpolating surfaces as a function of the exclusive heat exchange coefficient.
Figure 21
Figure 21
Response surface graphics presenting the effect of the three thermal factors on the surface temperature value recorded at the time instance of 240 s, as follows: (a) effect of thermal conductivity and heat transfer coefficient, (b) effect of thermal conductivity and thermal capacity, and (c) effect of heat transfer coefficient and thermal capacity. In each plot, the unconsidered factor was held constant at its minimum, average, and maximum values (first, second, and third row, respectively).
Figure 22
Figure 22
Simulation fitting for the temperature patterns for each applied voltage value.
Figure 23
Figure 23
Electric potential distributions (first row) along the x-axis direction to which the two voltages (70 V and 200 V) in (a,b), respectively, are applied. The second row reports the 3D views of the corresponding surface temperature (evaluated at steady-state condition, t = 3600 s) due to the Joule effect.
Figure 24
Figure 24
Multislice temperature distribution (evaluated at steady-state condition, t = 3600 s) due to the Joule effect for sample powered with 70 V in (a) and 200 V in (b).
Figure 25
Figure 25
Temperature distribution along different spatial profiles, as follows: (a) cut line 1; (b) cut line 2; (c) cut line 3; (d) cut line 4; and (e) cut line 5. The cut line collection is schematized in (f).
Figure 26
Figure 26
Comparison of the convective flux at t = 3600 s in case of applied voltage of 70 and 200 V in (a,b), respectively.

References

    1. Bryan H. Engineering Composite Materials. 2nd ed. CRC Press; London, UK: 1999.
    1. Jeff K. Replacing metal with plastic. Mach. Des. 2016;88:34–42.
    1. Nicolais L., Meo M., Milella E. Composite Materials: A Vision for the Future. Springer Science & Business Media; London, UK: 2011.
    1. Mark J., Ngai K., Graessley W., Mandelkern L., Samulski E., Wignall G., Koenig J. Physical Properties of Polymers. Cambridge University Press; Cambridge, UK: 2004.
    1. Allaouia A., Baia S., Cheng H., Bai J. Mechanical and Electrical Properties of MWNT/Epoxy Composite. Compos. Sci. Technol. 2002;62:1993–1998. doi: 10.1016/S0266-3538(02)00129-X. - DOI

LinkOut - more resources