. 2024 Jul 10;16(14):2209.
doi: 10.3390/nu16142209.

Immunoneuroendocrine, Stress, Metabolic, and Behavioural Responses in High-Fat Diet-Induced Obesity

Affiliations

Immunoneuroendocrine, Stress, Metabolic, and Behavioural Responses in High-Fat Diet-Induced Obesity

María Del Carmen Navarro et al. Nutrients. .

Abstract

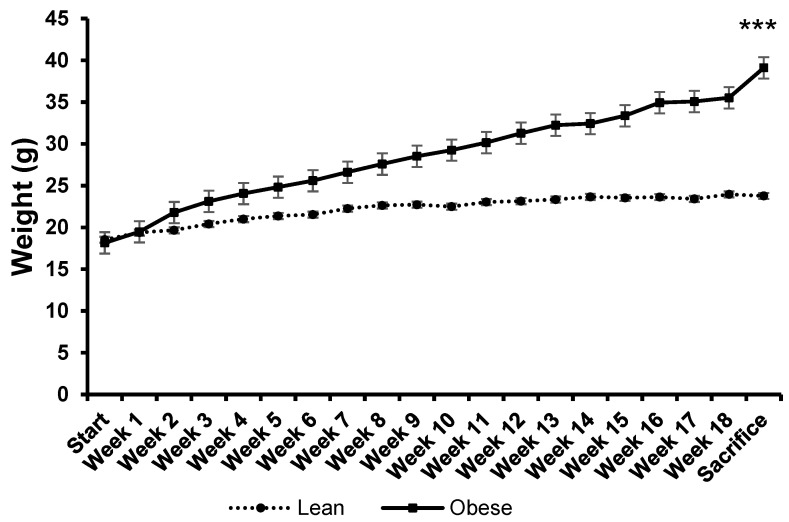
Obesity has reached global epidemic proportions, and even though its effects are well-documented, studying the interactions among all influencing factors is crucial for a better understanding of its physiopathology. In a high-fat-diet-induced obesity animal model using C57BL/6J mice, behavioural responses were assessed through a battery of tests, while stress biomarkers and systemic inflammatory cytokines were measured using an Enzyme-Linked ImmunoSorbent Assay and a Bio-Plex Multiplex System. The peritoneal macrophage microbicide capacity was analysed via flow cytometry, and crown-like structures (CLSs) in white adipose tissue (WAT) were evaluated through staining techniques. Results indicated that obese mice exhibited increased body weight, hyperglycaemia, and hyperlipidaemia after 18 weeks on a high-fat diet, as well as worse physical conditions, poorer coordination and balance, and anxiety-like behaviour. Differences in corticosterone and noradrenaline concentrations were also found in obese animals, revealing a stress response and noradrenergic dysregulation, along with a weakened innate immune response characterized by a lower microbicide capacity, and the presence of an underlying inflammation evidenced by more CLSs in WAT. Altogether, these findings indicate that obesity deteriorates the entire stress, inflammatory, metabolic, sensorimotor and anxiety-like behavioural axis. This demonstrates that jointly evaluating all these aspects allows for a deeper and better exploration of this disease and its associated comorbidities, emphasizing the need for individualized and context-specific strategies for its management.

Keywords: anxiety; inflammation; macrophages; management; obesity; prevention; stress.


Conflict of interest statement

The authors declare no conflicts of interest. The funders had no role in the design of the study; in the collection, analyses, or interpretation of data; in the writing of the manuscript; or in the decision to publish the results.

Figures

Figure 1
Figure 1
Weight progression during the standard or high-fat diet protocols. Each value represents the mean ± SEM of weights recorded weekly in 8 animals from each group during the 18 weeks of the diet protocols. Starting weight (6–8 weeks of age) and sacrifice weight (22–24 weeks of age) are indicated. Values are expressed in grams. *** p < 0.001 compared to the lean group on sacrifice day. ES = 1.5 (95% CI for lean: (21.4, 23), 95% CI for obese: (26, 31.2)).
Figure 2
Figure 2
Weight increase of lean and obese mice upon the completion of the diet protocol. Values represent the mean ± SEM of the weight increases of 8 animals in each group, calculated by subtracting the initial weight of each animal from the weight on the day of sacrifice (last recorded weight). Values are expressed in grams. *** p < 0.001 compared to the lean group. ES = 2 (95% CI for lean: (3, 5.3), 95% CI for obese: (9.5, 22.2)).
Figure 3
Figure 3
Strength and muscle vigour in lean and obese mice. Grip strength test (A). Tight-rope test (B). Each column represents the mean ± SEM of the values determined in 16 animals in each group. The strength value is calculated by dividing the average of 3 grips by the weight of each animal. *** p < 0.001, compared to the lean group. ES for grip strength test = 2 (95% CI for lean: (0.04, 0.05), 95% CI for obese: (0.02, 0.03)); ES for tight-rope test = 1.6 (95% CI for lean: (−7.1, 19.6), 95% CI for obese: (43.2, 94.3)).
Figure 4
Figure 4
Balance in lean and obese mice. Wood rod test (A). Wire rod test (B). The percentage of animals reaching the end of the wood rod or the wire rod test within the duration of the test (20 s) is measured. Each column represents the mean ± SEM of the values obtained in 16 animals in each group. Results are expressed in percentages. * p < 0.05, *** p < 0.001, compared to the lean group. ES for wood rod test = 0.77 (95% CI for lean: (55.5, 94.5), 95% CI for obese: (20.2, 67.3)); ES for wire rod test = 1.5 (95% CI for lean: (39.4, 79.4), 95% CI for obese: (−5.5, 25.5)).
Figure 5
Figure 5
Motor coordination in lean and obese mice. Wood rod test (A). Wire rod test (B). Tightrope test (C). The percentage of animals performing at least one segment in the wood rod test, the number of segments traversed by the animal in the wire rod test, and the percentage of animals completing the tightrope test within the duration of each test (20 s) are measured. Each column represents the mean ± SEM of the values determined in 16 animals of each group. Results are represented in percentage, number, and percentage, respectively. * p < 0.05, ** p < 0.01, *** p < 0.001, compared to the lean group. ES for wood rod test = 1.2 (95% CI for lean: (84.6, 102.9), 95% CI for obese: (44.3, 80.7)); ES for wire rod test = 1.3 (95% CI for lean: (2.2, 3.7), 95% CI for obese: (0.3, 1.9)); ES tight-rope test = 0.86 (95% CI for lean: (22.5, 77.5), 95% CI for obese: (−5.7, 30.7)).
Figure 6
Figure 6
Anxiety-like behaviour in lean and obese mice. Elevated plus maze test. The figure shows the results regarding the open arms of the elevated plus maze test. Percentage of time is represented in relation to the total time (5 min) spent in these arms. Each column represents the mean ± SEM of the values obtained from 16 animals from each group. * p < 0.05, compared to the lean group. ES = 0.59 (95% CI for lean: (4.5, 12.9), 95% CI for obese: (0.1, 8.5)).
Figure 7
Figure 7
Anxiety-like behaviour in lean and obese mice. Hole-board test. Total locomotion (A). Total number of squares crossed during the test duration (5 min) is represented. Mean total locomotion (B). The average number of total squares crossed, calculated as the total number of squares crossed divided by the total number of squares (36), is represented. Each column represents the mean ± SEM of the squares crossed by 16 animals of each group. ** p < 0.01, compared to the lean group. ES for total locomotion = 1.1 (95% CI for lean: (251.2, 294.8), 95% CI for obese: (205.9, 251.9)); ES for mean total locomotion = 1.1 (95% CI for lean: (7, 8.2), 95% CI for obese: (5.7, 7)).
Figure 8
Figure 8
Anxiety-like behaviour in lean and obese mice. Hole-board test. Number of head-dippings (A). The number of head-dippings or hole explorations performed during the test duration (5 min) is represented. Time of head-dippings (B). The time spent on head-dippings during the test duration (5 min) is represented. Each column represents the mean ± SEM of the values obtained from 16 animals of each group. ** p < 0.01, compared to the lean group. ES for number of head-dippings = 0.95 (95% CI for lean: (7.8, 13.4), 95% CI for obese: (2.9, 8.4)); ES for time of head-dippings = 0.98 (95% CI for lean: (16.5, 33.1), 95% CI for obese: (7.1, 17.6)).
Figure 9
Figure 9
Anxiety-like behaviour in lean and obese mice. Open field test. Peripheral locomotion (A). The number of squares crossed in the peripheral zone of the open field during the test duration (5 min) is represented. Central locomotion (B). The number of squares crossed in the central zone of the open field during the test duration (5 min) is represented. Total locomotion (C). The total number of squares crossed during the test duration (5 min) is represented. Each column represents the mean ± SEM of the number of squares crossed in each zone by 16 animals of each group. * p < 0.05, compared to the lean group. ES for peripheral locomotion = 0.5 (95% CI for lean: (152.8, 217.3), 95% CI for obese: (109.7, 191.8)); ES for central locomotion = 0.82 (95% CI for lean: (14.9, 26.4), 95% CI for obese: (5, 17.7)); ES for total locomotion = 0.57 (95% CI for lean: (170.3, 241.1), 95% CI for obese: (116.2, 208)).
Figure 10
Figure 10
Microbicide percentages of peritoneal macrophages from lean and obese mice. Each column represents the mean ± SEM of the values obtained from 8 animals in each group. Results are expressed in percentages. * p < 0.05, compared to the lean group. ES = 0.52 (95% CI for lean: (20.1, 43.4), 95% CI for obese: (15.9, 35)).
Figure 11
Figure 11
Adipose tissue of lean and obese mice using an immunostaining technique. Lean mouse (A). “Crown-like structure” in the adipose tissue of an obese mouse (D). Photos were taken under fluorescence microscopy at 40× magnification. Sections were treated with the nuclear stain DAPI (blue) (B,E) and F4/80 antibody (green) (macrophage marker) (C,F). Scale bar: 50 μm.

Similar articles

References

    1. Speakman J.R. Use of high-fat diets to study rodent obesity as a model of human obesity. Int. J. Obes. 2019;43:1491–1492. doi: 10.1038/s41366-019-0363-7. - DOI - PubMed
    1. Amiri S., Behnezhad S. Obesity and anxiety symptoms: A systematic review and meta-analysis. Neuropsychiatrie. 2019;33:72–89. doi: 10.1007/s40211-019-0302-9. - DOI - PubMed
    1. Coccaro E.F., Lee R., Coussons-Read M. Elevated plasma inflammatory markers in individuals with intermittent explosive disorder and correlation with aggression in humans. JAMA Psychiatry. 2014;71:158–165. doi: 10.1001/jamapsychiatry.2013.3297. - DOI - PubMed
    1. Hilakivi-Clarke L., Cho E., Onojafe I. High-fat diet induces aggressive behavior in male mice and rats. Life Sci. 1996;58:1653–1660. doi: 10.1016/0024-3205(96)00140-3. - DOI - PubMed
    1. Veniaminova E., Cespuglio R., Markova N., Mortimer N., Cheung C.W., Steinbusch H.W., Lesch K.-P., Strekalova T. Behavioral Features of Mice Fed with a Cholesterol-Enriched Diet: Deficient Novelty Exploration and Unaltered Aggressive Behavior. Transl. Neurosci. Clin. 2016;2:87–95. doi: 10.18679/CN11-6030_R.2016.014. - DOI

MeSH terms

LinkOut - more resources