

Transcriptomic Signatures of Zika Virus Infection in Patients and a Cell Culture Model
- PMID: 39065267
- PMCID: PMC11278784
- DOI: 10.3390/microorganisms12071499
Transcriptomic Signatures of Zika Virus Infection in Patients and a Cell Culture Model
Abstract
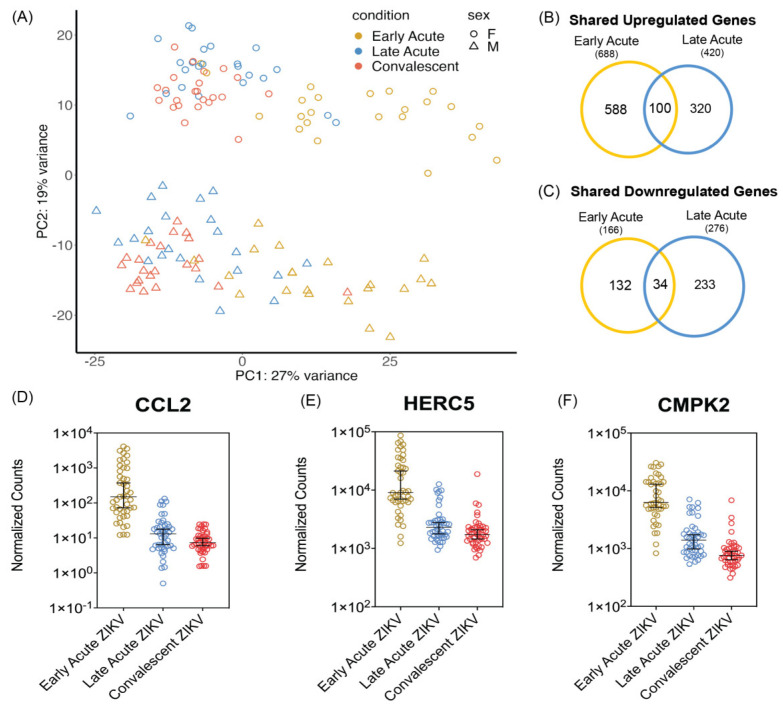
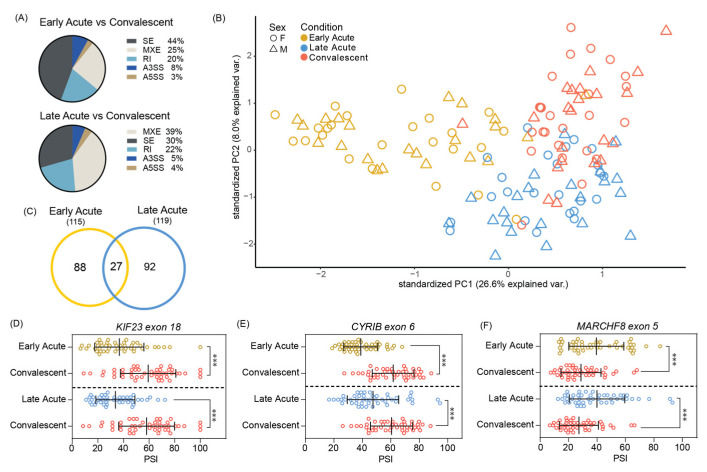
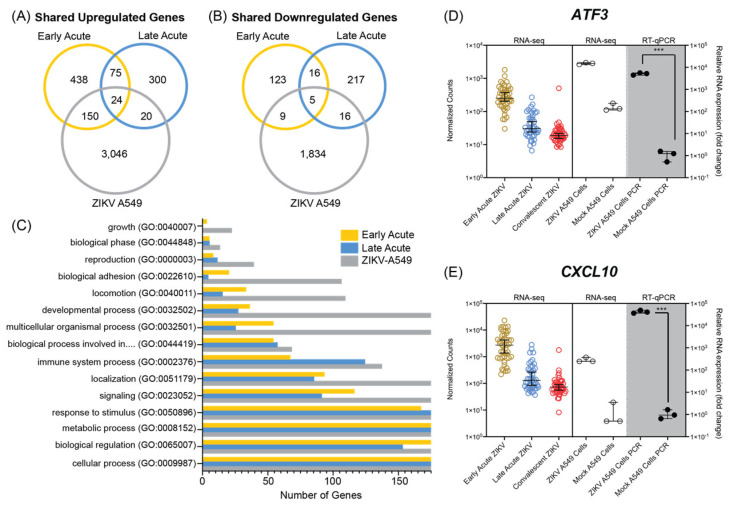
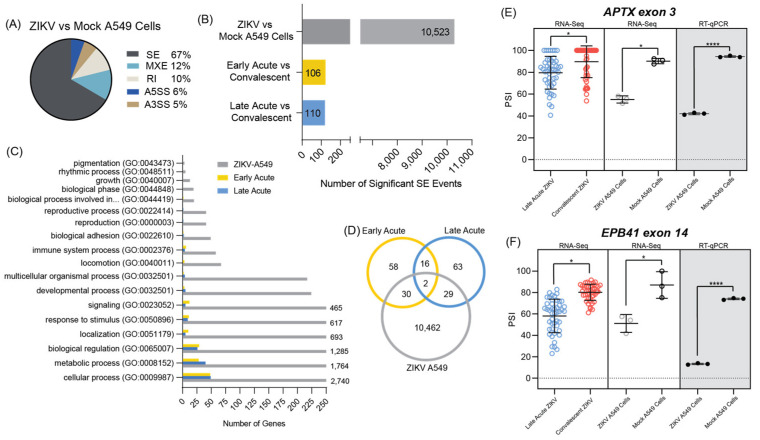
Zika virus (ZIKV), a re-emerging flavivirus, is associated with devasting developmental and neurological disease outcomes particularly in infants infected in utero. Towards understanding the molecular underpinnings of the unique ZIKV disease pathologies, numerous transcriptome-wide studies have been undertaken. Notably, these studies have overlooked the assimilation of RNA-seq analysis from ZIKV-infected patients with cell culture model systems. In this study we find that ZIKV-infection of human lung adenocarcinoma A549 cells, mirrored both the transcriptional and alternative splicing profiles from previously published RNA-seq data of peripheral blood mononuclear cells collected from pediatric patients during early acute, late acute, and convalescent phases of ZIKV infection. Our analyses show that ZIKV infection in cultured cells correlates with transcriptional changes in patients, while the overlap in alternative splicing profiles was not as extensive. Overall, our data indicate that cell culture model systems support dissection of select molecular changes detected in patients and establishes the groundwork for future studies elucidating the biological implications of alternative splicing during ZIKV infection.
Keywords: Zika virus; alternative splicing; cell culture; patients; transcriptome.
Conflict of interest statement
The authors declare no conflicts of interest.
Figures
Update of
-
Zika virus infection in a cell culture model reflects the transcriptomic signatures in patients.bioRxiv [Preprint]. 2024 May 25:2024.05.25.595842. doi: 10.1101/2024.05.25.595842. bioRxiv. 2024. Update in: Microorganisms. 2024 Jul 22;12(7):1499. doi: 10.3390/microorganisms12071499. PMID: 38826459 Free PMC article. Updated. Preprint.
Similar articles
-
Activation of ATF3 via the integrated stress response pathway regulates innate immune response to restrict Zika virus.J Virol. 2024 Oct 22;98(10):e0105524. doi: 10.1128/jvi.01055-24. Epub 2024 Aug 30. J Virol. 2024. PMID: 39212382 Free PMC article.
-
Zika virus infection in a cell culture model reflects the transcriptomic signatures in patients.bioRxiv [Preprint]. 2024 May 25:2024.05.25.595842. doi: 10.1101/2024.05.25.595842. bioRxiv. 2024. Update in: Microorganisms. 2024 Jul 22;12(7):1499. doi: 10.3390/microorganisms12071499. PMID: 38826459 Free PMC article. Updated. Preprint.
-
Asian Zika Virus Isolate Significantly Changes the Transcriptional Profile and Alternative RNA Splicing Events in a Neuroblastoma Cell Line.Viruses. 2020 May 5;12(5):510. doi: 10.3390/v12050510. Viruses. 2020. PMID: 32380717 Free PMC article.
-
Humoral Immune Responses Against Zika Virus Infection and the Importance of Preexisting Flavivirus Immunity.J Infect Dis. 2017 Dec 16;216(suppl_10):S906-S911. doi: 10.1093/infdis/jix513. J Infect Dis. 2017. PMID: 29267924 Free PMC article. Review.
-
Rapid response to an emerging infectious disease - Lessons learned from development of a synthetic DNA vaccine targeting Zika virus.Microbes Infect. 2018 Dec;20(11-12):676-684. doi: 10.1016/j.micinf.2018.03.001. Epub 2018 Mar 17. Microbes Infect. 2018. PMID: 29555345 Free PMC article. Review.
Cited by
-
Activation of ATF3 via the Integrated Stress Response Pathway Regulates Innate Immune Response to Restrict Zika Virus.bioRxiv [Preprint]. 2024 Jul 3:2023.07.26.550716. doi: 10.1101/2023.07.26.550716. bioRxiv. 2024. Update in: J Virol. 2024 Oct 22;98(10):e0105524. doi: 10.1128/jvi.01055-24. PMID: 37546954 Free PMC article. Updated. Preprint.
-
Zika Virus: A Review of Biology, Clinical Impacts, and Coinfections.Viruses. 2025 Apr 28;17(5):637. doi: 10.3390/v17050637. Viruses. 2025. PMID: 40431649 Free PMC article. Review.
-
Activation of ATF3 via the integrated stress response pathway regulates innate immune response to restrict Zika virus.J Virol. 2024 Oct 22;98(10):e0105524. doi: 10.1128/jvi.01055-24. Epub 2024 Aug 30. J Virol. 2024. PMID: 39212382 Free PMC article.
References
-
- Robin Y., Mouchet J. Serological and Entomological Study on Yellow Fever in Sierra Leone. Bull. Soc. Pathol. Exot. Filiales. 1975;68:249–258. - PubMed
-
- Jan C., Languillat G., Renaudet J., Robin Y. A Serological Survey of Arboviruses in Gabon. Bull. Soc. Pathol. Exot. Filiales. 1978;71:140–146. - PubMed
Grants and funding
LinkOut - more resources
Full Text Sources
Molecular Biology Databases
