. 2024 Jul 19;16(7):955.
doi: 10.3390/pharmaceutics16070955.

Uncovering the Therapeutic Potential of Lithium Chloride in Type 2 Diabetic Cardiomyopathy: Targeting Tau Hyperphosphorylation and TGF-β Signaling via GSK-3β Inhibition

Affiliations

Uncovering the Therapeutic Potential of Lithium Chloride in Type 2 Diabetic Cardiomyopathy: Targeting Tau Hyperphosphorylation and TGF-β Signaling via GSK-3β Inhibition

Layal Abou Assi et al. Pharmaceutics. .

Abstract

Diabetic cardiomyopathy (DCM) is a major complication of type 2 diabetes mellitus (T2DM) that leads to significant morbidity and mortality. The alteration in the signaling mechanism in diabetes leading to cardiomyopathy remains unclear. The purpose of this study is to investigate the role of tauopathy in myocardial dysfunction observed in T2DM. In that regard, diabetic Sprague Dawley rats were treated with intraperitoneal injections of lithium chloride (LiCl), inhibiting tau phosphorylation. Cardiac function was evaluated, and molecular markers of myocardial fibrosis and the TGF-β signaling were analyzed. T2DM rats exhibited a decline in ejection fraction and fractional shortening that revealed cardiac function abnormalities and increased myocardial fibrosis. These changes were associated with tau hyperphosphorylation. Treating diabetic rats with LiCl attenuated cardiac fibrosis and improved myocardial function. Inhibition of GSK-3β leads to the suppression of tau phosphorylation, which is associated with a decrease in TGF-β expression and regulation of the pro-inflammatory markers, suggesting that tau hyperphosphorylation is parallelly associated with fibrosis and inflammation in the diabetic heart. Our findings provide evidence of a possible role of tau hyperphosphorylation in the pathogenesis of DCM through the activation of TGF-β and by inducing inflammation. Targeting the inhibition of tau phosphorylation may offer novel therapeutic approaches to reduce DCM burden in T2DM patients.

Keywords: TGF-β; diabetic cardiomyopathy; lithium chloride; tau hyperphosphorylation.


Conflict of interest statement

The authors declare no conflicts of interest.

Figures

Figure 1
Figure 1
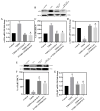
Effect of LiCl treatment on tau phosphorylation in the LV of T2DM rats. (A) Representative Western blot of p-TauSer214 and total tau proteins. (B) Bar graph showing the quantification of p-TauSer214 to total tau protein in LV tissue samples from control rats, rats with T2DM, and T2DM rats treated with LiCl daily or every other day. (C) Representative Western blot of GSK-3βSer9 and total GSK-3β proteins. (D) Bar graph showing the quantification of GSK-3βSer9 to total GSK-3β protein in LV tissue samples from all groups. The data are presented as means ± SD with n = 5/group. Statistical significance is denoted by * p < 0.05 vs. control rats, # p < 0.05 vs. diabetic rats. Full pictures of the Western blots and the densitometry ratio are presented in Figure S1 and Table S1.
Figure 2
Figure 2
LiCl treatment attenuates cardiac injury. (A) Bar graph showing the levels of cTnT and (B) bar graph showing the levels of NT-proBNP in the plasma from control rats, rats with T2DM, and T2DM rats treated with LiCl daily or every other day. The data are presented as means ± SD with n = 5/group. Statistical significance is denoted by * p < 0.05 vs. control rats, # p < 0.05 vs. diabetic rats.
Figure 3
Figure 3
Myocardial injuries in the LV tissue samples from control, T2DM, and lithium-treated T2DM rats. (A) Bar graph showing mRNA levels of α-SMA relative to 26S. (B) Representative Western blot analysis of α-SMA and Hsc70 protein expression in heart LV tissue samples from control rats, rats with T2DM, and T2DM rats treated with LiCl daily or every other day. (C) Bar graph showing the quantification of the α-SMA Western blot. (D) Bar graph showing mRNA levels of α-MyHC relative to 26S. (E) Representative Western blot analysis of α-MyHC and Hsc70 protein expression in heart LV tissue samples from the studied groups. (F) Bar graph showing the quantification of the α-MyHC Western blot. (G) Bar graph showing mRNA levels of β-MyHC relative to 26S. (H) Representative histopathological sections of the LV stained for β-MyHC (brown color) from the studied groups. Scale bar = 100 µm. (I) Bar graph showing the quantification of β-MyHC immunoperoxidase staining. The data are presented as means ± SD with n = 5/group. Statistical significance is denoted by * p < 0.05 vs. control rats, # p < 0.05 vs. diabetic rats. The Western blot gels represent cropped bands from the same gel where more than one sample is represented and are presented for aesthetic purposes. Full pictures of the Western blots and the densitometry ratio are presented in Figure S2 and Table S1.
Figure 3
Figure 3
Myocardial injuries in the LV tissue samples from control, T2DM, and lithium-treated T2DM rats. (A) Bar graph showing mRNA levels of α-SMA relative to 26S. (B) Representative Western blot analysis of α-SMA and Hsc70 protein expression in heart LV tissue samples from control rats, rats with T2DM, and T2DM rats treated with LiCl daily or every other day. (C) Bar graph showing the quantification of the α-SMA Western blot. (D) Bar graph showing mRNA levels of α-MyHC relative to 26S. (E) Representative Western blot analysis of α-MyHC and Hsc70 protein expression in heart LV tissue samples from the studied groups. (F) Bar graph showing the quantification of the α-MyHC Western blot. (G) Bar graph showing mRNA levels of β-MyHC relative to 26S. (H) Representative histopathological sections of the LV stained for β-MyHC (brown color) from the studied groups. Scale bar = 100 µm. (I) Bar graph showing the quantification of β-MyHC immunoperoxidase staining. The data are presented as means ± SD with n = 5/group. Statistical significance is denoted by * p < 0.05 vs. control rats, # p < 0.05 vs. diabetic rats. The Western blot gels represent cropped bands from the same gel where more than one sample is represented and are presented for aesthetic purposes. Full pictures of the Western blots and the densitometry ratio are presented in Figure S2 and Table S1.
Figure 4
Figure 4
Interstitial cardiac fibrosis. (A) Representative micrograph (10× objective) of periodic acid–Schiff (PAS) staining of LV sections showing glycogen extent and distribution in highly fibrotic areas (magenta color) and Masson’s trichrome staining of LV sections showing collagen deposition in highly fibrotic areas (blue-stained ECM). Scale bar = 100 µm. (B) Bar graph showing quantification of glycogen deposition in highly fibrotic areas. (C) Bar graph showing quantification of collagen deposition in highly fibrotic areas in the LV sections from the studied groups. (D) Bar graph showing mRNA levels of collagen I relative to 26S. (E) Bar graph showing mRNA levels of fibronectin relative to 26S. Data are presented as means ± SD with n = 5/group. Statistical significance is denoted by * p < 0.05 vs. control rats, # p < 0.05 vs. diabetic rats.
Figure 5
Figure 5
Cardiac Inflammation. (A) Bar graph showing mRNA levels of IL1-β relative to 26S. (B) Bar graph showing mRNA levels of IL-6 relative to 26S. (C) Bar graph showing mRNA levels of TNF-α relative to 26S. Data are presented as means ± SD with n = 5/group. Statistical significance is denoted by * p < 0.05 vs. control rats, # p < 0.05 vs. diabetic rats.
Figure 6
Figure 6
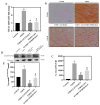
Tau hyperphosphorylation induces cardiac injury by upregulating TGF-β. (A) Bar graph showing mRNA levels of TGF-β1 relative to 26S. (B) Representative micrograph (10× objective) of TGF-β1 immunoperoxidase staining of LV sections, with fibrosis indicated by brown color, from the studied groups. Scale bar = 100 µm. (C) Bar graphs showing TGF-β1 quantification. (D) Representative Western blot of p-smad3Ser423/425 and total smad3 proteins with a (E) bar graph showing the quantification of p-smad3Ser423/425 to total smad3 protein. Data are presented as means ± SEM with n = 5 per group. Statistical significance is denoted by * p < 0.05 vs. control rats, # p < 0.05 vs. diabetic rats. Full pictures of the Western blots and the densitometry ratio are presented in Figure S3 and Table S1.

References

    1. Einarson T.R., Acs A., Ludwig C., Panton U.H. Prevalence of cardiovascular disease in type 2 diabetes: A systematic literature review of scientific evidence from across the world in 2007–2017. Cardiovasc. Diabetol. 2018;17:83. doi: 10.1186/s12933-018-0728-6. - DOI - PMC - PubMed
    1. Jia G., Hill M.A., Sowers J.R. Diabetic Cardiomyopathy: An Update of Mechanisms Contributing to This Clinical Entity. Circ. Res. 2018;122:624–638. doi: 10.1161/CIRCRESAHA.117.311586. - DOI - PMC - PubMed
    1. Young M.E., McNulty P., Taegtmeyer H. Adaptation and maladaptation of the heart in diabetes: Part II: Potential mechanisms. Circulation. 2002;105:1861–1870. doi: 10.1161/01.CIR.0000012467.61045.87. - DOI - PubMed
    1. Alaeddine L.M., Harb F., Hamza M., Dia B., Mogharbil N., Azar N.S., Noureldein M.H., El Khoury M., Sabra R., Eid A.A. Pharmacological regulation of cytochrome P450 metabolites of arachidonic acid attenuates cardiac injury in diabetic rats. Transl. Res. 2021;235:85–101. doi: 10.1016/j.trsl.2021.03.010. - DOI - PubMed
    1. Piera-Velazquez S., Jimenez S.A. Endothelial to Mesenchymal Transition: Role in Physiology and in the Pathogenesis of Human Diseases. Physiol. Rev. 2019;99:1281–1324. doi: 10.1152/physrev.00021.2018. - DOI - PMC - PubMed

LinkOut - more resources