

Identification of South African Plant-Based Bioactive Compounds as Potential Inhibitors against the SARS-CoV-2 Receptor
- PMID: 39065672
- PMCID: PMC11279959
- DOI: 10.3390/ph17070821
Identification of South African Plant-Based Bioactive Compounds as Potential Inhibitors against the SARS-CoV-2 Receptor
Abstract
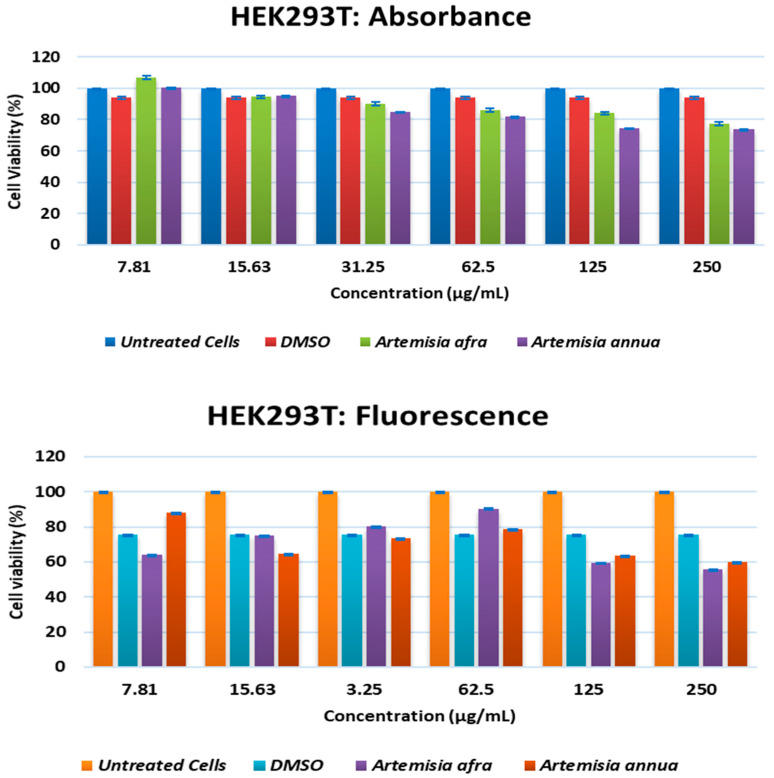
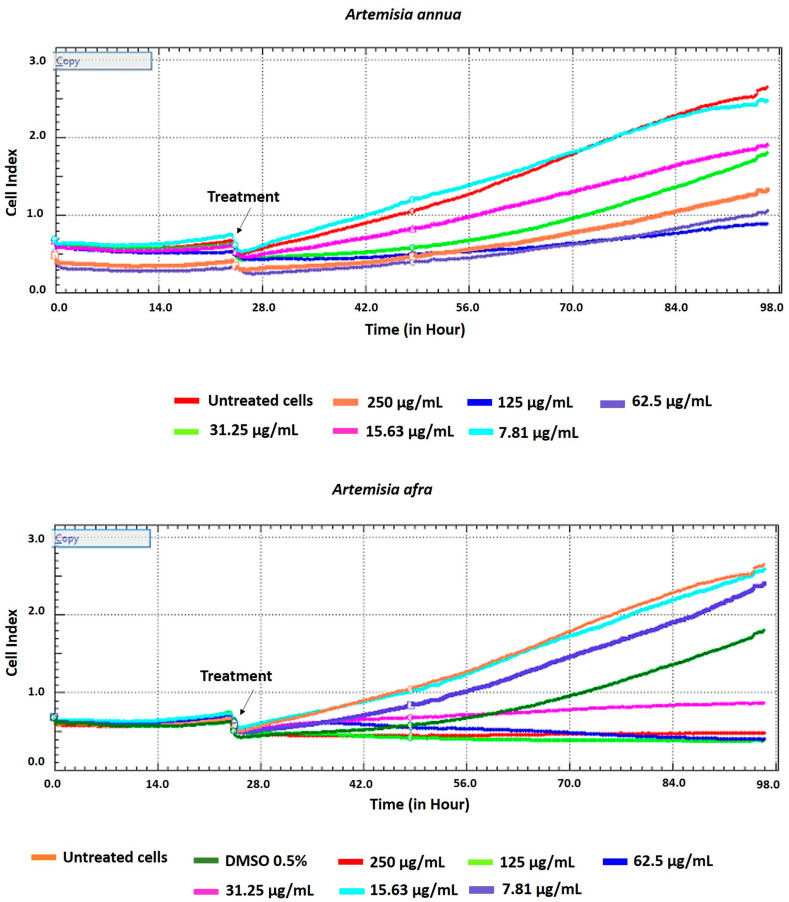
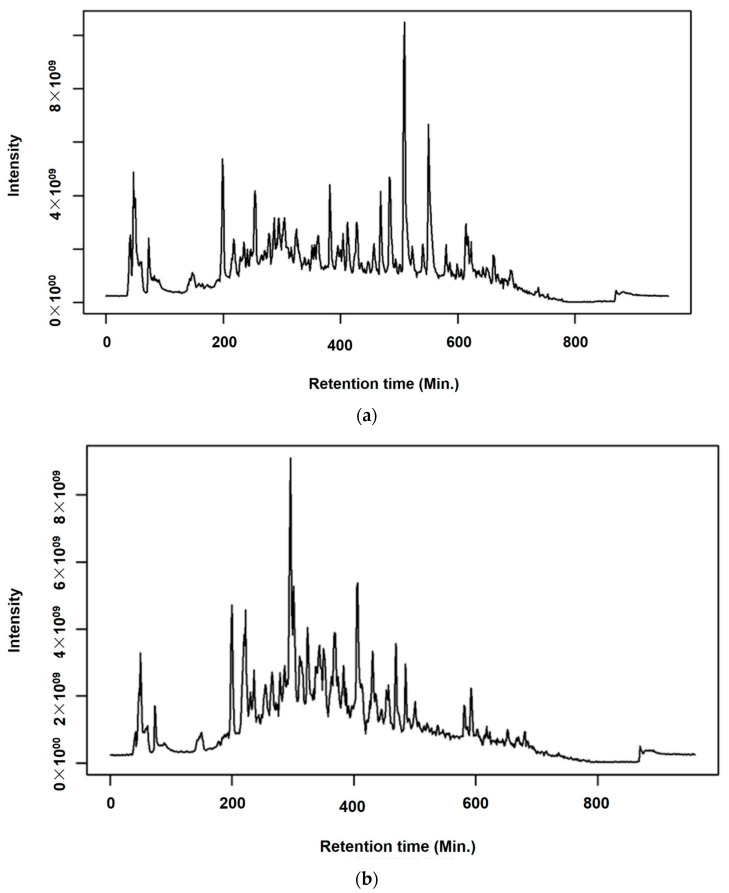
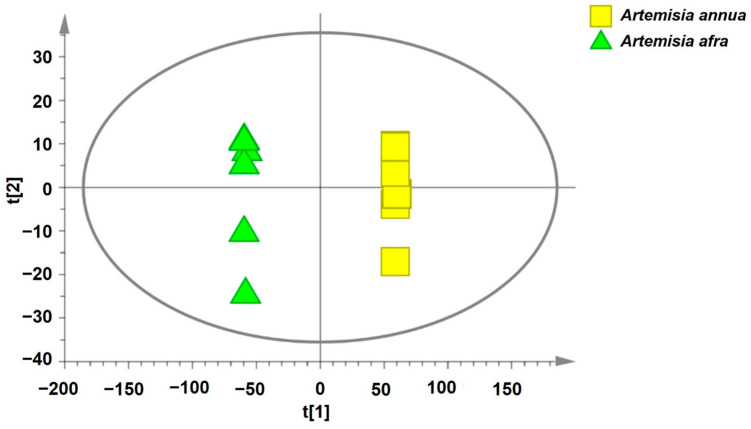
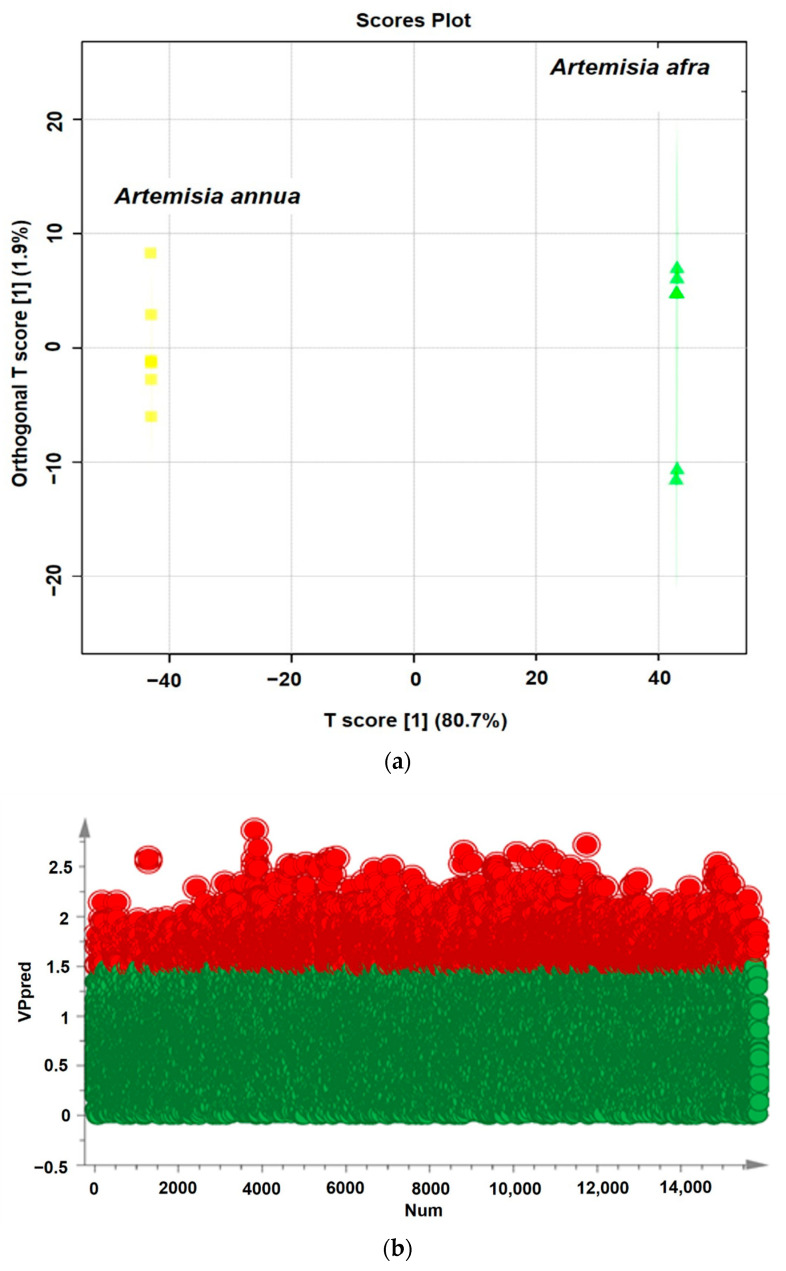
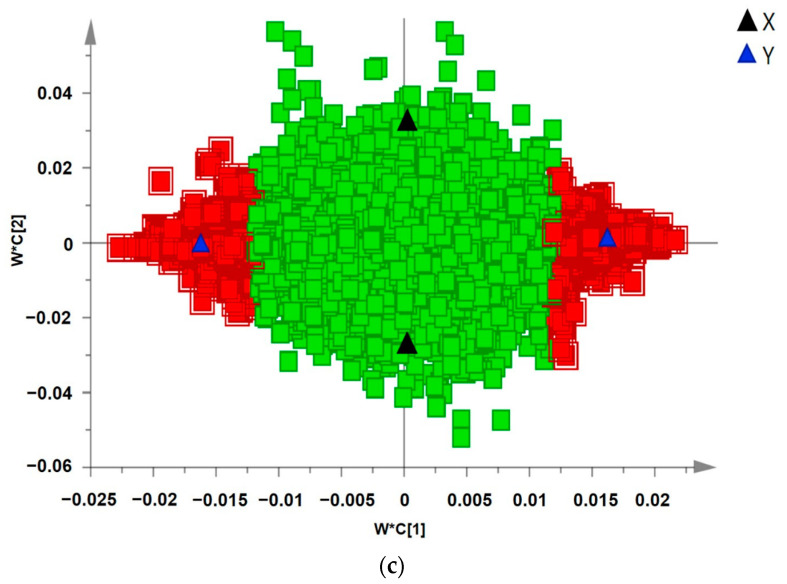
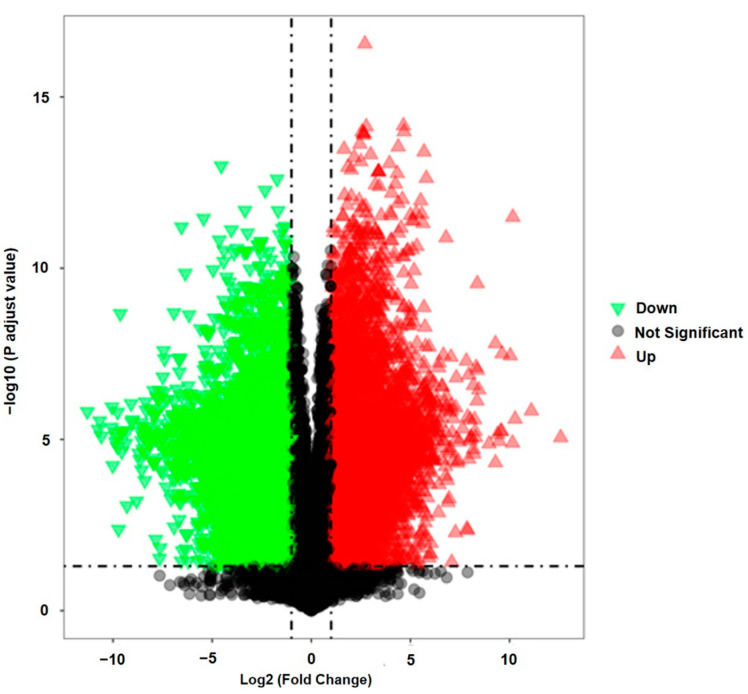
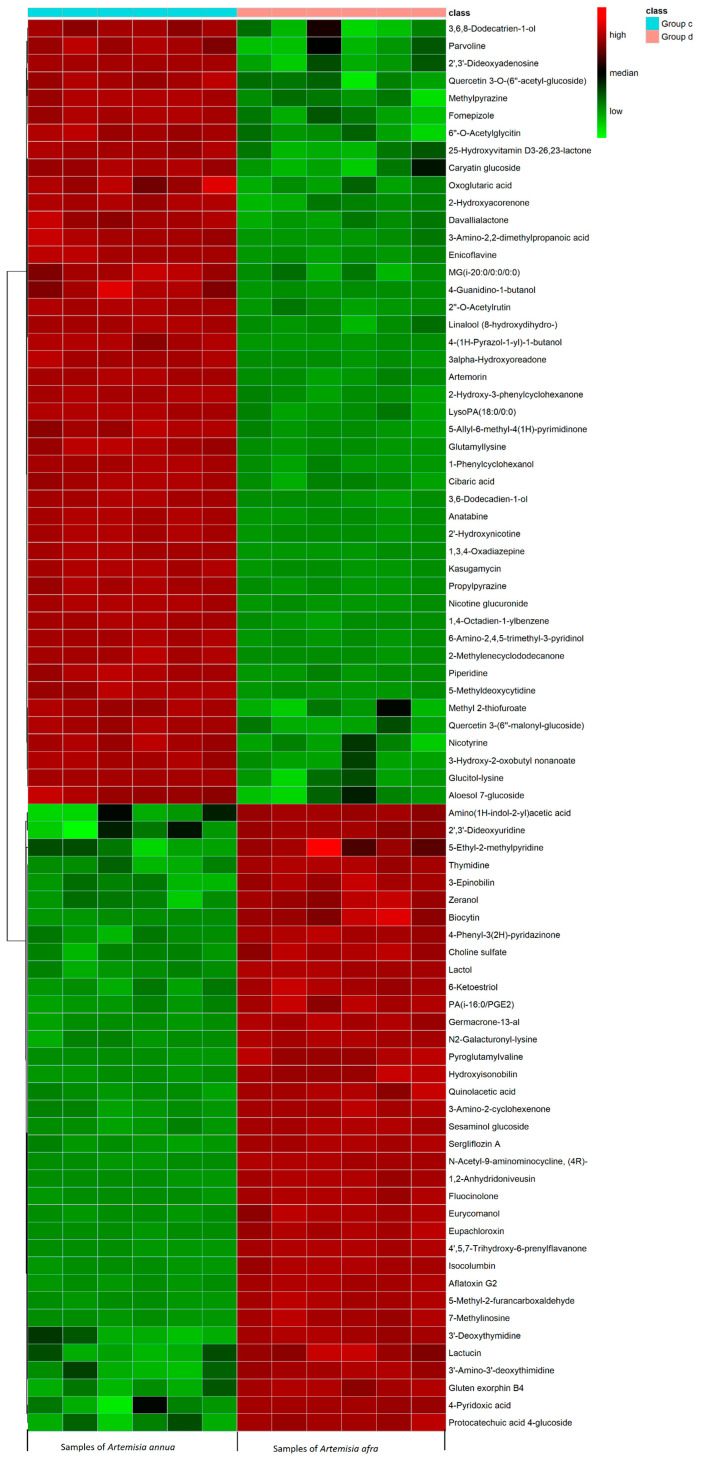
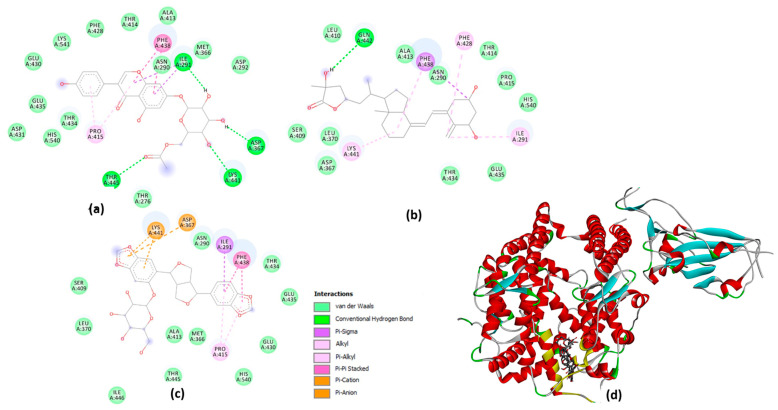
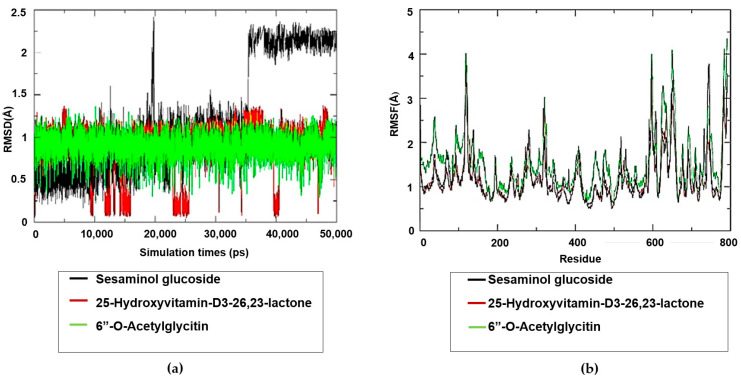
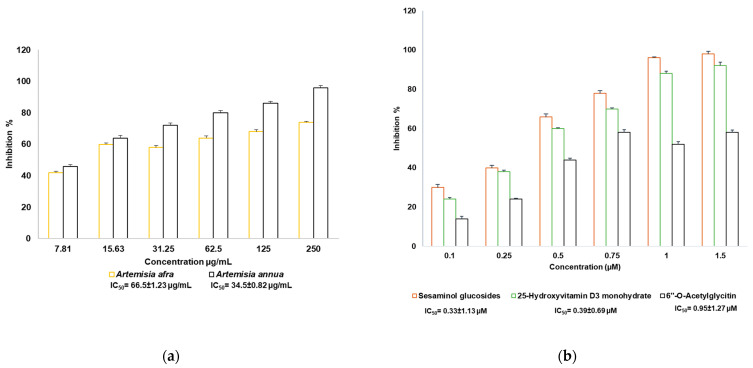
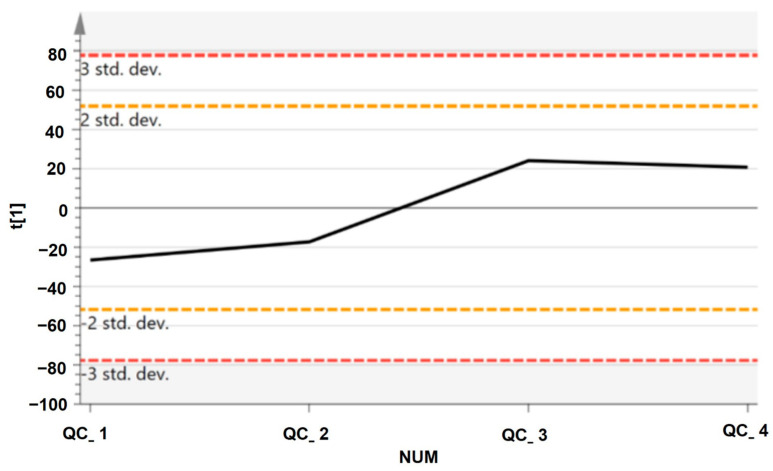
The expected progress in SARS-CoV-2 vaccinations, as anticipated in 2020 and 2021, has fallen short, exacerbating global disparities due to a lack of universally recognized "safe and effective" vaccines. This study focuses on extracts of South African medicinal plants, Artemisia annua and Artemisia afra, to identify metabolomic bioactive compounds inhibiting the binding of the SARS-CoV-2 spike protein to ACE2 receptors. The extracts were monitored for cytotoxicity using a resazurin cell viability assay and xCELLigence real-time cell analyzer. Chemical profiling was performed using UPLC-MS/MS, orthogonal projection to latent structures (OPLS), and evaluated using principle component analysis (PCA) models. Identified bioactive compounds were subjected to in vitro SARS-CoV-2 enzyme inhibition assay using standard methods and docked into the spike (S) glycoprotein of SARS-CoV-2 using Schrodinger® suite followed by molecular dynamics simulation studies. Cell viability assays revealed non-toxic effects of extracts on HEK293T cells at lower concentrations. Chemical profiling identified 81 bioactive compounds, with compounds like 6″-O-acetylglycitin, 25-hydroxyvitamin D3-26,23-lactone, and sesaminol glucoside showing promising binding affinity. Molecular dynamics simulations suggested less stable binding, but in vitro studies demonstrated the ability of these compounds to interfere with SARS-CoV-2 spike protein's binding to the human ACE2 receptor. Sesaminol glucoside emerged as the most effective inhibitor against this interaction. This study emphasizes the importance of multiplatform metabolite profiling and chemometrics to understand plant extract composition. This finding is of immense significance in terms of unravelling metabolomics bioactive compounds inhibiting the binding of the SARS-CoV-2 spike protein to ACE2 receptors and holds promise for phytotherapeutics against SARS-CoV-2.
Keywords: 25-hydroxyvitamin D3-26,23-lactone; 6″-O-acetylglycitin; Artemisia afra; Artemisia annua; angiotensin-converting enzyme 2 (ACE2); anti-COVID bioactive compounds; sesaminol glucoside; spike (S) glycoprotein; tryptanthrin.
Conflict of interest statement
The authors declare no conflicts of interest.
Figures
Similar articles
-
Integration of metabolomics and chemometrics with in-silico and in-vitro approaches to unravel SARS-Cov-2 inhibitors from South African plants.PLoS One. 2025 Mar 26;20(3):e0320415. doi: 10.1371/journal.pone.0320415. eCollection 2025. PLoS One. 2025. PMID: 40138368 Free PMC article.
-
Chemical profiling and unraveling of anti-COVID-19 biomarkers of red sage (Lantana camara L.) cultivars using UPLC-MS/MS coupled to chemometric analysis, in vitro study and molecular docking.J Ethnopharmacol. 2022 Jun 12;291:115038. doi: 10.1016/j.jep.2022.115038. Epub 2022 Feb 10. J Ethnopharmacol. 2022. PMID: 35151836 Free PMC article.
-
Use of hyphenated analytical techniques to identify the bioactive constituents of Gunnera perpensa L., a South African medicinal plant, which potently inhibit SARS-CoV-2 spike glycoprotein-host ACE2 binding.Anal Bioanal Chem. 2022 May;414(13):3971-3985. doi: 10.1007/s00216-022-04041-3. Epub 2022 Apr 14. Anal Bioanal Chem. 2022. PMID: 35419694 Free PMC article.
-
Multidisciplinary Approaches Identify Compounds that Bind to Human ACE2 or SARS-CoV-2 Spike Protein as Candidates to Block SARS-CoV-2-ACE2 Receptor Interactions.mBio. 2021 Mar 30;12(2):e03681-20. doi: 10.1128/mBio.03681-20. mBio. 2021. PMID: 33785634 Free PMC article.
-
Phytocompounds of Rheum emodi, Thymus serpyllum, and Artemisia annua Inhibit Spike Protein of SARS-CoV-2 Binding to ACE2 Receptor: In Silico Approach.Curr Pharmacol Rep. 2021;7(4):135-149. doi: 10.1007/s40495-021-00259-4. Epub 2021 Jul 15. Curr Pharmacol Rep. 2021. PMID: 34306988 Free PMC article. Review.
Cited by
-
A comprehensive review on computational metabolomics: Advancing multiscale analysis through in-silico approaches.Comput Struct Biotechnol J. 2025 Jul 13;27:3191-3215. doi: 10.1016/j.csbj.2025.07.016. eCollection 2025. Comput Struct Biotechnol J. 2025. PMID: 40735430 Free PMC article. Review.
-
Integration of metabolomics and chemometrics with in-silico and in-vitro approaches to unravel SARS-Cov-2 inhibitors from South African plants.PLoS One. 2025 Mar 26;20(3):e0320415. doi: 10.1371/journal.pone.0320415. eCollection 2025. PLoS One. 2025. PMID: 40138368 Free PMC article.
References
-
- Wang F., Chen L., Chen H., Yan Z., Liu Y. Discovery of the key active compounds in Citri Reticulatae Pericarpium (Citrus reticulata “Chachi”) and their therapeutic potential for the treatment of COVID-19 based on comparative metabolomics and network pharmacology. Front. Pharmacol. 2022;13:1048926. doi: 10.3389/fphar.2022.1048926. - DOI - PMC - PubMed
Grants and funding
LinkOut - more resources
Full Text Sources
Miscellaneous
