. 2024 Jul 1;17(7):860.
doi: 10.3390/ph17070860.

Antiproliferative Effect of 7-Ketositosterol in Breast and Liver Cancer Cells: Possible Impact on Ceramide, Extracellular Signal-Regulated Kinases, and Nuclear Factor Kappa B Signaling Pathways

Affiliations

Antiproliferative Effect of 7-Ketositosterol in Breast and Liver Cancer Cells: Possible Impact on Ceramide, Extracellular Signal-Regulated Kinases, and Nuclear Factor Kappa B Signaling Pathways

Zerrin Barut et al. Pharmaceuticals (Basel). .

Abstract

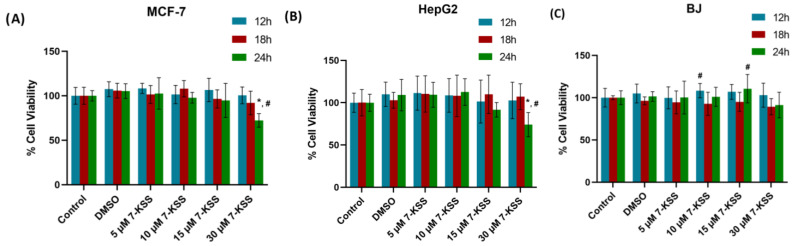
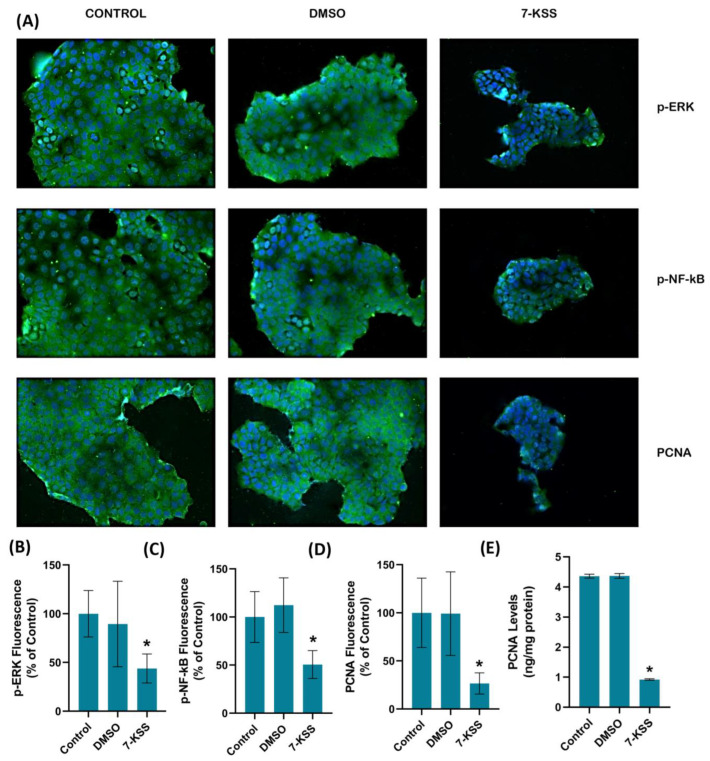
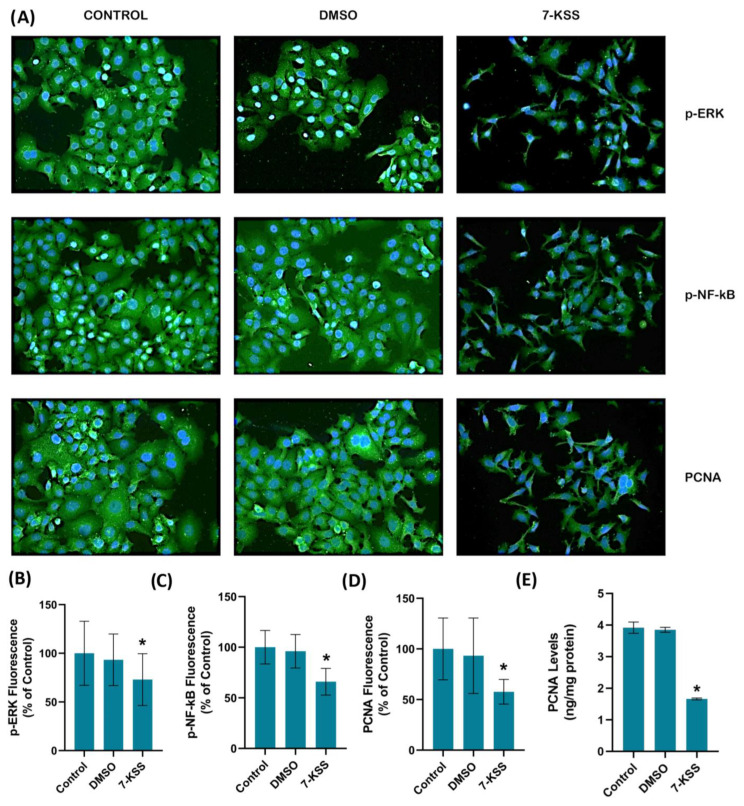
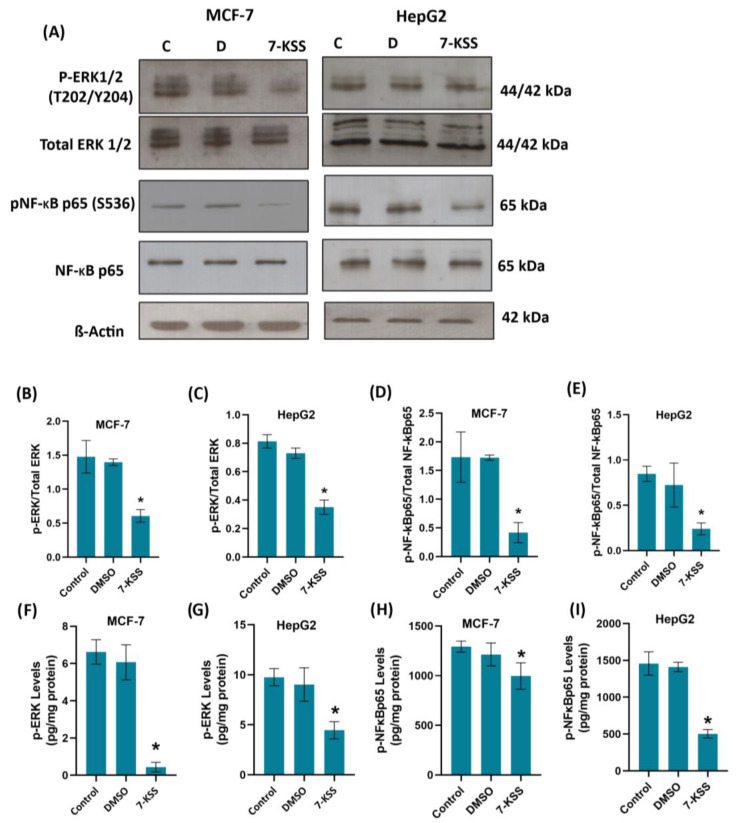
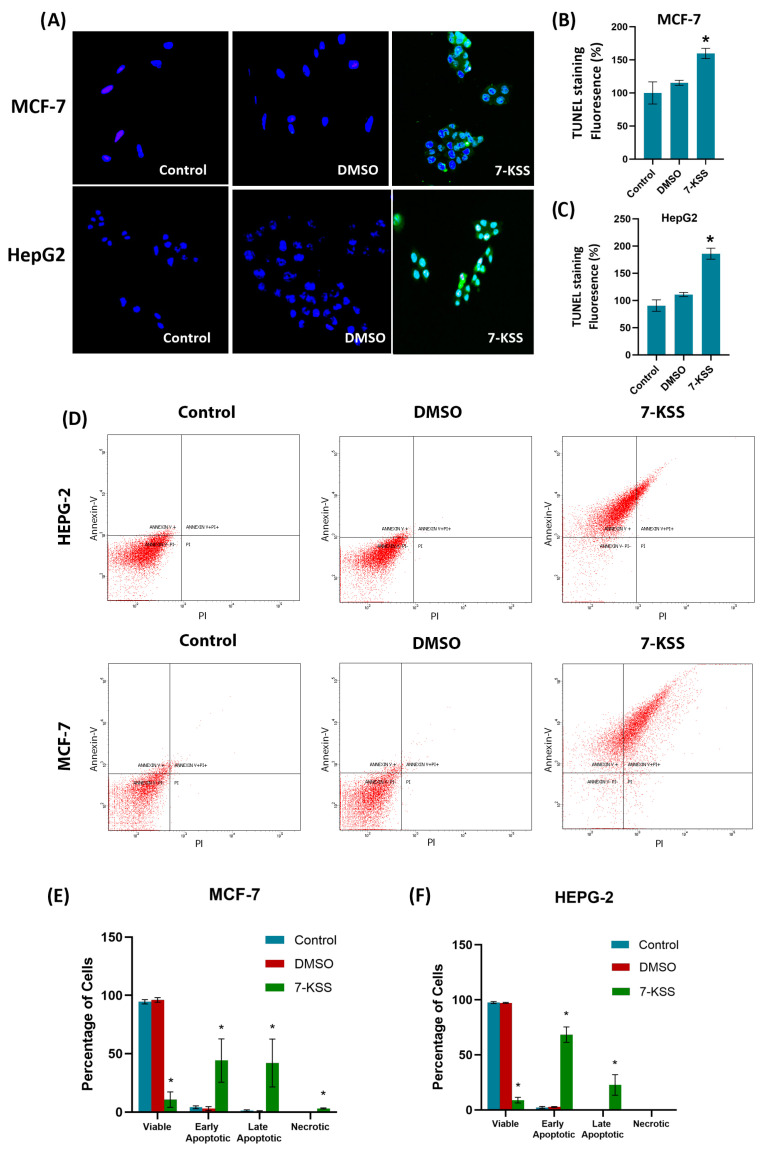
Background: This study aimed to examine the effect of 7-Ketositosterol (7-KSS), on sphingomyelin/ceramide metabolites and apoptosis in human breast MCF-7 and human liver HepG2 cancer cells. Methods: Anti-proliferative effects of 7-KSS treatment were assessed at different concentrations and periods. Cell viability was assessed through MTT analysis, whereas the levels of sphingosine-1-phosphate (S1P), sphingomyelins (SMs), and ceramides (CERs) were measured using LC-MS/MS. Phosphorylated 44/42 ERK1/2 and NF-κB p65 (Ser536) protein levels were measured by Western blot analysis and immunofluorescence staining. Apoptosis was evaluated by TUNEL staining and flow cytometric assessment of annexin-V and propidium iodide (PI) labeling. Results: Treatment with 7-KSS significantly decreased cell survival and S1P, p-44/42 ERK1/2, and p-NF-κB p65 protein levels in cancer cells compared to controls. A substantial rise was detected in intracellular amounts of C16-C24 CERs and apoptosis in cancer cells incubated with 7-KSS. Conclusions: 7-KSS stimulated ceramide accumulation and apoptosis while decreasing cell proliferation via downregulating S1P, p-44/42 ERK1/2, and p-NF-κB p65 protein levels.

Keywords: 7-Ketositosterol; ERK; apoptosis; ceramide.


Conflict of interest statement

The authors declare no conflicts of interest.

Figures

Figure 1
Figure 1
Analysis of 7-Ketositosterol toxicity in cancer cells and BJ fibroblasts. (A) 24 h viability analysis of 7-KSS administration in MCF-7 cells. Values mean ± SD (n = 8). One-way ANOVA or Kruskal–Wallis analysis was performed for statistical testing. The difference between the groups was analyzed by Tukey or Dunn’s test. *, p < 0.05 vs. control, DMSO, and 5 μM 7-KSS groups over the same time periods. #, p < 0.05 compared to 12 h and 18 h in the same dose interval. (B) 24 h viability analysis of 7-KSS administration in HepG2 cells. Values mean ± SD (n = 8). One-way ANOVA or Kruskal–Wallis analysis was performed for statistical testing. The difference between the groups was analyzed by Tukey or Dunn’s test. *, p < 0.05 vs. control, DMSO, 5 μM 7-KSS, and 10 μM 7-KSS over the same time periods. #, p < 0.05 compared to 12 and 18 h in the same dose range. (C) 24 h viability analysis of 7-KSS administration in BJ fibroblast cells. Values mean ± SD (n = 7–8). One-way ANOVA or Kruskal–Wallis analysis was performed for statistical testing. The difference among the groups was analyzed by Tukey or Dunn’s test. #, p < 0.05 vs. 18 h at the same dose.
Figure 2
Figure 2
(A) Representative Immunofluorescent staining of p-ERKs, p-NF-κB, and PCNA in MCF-7 cells incubated with 30 µM 7-Ketositosterol for 24 h. A 40× objective lens was used to obtain double-labeled images. (B) Quantitation of p-ERK fluorescence staining by ImageJ software. Values mean ± SD (n = 10). Kruskal–Wallis test and Dunn’s multiple comparison analysis were performed to test statistical significance. * p < 0.05 vs. control and DMSO groups. (C) Quantitation of p-NF-κB fluorescence staining. Values are given as mean ± SD (n = 10). One-way ANOVA test and Tukey’s multiple comparisons were used to determine statistical significance. * p < 0.05 compared to control and DMSO. (D) PCNA staining quantitation. Values are given as mean ± SD (n = 10). One-way ANOVA test and Tukey’s multiple comparisons were used to determine statistical significance. * p < 0.05 compared to control and DMSO. (E) PCNA levels in MCF-7 cells. Values mean ± SD (n = 5). *, p < 0.05 vs. control and DMSO groups.
Figure 3
Figure 3
(A) Representative immunofluorescent staining of p-ERKs, p-NF-κB, and PCNA in HepG2 cells incubated with 30 µM 7-Ketositosterol for 24 h. A 40× objective lens was used to obtain double-labeled images. (B) Quantitation of p-ERK fluorescence staining by ImageJ software. Values mean ± SD (n = 10). Kruskal–Wallis test and Dunn’s multiple comparison analysis were performed to test statistical significance. * p < 0.05 vs. control group. (C) Quantitation of p-NF-κB fluorescence staining. Values are given as mean ± SD (n = 10). One-way ANOVA test and Tukey’s multiple comparisons analysis were used for statistical analysis. * p < 0.05 compared to control and DMSO groups. (D) Quantitation of PCNA fluorescence staining by ImageJ software. Values mean ± SD (n = 10). Kruskal–Wallis test and Dunn’s multiple comparison analysis were performed to test statistical significance. * p < 0.05 vs. control and DMSO groups. (E) PCNA levels in HepG2 cell groups. Values mean ± SD (n = 5). One-way ANOVA and Tukey multiple comparison test were performed for statistical analysis. *, p < 0.05 vs. control and DMSO groups.
Figure 4
Figure 4
(A) Illustrative Western immunoblots for phospho-44/42 ERK1/2 (T202/Y204), total ERK 1/2, phospho-NF-κB p65 (S536), total NF-κB p65, and β-Actin in MCF-7 and HepG2 cells. C, control; D, cells treated with 1 μL/mL dimethyl sulfoxide; 7-KSS, cell treated with 30 μM 7-KSS for 24 h. (B) The band quantitation ratio of phospho-ERK/Total ERK in MCF-7 and (C) HepG2 cells. (D) The band quantitation ratio of phospho-NF-κB p65/Total NF-κB p65 in MCF-7 and (E) HepG2 cells. Blots were quantitated by ImageJ software. Data shown are representative of 3 separate experiments and values are given as mean ± SD. Statistical analysis was performed by one-way ANOVA and all pairwise multiple comparison procedures carried out by the Tukey test. *, p < 0.01 vs. control and DMSO groups. (F) Phospho-ERK levels in MCF-7 cells. Values mean ± SD (n = 5–8). One-way ANOVA and Tukey multiple comparisons were used to determine statistical significance. *, p < 0.05 vs. control and DMSO groups. (G) Phospho-ERK levels in HepG2 cells. Values mean ± SD (n = 8). One-way ANOVA and Tukey multiple comparisons were performed for statistical analysis. *, p < 0.05 when compared with the control and DMSO groups. (H) Phospho-NF-κB p65 levels in MCF-7 cells. Values mean ± SD (n = 8). One-way ANOVA and Tukey multiple comparisons were performed to test statistical significance. *, p < 0.05 when compared with the control and DMSO groups. (I) Phospho-NF-κB p65 levels in HepG2 cells. Values mean ± SD (n = 8). One-way ANOVA and Tukey multiple comparisons were used to determine statistical significance. *, p < 0.05 when compared with the control and DMSO groups.
Figure 5
Figure 5
TUNEL staining in cancer cells. (A) Dimethyl sulfoxide (DMSO, 1 μL/mL) and 7-KSS (30 μM) were applied for 24 h (200× magnification). (B) Quantitation of TUNEL staining in MCF-7 cells with the ImageJ program. Values mean ± SD (n = 7–8). Kruskal–Wallis test and Dunn’s analysis were performed to test statistical significance. *, p < 0.05 compared with the control and DMSO groups. (C) Quantitation of TUNEL staining in HepG2 cells with ImageJ program. Values are mean ± SD (n = 8). One-way ANOVA and Tukey multiple comparisons were used to determine statistical significance. *, p < 0.05 when compared with the control and DMSO groups. (D) Annexin V–FITC and PI-labeled HepG2 and MCF-7 cells. In total, 10,000 events were analyzed for each condition. (E) Quantitative analysis of annexin-V and PI labeling in MCF-7 cells by flow cytometry. Values mean ± SD (n = 3). One-way ANOVA analysis and Tukey test were used for statistical analysis. *, p < 0.05 compared to control and DMSO groups. (F) Quantitative analysis of annexin-V and PI labeling in HepG2 cells by flow cytometry. Values mean ± SD (n = 3). One-way ANOVA analysis and Tukey test were used for statistical analysis. *, p < 0.05 compared to control and DMSO groups.

Similar articles

Cited by

References

    1. Jefrei E., Xu M., Moore J.B., Thorne J.L. Phytosterol and phytostanol-mediated epigenetic changes in cancer and other non-communicable diseases: A systematic review. Br. J. Nutr. 2024;131:935–943. doi: 10.1017/S0007114523002532. - DOI - PMC - PubMed
    1. Ramprasath V.R., Awad A.B. Role of Phytosterols in Cancer Prevention and Treatment. J. AOAC Int. 2015;98:735–738. doi: 10.5740/jaoacint.SGERamprasath. - DOI - PubMed
    1. Plat J., Brzezinka H., Lütjohann D., Mensink R.P., von Bergmann K. Oxidized plant sterols in human serum and lipid infusions asmeasured by combined gas-liquid chromatography-mass spectrometry. J. Lipid Res. 2001;42:2030–2038. doi: 10.1016/S0022-2275(20)31532-7. - DOI - PubMed
    1. El Omari N., Bakrim S., Khalid A., Abdalla A.N., Iesa M.A.M., El Kadri K., Tang S.Y., Goh B.H., Bouyahya A. Unveiling the molecular mechanisms: Dietary phytosterols as guardians against cardiovascular diseases. Nat. Prod. Bioprospect. 2024;14:27. doi: 10.1007/s13659-024-00451-1. - DOI - PMC - PubMed
    1. Khan Z., Nath N., Rauf A., Bin Emran T., Mitra S., Islam F., Chandran D., Barua J., Khandaker M.U., Idris A.M., et al. Multifunctional roles and pharmacological potential of β-sitosterol: Emerging evidence toward clinical applications. Chem. Interact. 2022;365:110117. doi: 10.1016/j.cbi.2022.110117. - DOI - PubMed

LinkOut - more resources