

Fish Oil Supplementation Mitigates High-Fat Diet-Induced Obesity: Exploring Epigenetic Modulation and Genes Associated with Adipose Tissue Dysfunction in Mice
- PMID: 39065712
- PMCID: PMC11280081
- DOI: 10.3390/ph17070861
Fish Oil Supplementation Mitigates High-Fat Diet-Induced Obesity: Exploring Epigenetic Modulation and Genes Associated with Adipose Tissue Dysfunction in Mice
Abstract
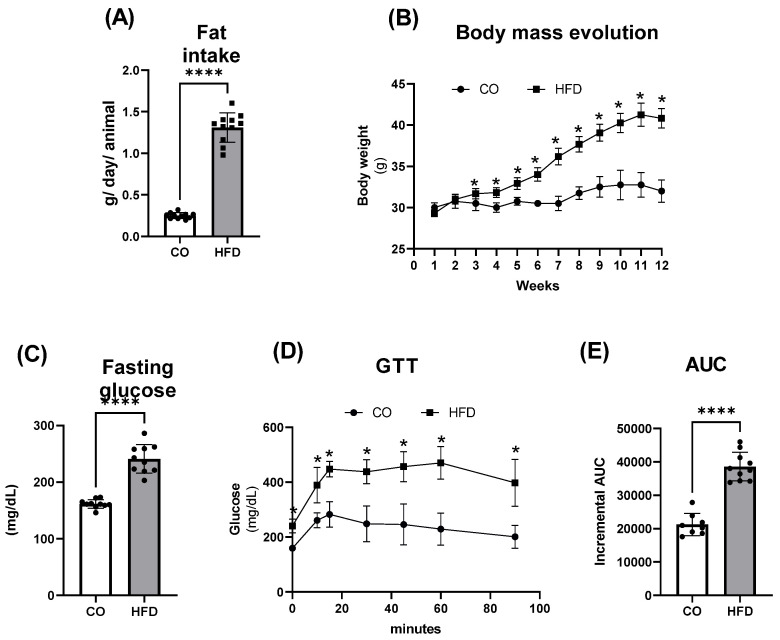
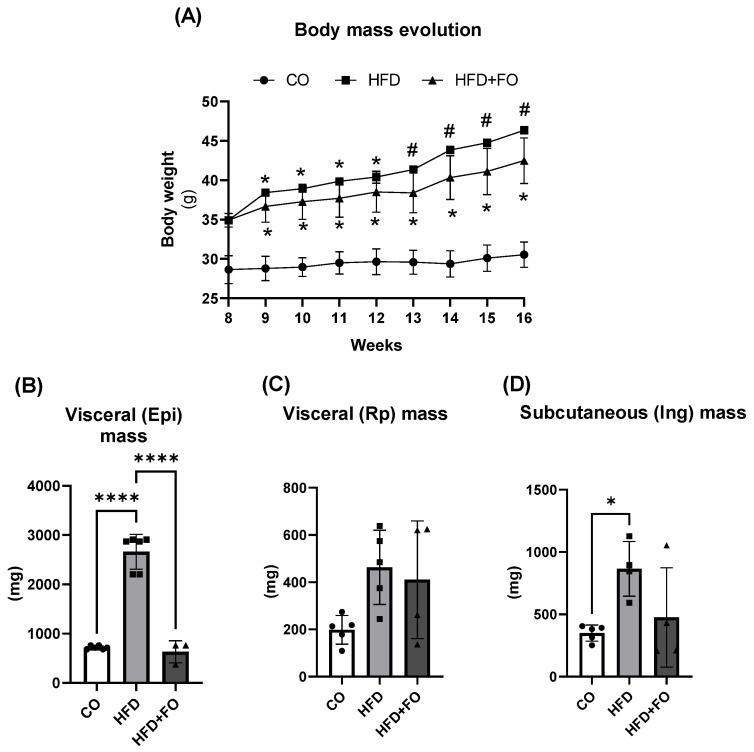
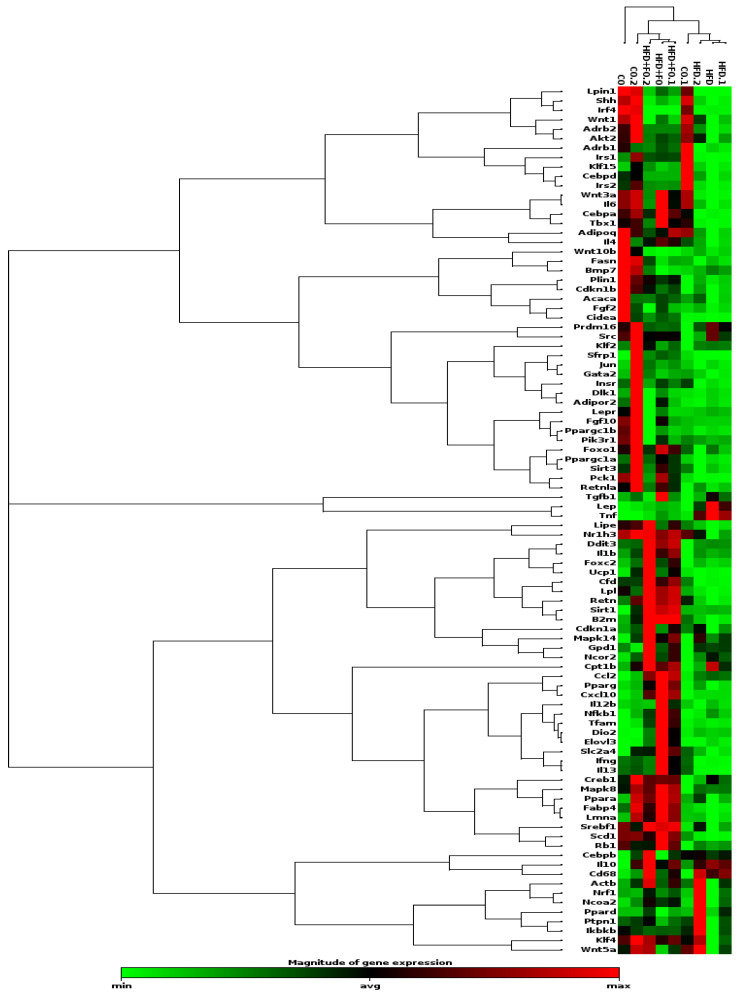
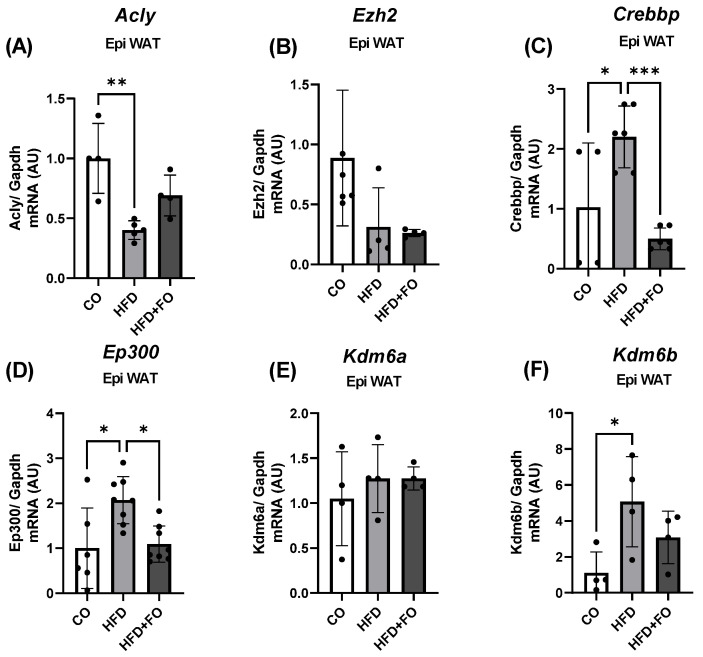
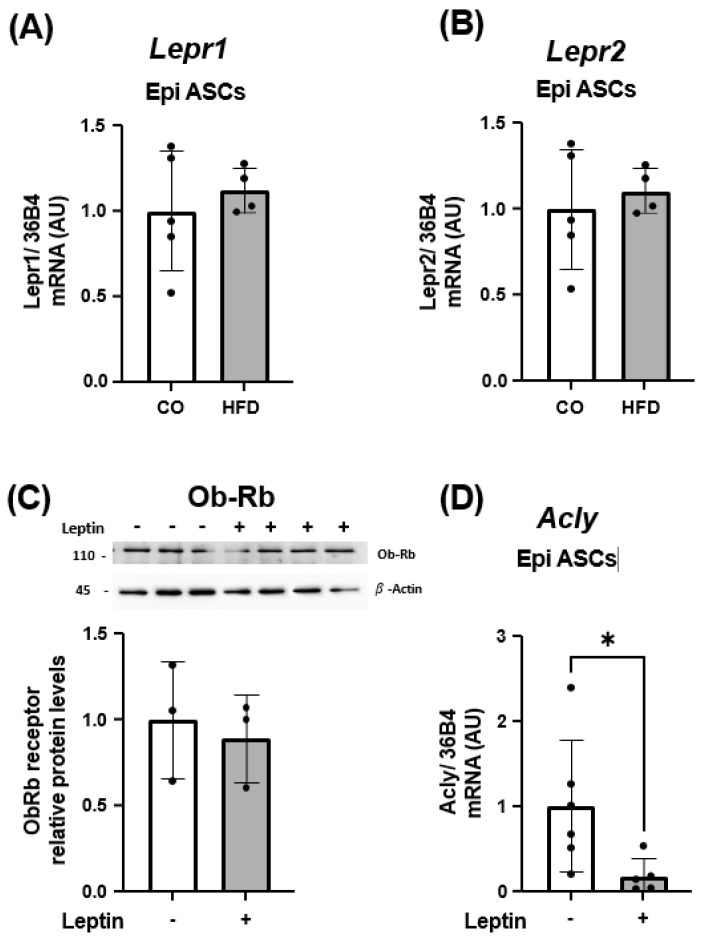
This study investigated the effects of fish oil (FO) treatment, particularly enriched with eicosapentaenoic acid (EPA), on obesity induced by a high-fat diet (HFD) in mice. The investigation focused on elucidating the impact of FO on epigenetic modifications in white adipose tissue (WAT) and the involvement of adipose-derived stem cells (ASCs). C57BL/6j mice were divided into two groups: control diet and HFD for 16 weeks. In the last 8 weeks, the HFD group was subdivided into HFD and HFD + FO (treated with FO). WAT was removed for RNA and protein extraction, while ASCs were isolated, cultured, and treated with leptin. All samples were analyzed using functional genomics tools, including PCR-array, RT-PCR, and Western Blot assays. Mice receiving an HFD displayed increased body mass, fat accumulation, and altered gene expression associated with WAT inflammation and dysfunction. FO supplementation attenuated these effects, a potential protective role against HFD-induced obesity. Analysis of H3K27 revealed HFD-induced changes in histone, which were partially reversed by FO treatment. This study further explored leptin signaling in ASCs, suggesting a potential mechanism for ASC dysfunction in the obesity-rich leptin environment of WAT. Overall, FO supplementation demonstrated efficacy in mitigating HFD-induced obesity, influencing epigenetic and molecular pathways, and shedding light on the role of ASCs and leptin signaling in WAT dysfunction associated with obesity.
Keywords: H3K27; WAT; inflammation; leptin; n-3 PUFA; obesity.
Conflict of interest statement
The authors declare no conflicts of interest. The funders had no role in the design of this study; in the collection, analyses, or interpretation of data; in the writing of the manuscript, or in the decision to publish the results.
Figures

Similar articles
-
The Activation of the NF-κB Pathway in Human Adipose-Derived Stem Cells Alters the Deposition of Epigenetic Marks on H3K27 and Is Modulated by Fish Oil.Life (Basel). 2024 Dec 12;14(12):1653. doi: 10.3390/life14121653. Life (Basel). 2024. PMID: 39768360 Free PMC article.
-
Fish oil supplementation alleviates metabolic and anxiodepressive effects of diet-induced obesity and associated changes in brain lipid composition in mice.Int J Obes (Lond). 2020 Sep;44(9):1936-1945. doi: 10.1038/s41366-020-0623-6. Epub 2020 Jun 16. Int J Obes (Lond). 2020. PMID: 32546855
-
Impact of fish oil on epigenetic regulation in perirenal adipose tissue of obese mice.Obes Res Clin Pract. 2025 Mar-Apr;19(2):122-129. doi: 10.1016/j.orcp.2025.03.006. Epub 2025 Apr 16. Obes Res Clin Pract. 2025. PMID: 40246605
-
Fish Oil Enriched in EPA, but Not in DHA, Reverses the Metabolic Syndrome and Adipocyte Dysfunction Induced by a High-Fat Diet.Nutrients. 2021 Feb 26;13(3):754. doi: 10.3390/nu13030754. Nutrients. 2021. PMID: 33652751 Free PMC article.
-
Fish Oil Supplementation Alleviates the Altered Lipid Homeostasis in Blood, Liver, and Adipose Tissues in High-Fat Diet-Fed Rats.J Agric Food Chem. 2018 Apr 25;66(16):4118-4128. doi: 10.1021/acs.jafc.8b00529. Epub 2018 Apr 16. J Agric Food Chem. 2018. PMID: 29627983
Cited by
-
Fish oil attenuates the expression of the CCL2 chemokine and histone-modifying enzymes in LPS-stimulated human preadipocytes.Metabol Open. 2024 Nov 30;24:100336. doi: 10.1016/j.metop.2024.100336. eCollection 2024 Dec. Metabol Open. 2024. PMID: 39717736 Free PMC article.
-
In silico-based investigation of the molecular mechanism of Artocarpus communis seed hexane fraction against metabolic syndrome.J Mol Model. 2025 Jan 23;31(2):60. doi: 10.1007/s00894-024-06274-8. J Mol Model. 2025. PMID: 39847117
-
Cardiometabolic disease management: influences from epigenetics.Epigenomics. 2025 May;17(7):463-474. doi: 10.1080/17501911.2025.2489921. Epub 2025 Apr 21. Epigenomics. 2025. PMID: 40255091 Review.
-
The Activation of the NF-κB Pathway in Human Adipose-Derived Stem Cells Alters the Deposition of Epigenetic Marks on H3K27 and Is Modulated by Fish Oil.Life (Basel). 2024 Dec 12;14(12):1653. doi: 10.3390/life14121653. Life (Basel). 2024. PMID: 39768360 Free PMC article.
-
Maternal dietary fish oil developmentally programs adipogenic development in the broiler chick embryo.Poult Sci. 2025 Jul 27;104(10):105619. doi: 10.1016/j.psj.2025.105619. Online ahead of print. Poult Sci. 2025. PMID: 40752194 Free PMC article.
References
Grants and funding
LinkOut - more resources
Full Text Sources
Research Materials
Miscellaneous
