

Serum Metabolomics Uncovers the Mechanisms of Inulin in Preventing Non-Alcoholic Fatty Liver Disease
- PMID: 39065745
- PMCID: PMC11279973
- DOI: 10.3390/ph17070895
Serum Metabolomics Uncovers the Mechanisms of Inulin in Preventing Non-Alcoholic Fatty Liver Disease
Abstract
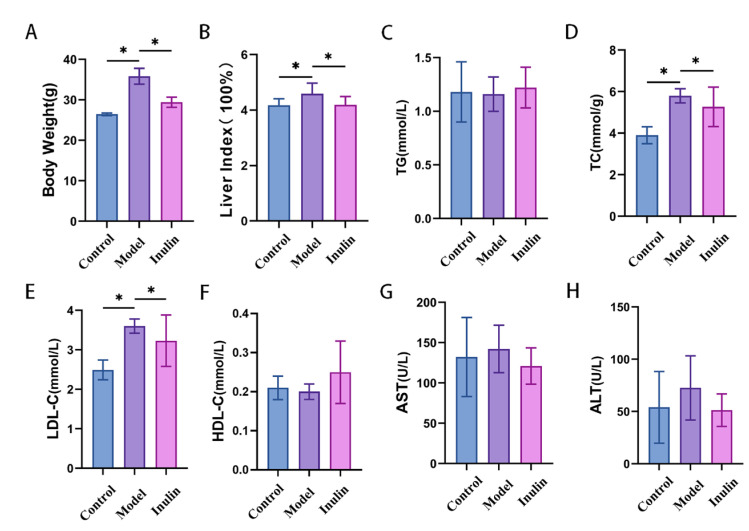
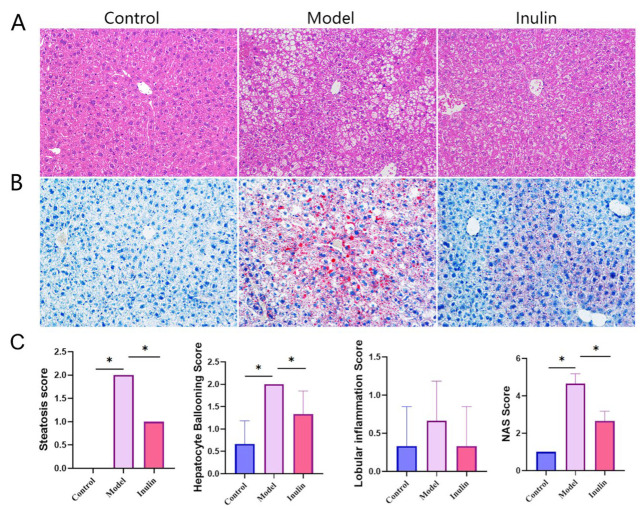
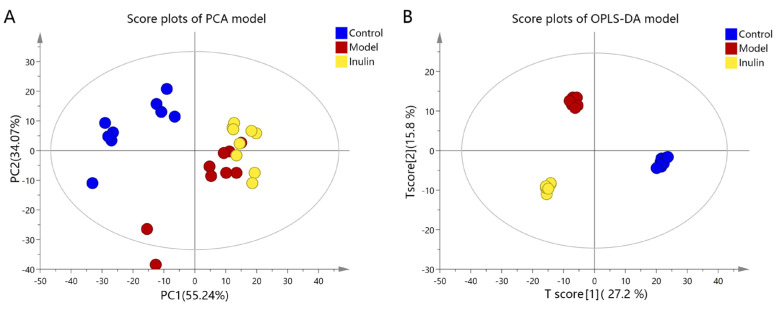
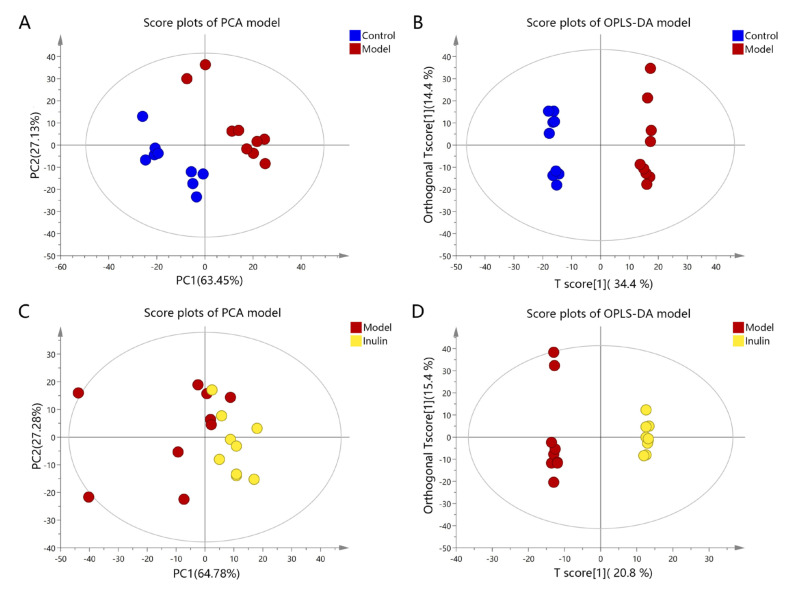
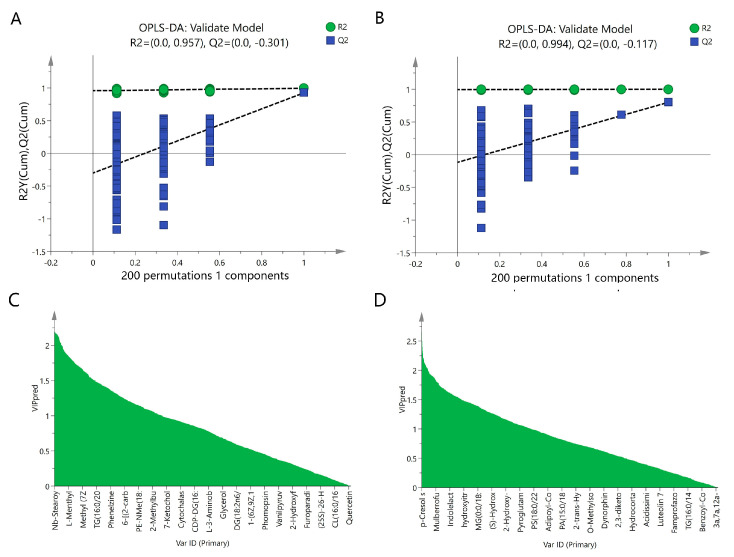
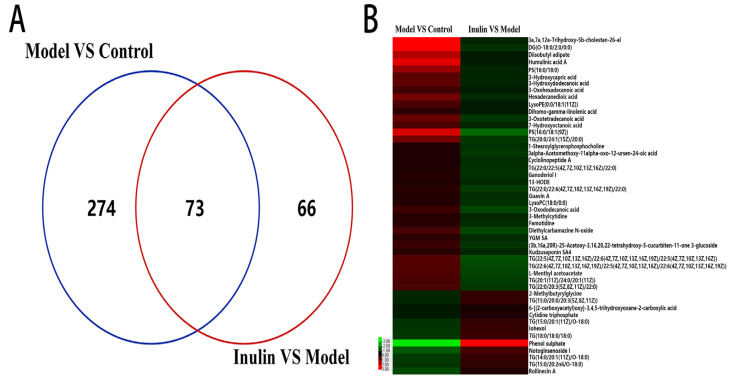
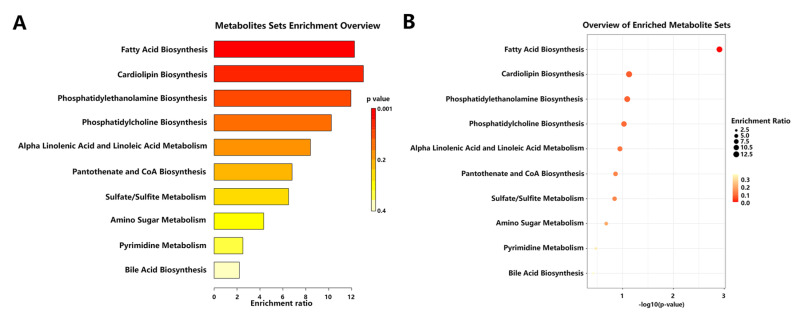
Inulin may be a promising therapeutic molecule for treating non-alcoholic fatty liver disease (NAFLD). However, the underlying mechanisms of its therapeutic activity remain unclear. To address this issue, a high-fat-diet-induced NAFLD mouse model was developed and treated with inulin. The NAFLD phenotype was evaluated via histopathological analysis and biochemical parameters, including serum levels of alanine aminotransferase, aspartate aminotransferase, liver triglycerides, etc. A serum metabolomics study was conducted using ultra-performance liquid chromatography coupled with tandem mass spectrometry. The results revealed that inulin mitigated NAFLD symptoms such as histopathological changes and liver cholesterol levels. Through the serum metabolomics study, 347 differential metabolites were identified between the model and control groups, and 139 differential metabolites were identified between the inulin and model groups. Additionally, 48 differential metabolites (such as phosphatidylserine, dihomo-γ-linolenic acid, L-carnitine, and 13-HODE) were identified as candidate targets of inulin and subjected to pathway enrichment analysis. The results revealed that these 48 differential metabolites were enriched in several metabolic pathways such as fatty acid biosynthesis and cardiolipin biosynthesis. Taken together, our results suggest that inulin might attenuate NAFLD partially by modulating 48 differential metabolites and their correlated metabolic pathways, constituting information that might help us find novel therapies for NAFLD.
Keywords: inulin; metabolites; metabolomics; non-alcoholic fatty liver disease.
Conflict of interest statement
The authors declare no conflicts of interest.
Figures
Similar articles
-
Inulin may prevent steatosis by suppressing cannabinoid receptor-1 and patatin-like phospholipase-3 expression in liver.Nutrition. 2022 Nov-Dec;103-104:111742. doi: 10.1016/j.nut.2022.111742. Epub 2022 May 23. Nutrition. 2022. PMID: 35908495
-
Metabolic signatures across the full spectrum of non-alcoholic fatty liver disease.JHEP Rep. 2022 Mar 26;4(5):100477. doi: 10.1016/j.jhepr.2022.100477. eCollection 2022 May. JHEP Rep. 2022. PMID: 35434590 Free PMC article.
-
Mass-Spectrometry-Based Serum Metabolomics of a C57BL/6J Mouse Model of High-Fat-Diet-Induced Non-alcoholic Fatty Liver Disease Development.J Agric Food Chem. 2015 Sep 9;63(35):7873-84. doi: 10.1021/acs.jafc.5b02830. Epub 2015 Aug 27. J Agric Food Chem. 2015. PMID: 26262841
-
Untargeted metabonomics reveals intervention effects of chicory polysaccharide in a rat model of non-alcoholic fatty liver disease.Int J Biol Macromol. 2019 May 1;128:363-375. doi: 10.1016/j.ijbiomac.2019.01.141. Epub 2019 Jan 25. Int J Biol Macromol. 2019. PMID: 30690116
-
Liver Metabolomics Analysis Revealing Key Metabolites Associated with Different Stages of Nonalcoholic Fatty Liver Disease in Hamsters.Comb Chem High Throughput Screen. 2024;27(9):1303-1317. doi: 10.2174/0113862073238503230924180432. Comb Chem High Throughput Screen. 2024. PMID: 37859316
Cited by
-
Efect of N-acetylcysteine on HepG2 cells which were induced into fatty liver cells.J Mol Histol. 2024 Dec 4;56(1):27. doi: 10.1007/s10735-024-10313-2. J Mol Histol. 2024. PMID: 39630170
References
-
- Pouwels S., Sakran N., Graham Y., Leal A., Pintar T., Yang W., Kassir R., Singhal R., Mahawar K., Ramnarain D. Non-alcoholic fatty liver disease (NAFLD): A review of pathophysiology, clinical management and effects of weight loss. BMC Endocr. Disord. 2022;22:63. doi: 10.1186/s12902-022-00980-1. - DOI - PMC - PubMed
LinkOut - more resources
Full Text Sources
