

Wetsuit Thermal Resistivity Measurements
- PMID: 39065958
- PMCID: PMC11280750
- DOI: 10.3390/s24144561
Wetsuit Thermal Resistivity Measurements
Abstract
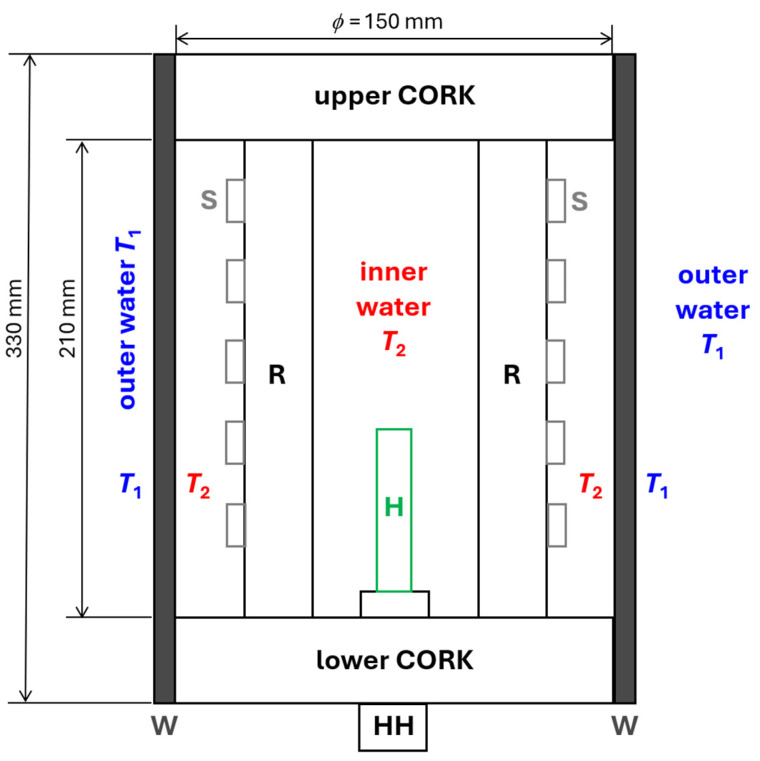
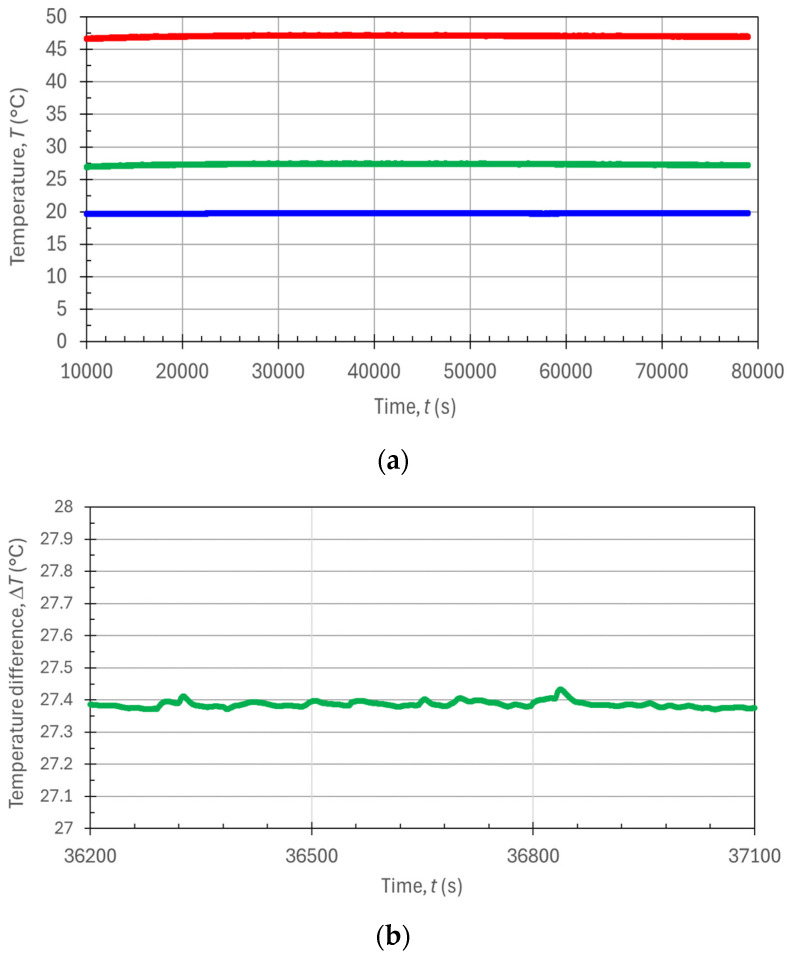
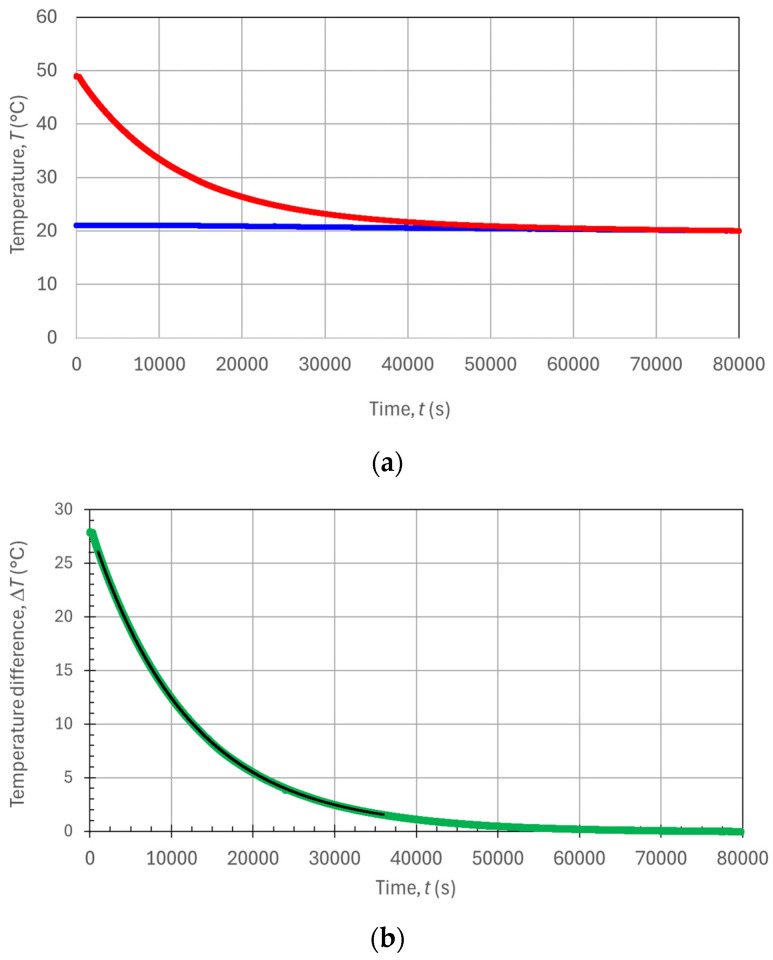
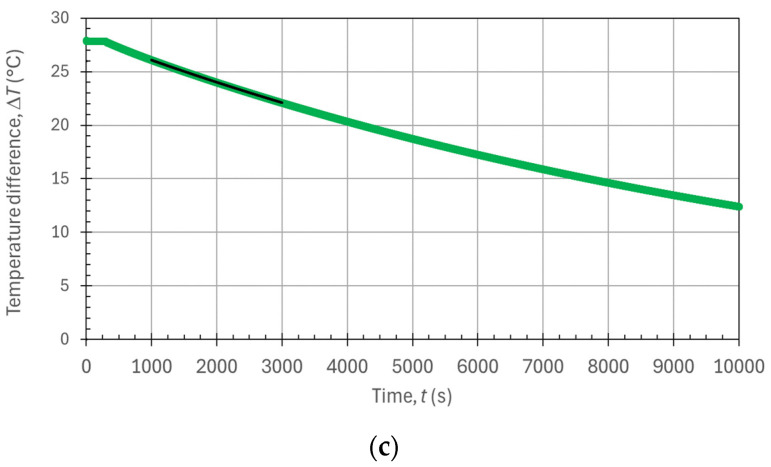
In recent years, attention to the realization and characterization of wetsuits for scuba diving and other sea sports or activities has increased. The research has aimed to establish reliable and standardized measurement methods to objectively assess wetsuit quality, particularly focusing on their mechanical and thermal properties. In this work, we describe and compare two different measurement methods for the characterization of neoprene wetsuit thermal resistivity. The first method follows the existing regulations in the field, while the second one, which we are originally proposing in this paper, offers an alternative yet accurate way based on a simplified experimental set-up and easier measurements. In both cases, the wetsuit sample under testing was shaped in the form of a cylindrical sleeve of proper dimensions and wrapped around a phantom containing water at a higher temperature and surrounded by water at a lower temperature. The wetsuit's cylindrical surface allows heat flow from the warmer water on the inside to the colder water on the outside through the wetsuit area. In the first case, a thermal steady state was achieved, with constant heat flow from the phantom to the exterior. This was obtained with a power balance between two homogenous quantities. Electrically supplied thermal heating within the phantom was used to balance the thermal energy naturally flowing through the wetsuit's surface. In this first case, a stable and fixed temperature difference was obtained between the inner and the outer surfaces of the wetsuit sample. In the second case, a thermal transient was analyzed during the cooling process of the phantom, and the thermal time constant was measured, providing the sample thermal resistance once the phantom thermal capacity was known. In both cases and methods, the heat flow and thermal resistance of other elements than the wetsuit must be evaluated and compensated for if they are not negligible. Finally, the thermal resistivity per unit area of the wetsuit material was obtained with the product of the wetsuit sample's thermal resistance and the wetsuit area. The measurements, conducted until now by immersing the phantom in a free surface tank, show that both methods-under stationary and under transient temperature conditions-were valid to assess the wetsuit's thermal resistivity. The stationary method somehow provided better accuracy while involving less well-known parameters but at the expense of a more complicated experimental set-up and additional energy consumption. The transitory method, on the other hand, is quite easy to implement and, after careful characterization of the phantom's parameters, it provided similar results to the stationary one. An uncertainty budget was evaluated for both methods, and they did provide highly compatible measurement results, with resistivity values of 0.104(9) m2·K/W (stationary method) and 0.095(9) K·m2/W (transient method) for the same wetsuit sample under testing, which is also consistent with the values in the literature. We finally propose that the novel method is a valid alternative for characterization of the thermal insulation properties of a scuba diving wetsuit.
Keywords: material characterization; measurement methods; neoprene; static and dynamic measurement; thermal conductivity; thermal resistivity; thermal transient; wetsuit.
Conflict of interest statement
The authors declare no conflicts of interest.
Figures
References
-
- Allen T., Foster L., Strangwood M., Webster J. Sports Materials Special Issue Editorial. Appl. Sci. 2019;24:5272. doi: 10.3390/app9245272. - DOI
-
- Naebe M., Robins N., Wang X., Collins P. Assessment of performance properties of wetsuits. Proc. Inst. Mech. Eng. Part P J. Sports Eng. Technol. 2013;227:255. doi: 10.1177/1754337113481967. - DOI
-
- Market Report Diving Suit Global Market Insights 2023, Analysis and Forecast to 2028, by Manufacturers, Regions, Technology, Application, Product Type. July 2023, 154p. [(accessed on 15 May 2024)]. Available online: https://www.researchandmarkets.com/report/diving-suits.
LinkOut - more resources
Full Text Sources
