. 2024 Jun 26;16(7):1027.
doi: 10.3390/v16071027.

Chandipura Virus Forms Cytoplasmic Inclusion Bodies through Phase Separation and Proviral Association of Cellular Protein Kinase R and Stress Granule Protein TIA-1

Affiliations

Chandipura Virus Forms Cytoplasmic Inclusion Bodies through Phase Separation and Proviral Association of Cellular Protein Kinase R and Stress Granule Protein TIA-1

Sharmistha Sarkar et al. Viruses. .

Abstract

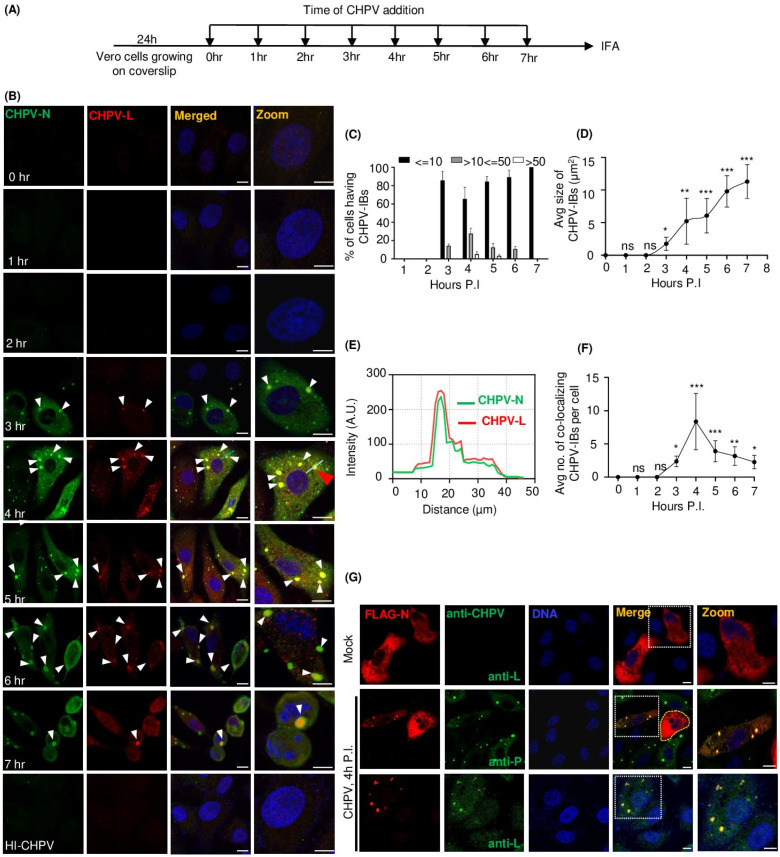
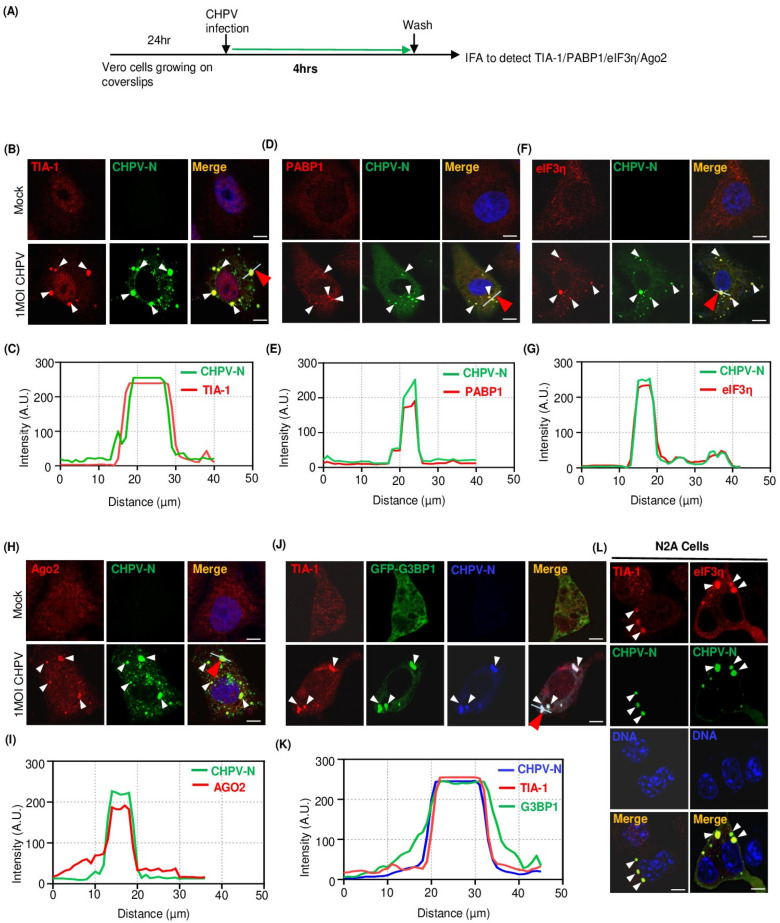
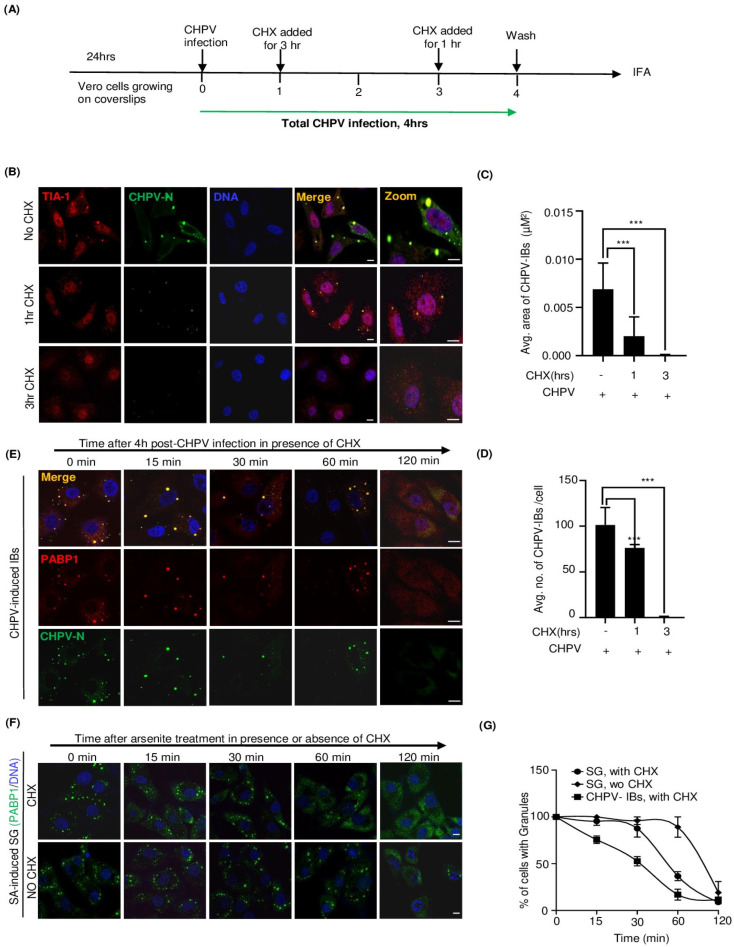
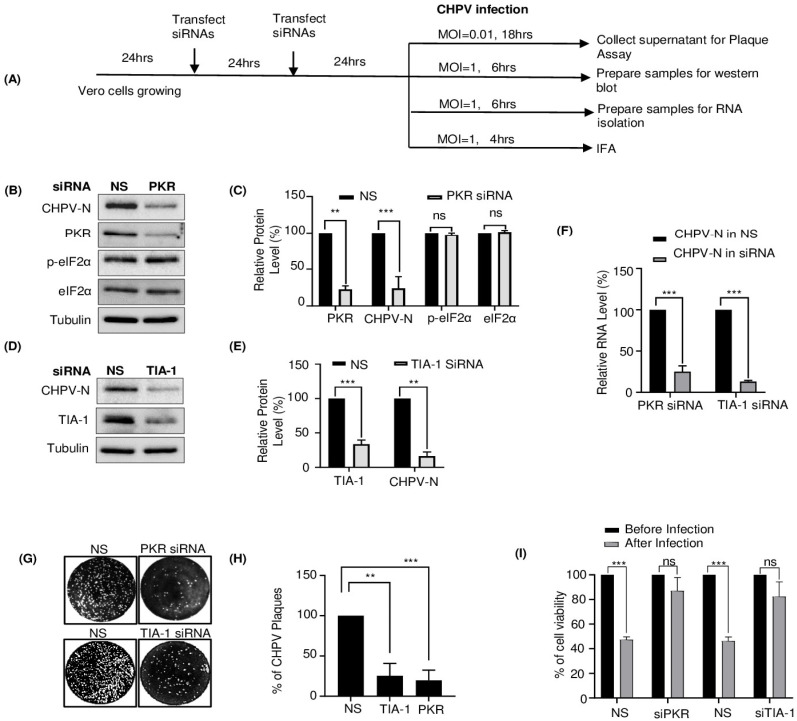
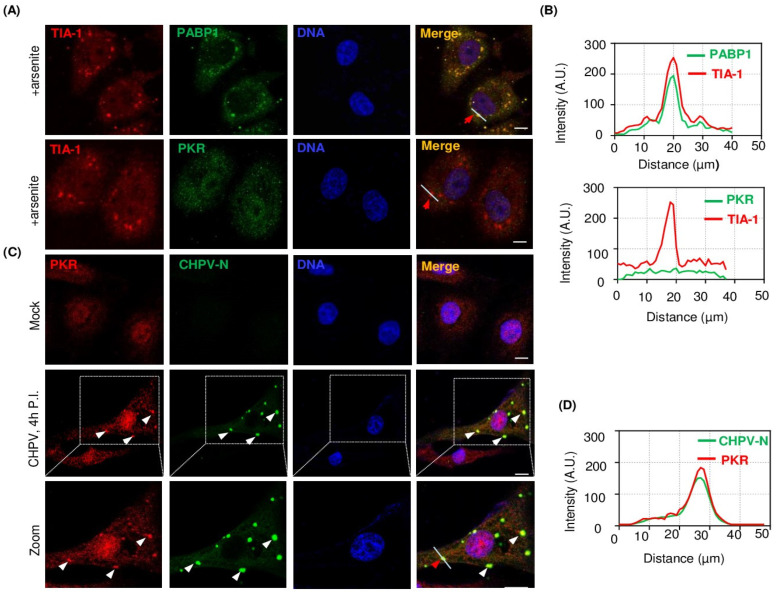
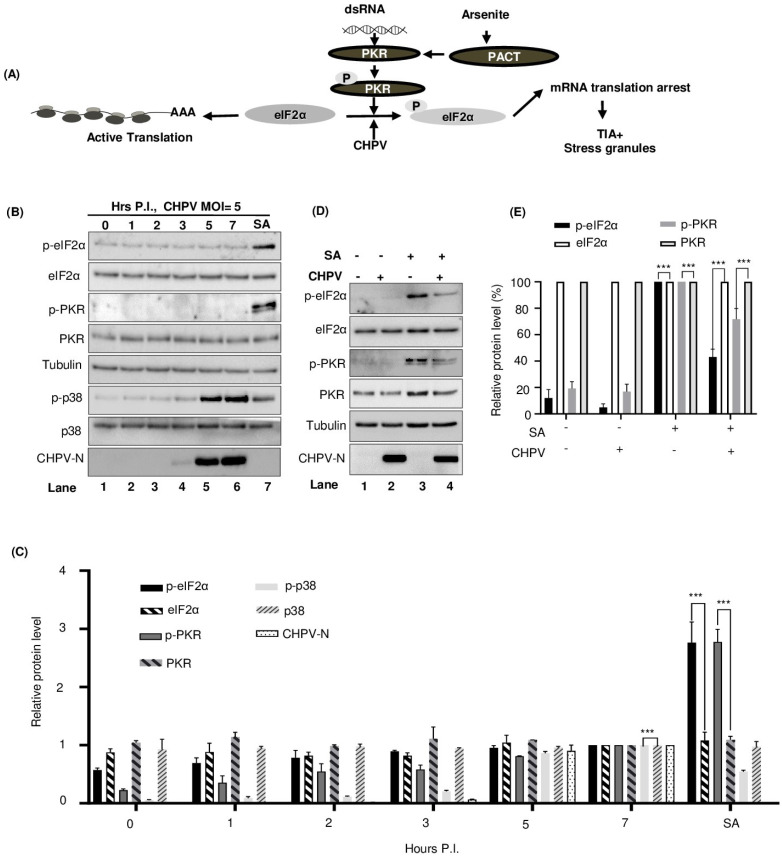
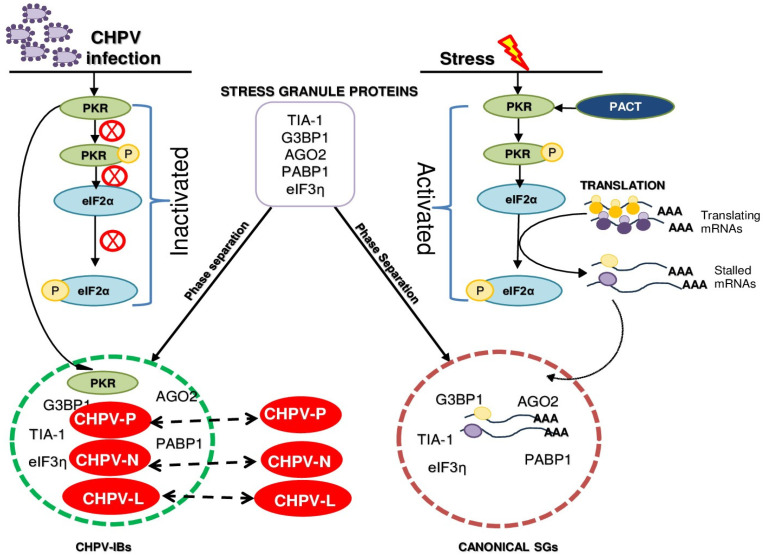
Negative-strand RNA viruses form cytoplasmic inclusion bodies (IBs) representing virus replication foci through phase separation or biomolecular condensation of viral and cellular proteins, as a hallmark of their infection. Alternatively, mammalian cells form stalled mRNA containing antiviral stress granules (SGs), as a consequence of phosphorylation of eukaryotic initiation factor 2α (eIF2α) through condensation of several RNA-binding proteins including TIA-1. Whether and how Chandipura virus (CHPV), an emerging human pathogen causing influenza-like illness, coma and death, forms IBs and evades antiviral SGs remain unknown. By confocal imaging on CHPV-infected Vero-E6 cells, we found that CHPV infection does not induce formation of distinct canonical SGs. Instead, CHPV proteins condense and co-localize together with SG proteins to form heterogeneous IBs, which ensued independent of the activation of eIF2α and eIF2α kinase, protein kinase R (PKR). Interestingly, siRNA-mediated depletion of PKR or TIA-1 significantly decreased viral transcription and virion production. Moreover, CHPV infection also caused condensation and recruitment of PKR to IBs. Compared to SGs, IBs exhibited significant rapidity in disassembly dynamics. Altogether, our study demonstrating that CHPV replication co-optimizes with SG proteins and revealing an unprecedented proviral role of TIA-1/PKR may have implications in understanding the mechanisms regulating CHPV-IB formation and designing antiviral therapeutics. Importance: CHPV is an emerging tropical pathogen reported to cause acute influenza-like illness and encephalitis in children with a very high mortality rate of ~70%. Lack of vaccines and an effective therapy against CHPV makes it a potent pathogen for causing an epidemic in tropical parts of globe. Given these forewarnings, it is of paramount importance that CHPV biology must be understood comprehensively. Targeting of host factors offers several advantages over targeting the viral components due to the generally higher mutation rate in the viral genome. In this study, we aimed at understanding the role of SGs forming cellular RNA-binding proteins in CHPV replication. Our study helps understand participation of cellular factors in CHPV replication and could help develop effective therapeutics against the virus.

Keywords: Chandipura virus; inclusion bodies; phase separation; protein kinase R; stress granules.


Conflict of interest statement

The authors declare no conflict of interest.

Figures

Figure 1
Figure 1
CHPV proteins condense and co-localize together to form cytoplasmic IBs in infected cells. (A) Outline of experimental design for the time course of CHPV infection in Vero cells grown on coverslips at the indicated time and infected cells were collected at the same time for further fixation and immunostaining. (B) Time course of CHPV infection. Vero cells were infected either with 5 MOI live CHPV for the indicated time or with heat-inactivated (56 °C/20 min) CHPV (HI-CHPV) for 7 h. Cells were fixed and co-immunostained for CHPV-N and CHPV-L using specific antibodies. The nuclei were counterstained with Hoechst dye. In the image, white arrows indicate CHPV puncta and red arrow indicate the punctate selected for line scan analysis. Scale bar = 10 µm. (C) Bar graph showing percentage of cells in (B) with less than or equal to ten (≤10), more than ten but less than or equal to fifty (>10≤50) or more than fifty (>50) CHPV-N puncta at each time point. The error bars represent SD from three independent experiments. ** p < 0.01 in Student’s t-test. (D) Graphical representation of the average size of CHPV-N puncta over the course of infection. CHPV-N puncta from at least 25 cells from each time point of infection were measured using ImageJ. The error bars represent SD from three independent experiments. p < 0.5 (*), p < 0.01 (**), p < 0.001 (***) in Student’s t-test. (E) The line scan analysis for the distribution of signal intensities for CHPV-N and CHPV-L over drawn line (shown by red arrowhead) in panel (B) (red arrow) using the ImageJ (version 1.53e) software. AU, arbitrary units. (F) Graph representing average no. co-localizing CHPV-IBs over the time course of CHPV infection calculated using ImageJ (n > 35 cells). The error bars represent SD from three independent experiments. p < 0.5 (*), p < 0.001 (***) in Student’s t-test. (G) CHPV-infection dependent condensation and co-localization of CHPV proteins. Vero cells were transfected with pFlagCMV6a-CHPV-N and 24 h later infected with 5 MOI CHPV. The cells were further co-immunostained for the detection of FLAG-tagged CHPV-N (using anti-FLAG) in combination with anti-P antibody or anti-L antibody for detection of phosphoprotein and L protein expressed during CHPV infection. Selected cells separated by dashed white borderlines from all three panels are shown as zoomed-in images. In the middle panel, CHPV-infected cells are separated by dashed white borderlines and uninfected cells outlined by yellow dashed lines. The nuclei were counterstained with Hoechst dye. Scale bar = 10 µm.
Figure 2
Figure 2
Multiple cellular SGPs associate with CHPV-IBs. (A) Outline of the experimental design for detection of SGPs in CHPV-infected cells. Vero cells grown on coverslips were infected with 1 MOI CHPV for 4 h and then processed for IFA to detect CHPV-N in combination with SGP using specific antibodies. (BI) CHPV-IBs co-localize with endogenous SGPs (TIA-1, PABP1, eIF3η and Ago2). Vero cells were infected with 1 MOI CHPV for 4 h. Cells were then fixed with 4% PFA and immunostained for detection of endogenous markers. TIA-1 (red) in (B), PABP1 (red) in (D), eIF3η (red) in (F) and Ago2 (red) in (H) were detected along with CHPV-N (green) using specific antibodies. Graphical representations in (C,E,G,I) show the distribution of signal intensities across the line drawn across the CHPV-IB indicated with red arrow for each SGP and CHPV-N from panels (B,D,F,H) using the Image J software. AU, arbitrary units. The nuclei were counterstained with Hoechst stain. Scale bar = 10 µm. (J,K) Ectopic expression and co-localization of GFP-G3BP1 with CHPV-IBs. Vero cells transfected with GFP-G3BP1 or GFP alone (Figure S2D) expressing vector for 24 h were infected with 5 MOI CHPV for 4 h. The cells were stained for TIA-1 (red) and CHPV-N (blue) using their respective antibodies. Graphical representation in (K) shows the distribution of signal intensities of the line drawn across the CHPV-IB indicated with red arrow for GFP-G3BP1, TIA-1 and CHPV-N over selected cell from panel J) using the Image J software. AU, arbitrary units. Scale bar = 10 µm. (L) CHPV-IBs co-localize with endogenous SGPs in N2A cells. N2A cells were infected with 5 MOI CHPV for 4 h. The cells were then fixed with 4% PFA and immunostained for TIA-1 (red), eIF3η (red) and CHPV-N (green) using their respective antibodies. The nuclei were counterstained with Hoechst stain. Scale bar = 10 µm.
Figure 3
Figure 3
Cycloheximide (CHX) treatment reduces the size and number of CHPV-IBs. (A) The schematic shows outline of experimental design. Vero cells grown on coverslips were infected with CHPV 5 MOI for 4 h. CHX was added to cells at the indicated times for 3 h and 1 h treatment, respectively. (BD) CHPV-IBs are sensitive to CHX treatment. Vero cells were infected with CHPV (5 MOI) either in the absence or presence of CHX (50 μg/mL) for 1 h and 3 h as shown in (A). After completion of 4 h of infection, cells were fixed with 4% PFA and immunostained for TIA-1 (red) and CHPV-N (green). The nuclei were counterstained with Hoechst dye. Scale bar = 10 µm. (C,D) Graphical representation of the number (C) and size (D) of CHPV-IBs with CHX treatment. p < 0.001 (***) in Student’s t-test. (E,F) Comparison of kinetics of CHPV-IB and SG disassembly upon CHX treatment. Vero cells were either infected with 5 MOI CHPV for 4 h (E) to induce IBs or treated with 1 mM SA for 40 min to induce SG (F). In both (E) and (F), cells were either left untreated or subsequently treated with CHX (50 μg/mL) for 15 min, 30 min, 1 h and 2 h to compare the dynamics of SG and IB disassembly. The cells were then fixed and co-immunostained for CHPV-N and PABP1. The nuclei were counterstained with Hoechst dye. Scale bar = 10 µm. (G) Graph showing comparison between the CHPV-IBs and canonical SGs with respect to their kinetics of disassembly in the presence of CHX. Untreated SGs without CHX served as a control.
Figure 4
Figure 4
Silencing of TIA-1 or PKR expression decreases CHPV production. (A) Outline of experimental design for siRNA transfection following CHPV infection in Vero cells. After siRNA transfections (twice after an interval of 24 h), cells were equally divided into 4 sets. Each set was infected with the indicated MOI of CHPV for the indicated time for further detection of virions by plaque assay and quantification of viral RNA by qPCR and viral protein by Western blotting or IFA. (B) Western blot detection of PKR, CHPV-N, p-eIF2α, eIF2α and tubulin in CHPV-infected (1 MOI, 6 h) Vero cells after siRNA-mediated silencing of PKR expression. (C) Graphical representation of the relative amount of PKR, CHPV-N, p-eIF2α and eIF2α. The relative intensity of each protein band in PKR siRNA sample, after normalizing to tubulin, was calculated over that of the NS (Non-Specific) siRNA control. The error bar indicates mean ± SD (n = 3). p < 0.01 (**), p < 0.001 (***), ns = not-significant in Student’s t-test. (D) Western blot detection of TIA-1, CHPV-N and tubulin in CHPV-infected (1 MOI, 6 h) Vero cells after siRNA-mediated silencing of TIA-1 expression. (E) Graphical representation of the relative amount of TIA-1 and CHPV-N. The relative intensity of each protein band in TIA-1 siRNA sample, after normalizing to tubulin, was calculated over that of the NS siRNA control. The error bar indicates mean ± SD (n = 3). p < 0.01 (**), p < 0.001 (***), ns = not-significant in Student’s t-test. (F) Graphical representation of the relative amount of CHPV-N mRNA in CHPV-infected (1MOI, 6 h) Vero cells after siRNA-mediated silencing of PKR/TIA-1 as compared to that in NS siRNA control. The error bars indicate mean ± SD (n = 3). p < 0.01 (**), p < 0.001 (***), ns = not-significant in Student’s t-test. (G) Analysis of CHPV virion production after siRNA knockdown of PKR or TIA-1. As shown in (A), siRNA-transfected Vero cells were infected with CHPV (0.01 MOI) and allowed to replicate CHPV for 18 h. Cell culture supernatants obtained from the infected cells were used for plaque assay as described in Material and Methods. (H) Graphical representation of the quantification of plaques obtained in (F). Cells were fixed and stained with crystal violet at 18 h P.I., as described in Material and Methods. The error bar indicates mean ± SD (n = 3). p < 0.01 (**), p < 0.001 (***), ns = not-significant in Student’s t-test. (I) Graphical representation of the quantification of cell viability before/after CHPV infection (1 MOI, 6 h) in Vero cells after siRNA-mediated silencing of PKR/TIA-1 as compared to that in NS siRNA control. The error bars indicate mean ± SD (n = 3). p < 0.01 (**), p < 0.001 (***), ns = not-significant in Student’s t-test.
Figure 5
Figure 5
PKR associates with CHPV-IBs but not with SGs. (A) Vero cells were treated with 1 mM SA for 40 min to induce SGs. Later, cells were fixed with 4% PFA and processed for IFA to detect TIA-1/PABP1 or TIA-1/PKR for SGs. White arrows indicate CHPV-IBs. The nuclei were counterstained with Hoechst dye. Scale bar = 10 µm. (B) Graphical representations of the intensity plot across the line drawn in the images (A: upper and lower panels of SGs) for individual measurements in arbitrary units (AU) shown after normalization to maximum intensities using ImageJ software. (C) Vero cells were infected by CHPV 1 MOI for 4 h to induce IBs. Cells were fixed with 4% PFA and then processed for IFA to detect CHPV-N/PKR for CHPV-IBs. The nuclei were counterstained with Hoechst dye. Scale bar = 10 µm. (D) Graphical representations of the intensity plot across the line drawn across the CHPV-IB indicated with red arrow in the images ((C): lower panel of CHPV-IBs) for individual measurements in arbitrary units (AU) shown after normalization to maximum intensities using ImageJ software.
Figure 6
Figure 6
CHPV infection induces p38 phosphorylation but does not phosphorylate PKR/eIF2α. (A) Schematic diagram showing the cellular pathway p-PKR/p-eIF2α/SG governing SG formation. PKR direct activation by dsRNA or indirectly by SA through PACT is shown. (B) Kinetics of p38 activation with no change in p-PKR/p-eIF2α. Vero cells were infected with CHPV (5 MOI) for the indicated time. The phosphorylated forms of eIF2α (p-eIF2α, Ser51), PKR (p-PKR) and p38 (p-p38) were measured by Western blot analysis using phospho-specific antibodies. Total level of these kinases was determined by a pan-antibody. Tubulin served as a loading control. (C) Graphical representation of the relative amount of p-eIF2α, eIF2α, p-PKR, PKR, p-p38 and p38 protein in each sample after normalizing to tubulin was plotted over the time when the sample was collected (6B) with the protein level in lane 6 (7 h of CHPV infection) set as 1. The error bar indicates mean ± SD (n = 3). p < 0.001 (***) in Student’s t-test. (D,E) CHPV infection inhibits SA-induced eIF2α phosphorylation. Vero cells with or without CHPV infection were left untreated or treated with 0.5 mM SA for 30 min before cell lysate preparation for Western blotting with corresponding antibodies. CHPV-N was blotted as an indication for viral infection. (E) Relative amount of p-eIF2α, total eIF2α, p-PKR and total PKR in each sample after normalizing to tubulin was measured and plotted in bar graphs for comparison, with each protein level in lane 3 being set to 100%. The error bar indicates mean ± SD (n = 3). p < 0.001 (***) in Student’s t-test.
Figure 7
Figure 7
A schematic model showing distinctness in the process of SG and CHPV-IB formation. In this model, CHPV proteins (N, P and L) in the cytoplasm condense and co-localize together in association with other viral proteins, cellular SG proteins and PKR to form CHPV-IBs. In contrast to formation of SGs, IBs form independent of the activation of PKR/eIF2α phosphorylation.

References

    1. Basak S., Mondal A., Polley S., Mukhopadhyay S., Chattopadhyay D. Reviewing Chandipura: A vesiculovirus in human epidemics. Biosci. Rep. 2007;27:275–298. doi: 10.1007/s10540-007-9054-z. - DOI - PMC - PubMed
    1. Rao B.L., Basu A., Wairagkar N.S., Gore M.M., Arankalle V.A., Thakare J.P., Jadi R.S., Rao K.A., Mishra A.C. A large outbreak of acute encephalitis with high fatality rate in children in Andhra Pradesh, India, in 2003, associated with Chandipura virus. Lancet. 2004;364:869–874. doi: 10.1016/S0140-6736(04)16982-1. - DOI - PMC - PubMed
    1. Menghani S., Chikhale R., Raval A., Wadibhasme P., Khedekar P. Chandipura Virus: An emerging tropical pathogen. Acta Trop. 2012;124:1–14. doi: 10.1016/j.actatropica.2012.06.001. - DOI - PubMed
    1. John T.J. Chandipura virus, encephalitis, and epidemic brain attack in India. Lancet. 2004;364:2175. doi: 10.1016/S0140-6736(04)17579-X. - DOI - PubMed
    1. Sharma N.R., Gadhave K., Kumar P., Saif M., Khan M.M., Sarkar D.P., Uversky V.N., Giri R. Analysis of the dark proteome of Chandipura virus reveals maximum propensity for intrinsic disorder in phosphoprotein. Sci. Rep. 2021;11:13253. doi: 10.1038/s41598-021-92581-6. - DOI - PMC - PubMed

Publication types

LinkOut - more resources