. 2024 Jun 27;16(7):1036.
doi: 10.3390/v16071036.

Elevated Inflammation Associated with Markers of Neutrophil Function and Gastrointestinal Disruption in Pilot Study of Plasmodium fragile Co-Infection of ART-Treated SIVmac239+ Rhesus Macaques

Affiliations

Elevated Inflammation Associated with Markers of Neutrophil Function and Gastrointestinal Disruption in Pilot Study of Plasmodium fragile Co-Infection of ART-Treated SIVmac239+ Rhesus Macaques

Sydney M Nemphos et al. Viruses. .

Abstract

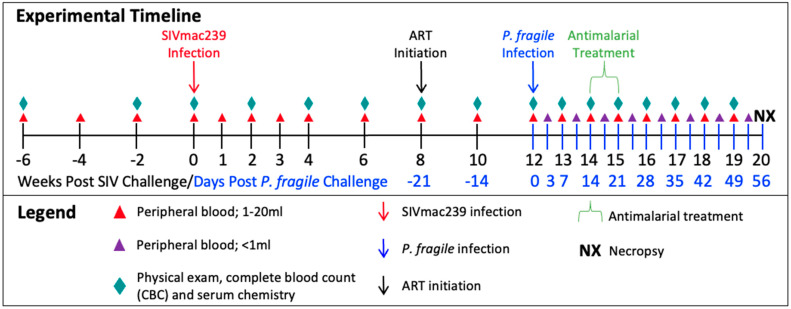
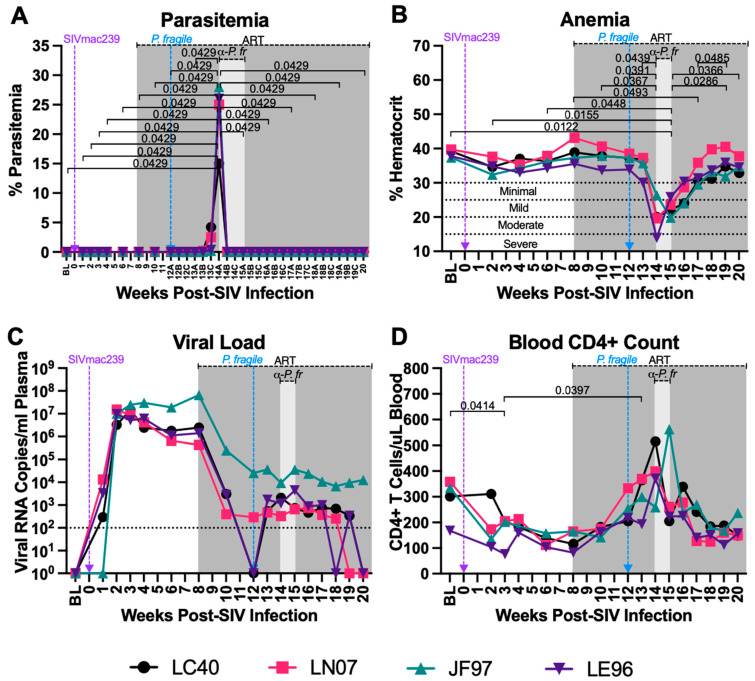
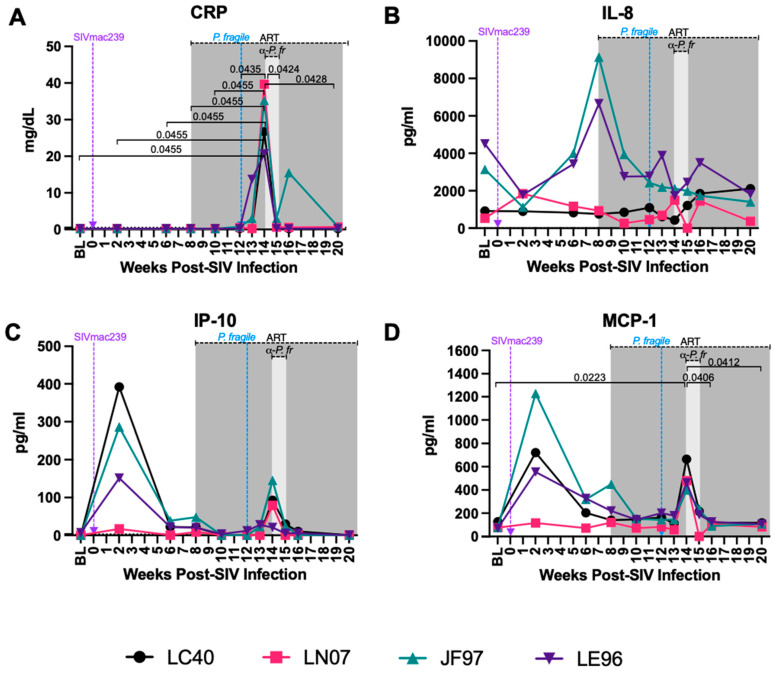
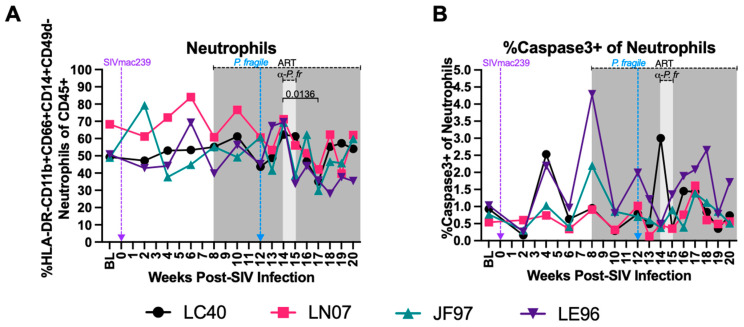
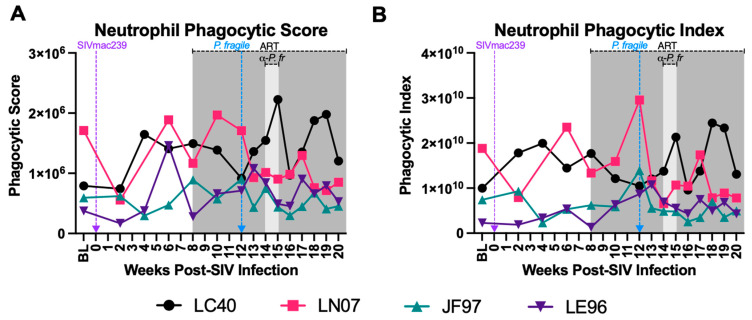
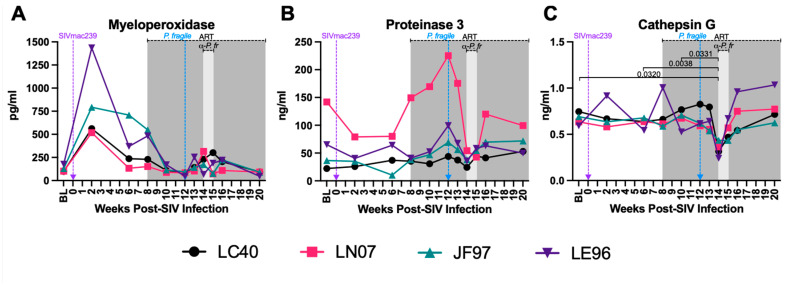
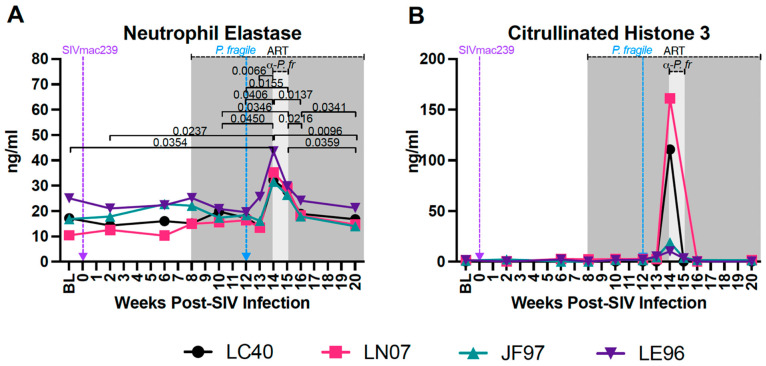
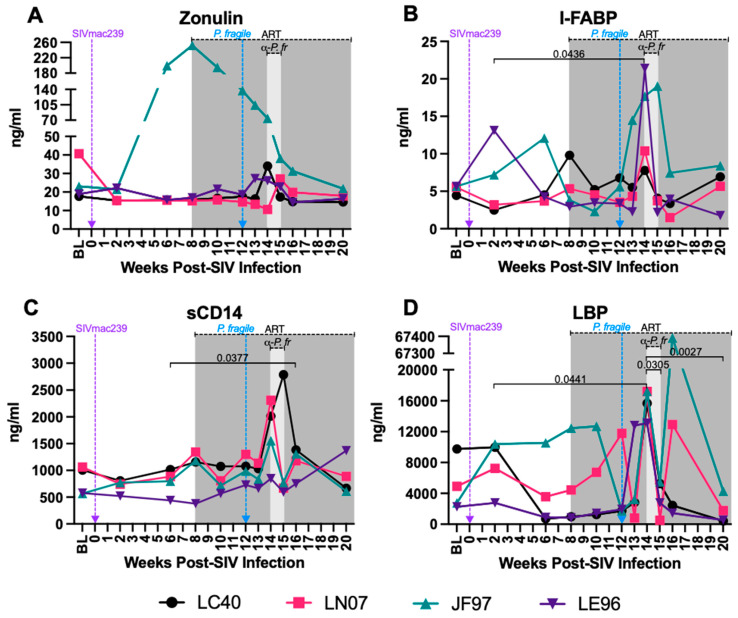
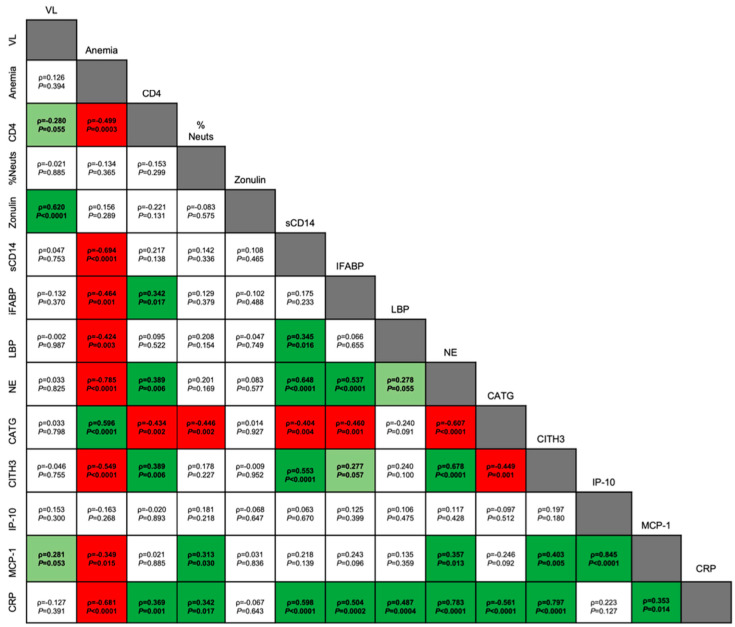
Human immunodeficiency virus (HIV) and malaria, caused by infection with Plasmodium spp., are endemic in similar geographical locations. As a result, there is high potential for HIV/Plasmodium co-infection, which increases the pathology of both diseases. However, the immunological mechanisms underlying the exacerbated disease pathology observed in co-infected individuals are poorly understood. Moreover, there is limited data available on the impact of Plasmodium co-infection on antiretroviral (ART)-treated HIV infection. Here, we used the rhesus macaque (RM) model to conduct a pilot study to establish a model of Plasmodium fragile co-infection during ART-treated simian immunodeficiency virus (SIV) infection, and to begin to characterize the immunopathogenic effect of co-infection in the context of ART. We observed that P. fragile co-infection resulted in parasitemia and anemia, as well as persistently detectable viral loads (VLs) and decreased absolute CD4+ T-cell counts despite daily ART treatment. Notably, P. fragile co-infection was associated with increased levels of inflammatory cytokines, including monocyte chemoattractant protein 1 (MCP-1). P. fragile co-infection was also associated with increased levels of neutrophil elastase, a plasma marker of neutrophil extracellular trap (NET) formation, but significant decreases in markers of neutrophil degranulation, potentially indicating a shift in the neutrophil functionality during co-infection. Finally, we characterized the levels of plasma markers of gastrointestinal (GI) barrier permeability and microbial translocation and observed significant correlations between indicators of GI dysfunction, clinical markers of SIV and Plasmodium infection, and neutrophil frequency and function. Taken together, these pilot data verify the utility of using the RM model to examine ART-treated SIV/P. fragile co-infection, and indicate that neutrophil-driven inflammation and GI dysfunction may underlie heightened SIV/P. fragile co-infection pathogenesis.

Keywords: Plasmodium fragile; co-infection; immunology; malaria; neutrophils; nonhuman primate; simian immunodeficiency virus.


Conflict of interest statement

The authors declare no conflicts of interest.

Figures

Figure 1
Figure 1
Experimental timeline depicting sample collection from adult, male rhesus macaques (RMs) (n = 4). RMs were inoculated with SIVmac239, TCID50 = 50, intravenously (i.v.) at week 0. Daily antiretroviral treatment (ART) was given subcutaneously, beginning at week 8, and continued until the end of the study (TDF/FTC/DTG; 5.1/30/2.5 mg/kg). RMs were inoculated with Plasmodium fragile, 20 × 106-infected erythrocytes, via i.v. Antimalaria treatment occurred over one week, at week 14, and consisted of one oral gavage of quinine sulfate (150 mg) followed by four daily oral gavages of chloroquine (20 mg/kg).
Figure 2
Figure 2
P. fragile co-infection results in clinical signs of SIV infection despite persistent, daily ART. Peripheral P. fragile parasitemia, anemia, SIVmac239 peripheral-blood viral loads (VLs), and blood CD4+ T-cell counts were assessed in adult, male rhesus macaques (RMs) (n = 4). (A) Following P. fragile inoculation at week 12 post-SIV infection (p.i.), parasitemia was assessed tri-weekly, indicated as weeks A, B, and C p.i. % Parasitemia was assessed via Giemsa staining of thin blood smears and was defined as the percentage of erythrocytes infected by a parasite among all erythrocytes. (B) Anemia was assessed by characterizing % hematocrit, defined as the ratio of red blood cells to total blood. (C) Plasma VLs (RNA copies/milliliter plasma) were assessed by qPCR. (D) Absolute number of CD4+ T cells per microliter of blood was assessed via flow cytometry. In all panels, each RM is represented by a different symbol and color. Baseline (BL) is the average of data collected at weeks 6, 4, 2, and 0 p.i.. Inoculation with SIVmac239 at week 0 p.i. is indicated by a purple dashed arrow. Inoculation with P. fragile at week 12 p.i. is indicated by a blue dashed arrow. Antiretroviral therapy (ART) was initiated at week 8 p.i., indicated by the dark-grey bar. Antimalarial treatment occurred throughout week 14 p.i., indicated by the light-grey bar. Statistical significance between all timepoints was calculated using a mixed-effects analysis with the Geisser–Greenhouse correction and a Tukey’s multiple-comparison test, with individual variances computed for each comparison. Significant multiplicity-adjusted p values are shown above horizontal black bars.
Figure 3
Figure 3
Variable levels of inflammatory markers throughout P. fragile co-infection of ART-treated SIVmac239-infected rhesus macaques. CRP, cytokine, and chemokine levels were measured throughout P. fragile co-infection of ART-treated SIVmac239-infected rhesus macaques (RMs) (n = 4). (A) CRP levels were measured in serum by a Beckman au480. (BD) IL-8 (B), IP-10 (C), and MCP-1 (D) levels were measured in plasma by LegendPlex. In all panels, each RM is represented by a different symbol and color. Baseline (BL) is the average of data collected at weeks 6, 2, and 0 post-SIV infection (p.i.). Inoculation with SIVmac239 at week 0 p.i. is indicated by a purple dashed arrow. Inoculation with P. fragile at week 12 p.i. is indicated by a blue dashed arrow. Antiretroviral therapy (ART) was initiated at week 8 p.i., indicated by the dark-grey bar. Antimalarial treatment occurred throughout week 14 p.i., indicated by the light-grey bar. Statistical significance between all timepoints was calculated using a mixed-effects analysis with the Geisser–Greenhouse correction and a Tukey’s multiple-comparison test, with individual variances computed for each comparison. Significant multiplicity-adjusted p values are shown above horizontal black bars.
Figure 4
Figure 4
Minimal disruption of peripheral neutrophil frequencies and percentages of neutrophils undergoing apoptosis during P. fragile co-infection of ART-treated SIVmac239-infected rhesus macaques. Total neutrophil frequencies and frequencies of neutrophils undergoing apoptosis were assessed in whole blood before and after P. fragile co-infection of ART-treated SIVmac239-infected rhesus macaques (RMs) (n = 4) by flow cytometry. (A) Neutrophil (HLA-DR-CD11b+CD66abce+CD14+) frequency of live CD45+ cells was assessed throughout co-infection. (B) The frequency of neutrophils undergoing apoptosis (caspase3+) was assessed throughout co-infection. In both panels, each RM is represented by a different symbol and color. Baseline (BL) is the average of data collected at weeks 6, 4, 2, and 0 post-SIV infection (p.i.). Inoculation with SIVmac239 at week 0 p.i. is indicated by a purple dashed arrow. Inoculation with P. fragile at week 12 p.i. is indicated by a blue dashed arrow. Antiretroviral therapy (ART) was initiated at week 8 p.i., indicated by the dark-grey bar. Antimalarial treatment occurred throughout week 14 p.i., indicated by the light-grey bar. Statistical significance between all timepoints was calculated using a mixed-effects analysis with the Geisser–Greenhouse correction and a Tukey’s multiple-comparison test, with individual variances computed for each comparison. Significant multiplicity-adjusted p values are shown above horizontal black bars.
Figure 5
Figure 5
Nominal alterations in neutrophil phagocytosis during P. fragile co-infection of ART-treated SIVmac239-infected rhesus macaques. The frequency of phagocytic neutrophils and neutrophil phagocytic capacity were assessed in whole blood throughout P. fragile co-infection of ART-treated SIVmac239-infected rhesus macaques (RMs) (n = 4) by flow cytometry. Phagocytosis was determined by assessing the uptake of pHrodo Red E. coli bioparticles. (A) Neutrophil phagocytic score was calculated by multiplying the absolute number of neutrophils/microliter of whole blood by the percentage of neutrophils positive for the uptake of pHrodo bioparticles. (B) Phagocytic index was calculated by multiplying the phagocytic score in (A) by the Mean Fluorescence Intensity (MFI) of pHrodo-positive neutrophils. In both panels, each RM is represented by a different symbol and color. Baseline (BL) is the average of data collected at weeks 6, 4, 2, and 0 post-SIV infection (p.i.). Inoculation with SIVmac239 at week 0 p.i. is indicated by a purple dashed arrow. Inoculation with P. fragile at week 12 p.i. is indicated by a blue dashed arrow. Antiretroviral therapy (ART) was initiated at week 8 p.i., indicated by the dark-grey bar. Antimalarial treatment occurred throughout week 14 p.i., indicated by the light-grey bar. Statistical significance between all timepoints was calculated using a mixed-effects analysis with the Geisser–Greenhouse correction and a Tukey’s multiple-comparison test, with individual variances computed for each comparison.
Figure 6
Figure 6
Decreased plasma levels of neutrophil degranulation markers during P. fragile co-infection of ART-treated SIVmac239-infected rhesus macaques. Products of neutrophil degranulation were measured throughout P. fragile co-infection of ART-treated SIVmac239-infected rhesus macaques (RMs) (n = 4) via ELISA. Myeloperoxidase (A), Proteinase 3 (B), and Cathepsin G (C) levels were measured in plasma by ELISA. In all panels, each RM is represented by a different symbol and color. Baseline (BL) is the average of data collected at weeks 6, 2, and 0 post-SIV infection (p.i.). Inoculation with SIVmac239 at week 0 p.i. is indicated by a purple dashed arrow. Inoculation with P. fragile at week 12 p.i. is indicated by a blue dashed arrow. Antiretroviral therapy (ART) was initiated at week 8 p.i., indicated by the dark-grey bar. Antimalarial treatment occurred throughout week 14 p.i., indicated by the light-grey bar. Statistical significance between all timepoints was calculated using a mixed-effects analysis with the Geisser–Greenhouse correction and a Tukey’s multiple-comparison test, with individual variances computed for each comparison. Significant multiplicity-adjusted p values are shown above horizontal black bars.
Figure 7
Figure 7
Increased plasma levels of neutrophil extracellular trap markers during P. fragile co-infection of ART-treated SIVmac239-infected rhesus macaques. Markers of neutrophil extracellular trap formation were measured throughout P. fragile co-infection of ART-treated SIVmac239-infected rhesus macaques (RMs) (n = 4) via ELISA. (A) Neutrophil elastase and (B) Citrullinated histone 3 levels were measured in plasma by ELISA. In both panels, each RM is represented by a different symbol and color. Baseline (BL) is the average of data collected at weeks 6, 2, and 0 post-SIV infection (p.i.). Inoculation with SIVmac239 at week 0 p.i. is indicated by a purple dashed arrow. Inoculation with P. fragile at week 12 p.i. is indicated by a blue dashed arrow. Antiretroviral therapy (ART) was initiated at week 8 p.i., indicated by the dark-grey bar. Antimalarial treatment occurred throughout week 14 p.i., indicated by the light-grey bar. Statistical significance between all timepoints was calculated using a mixed-effects analysis with the Geisser–Greenhouse correction and a Tukey’s multiple-comparison test, with individual variances computed for each comparison. Significant multiplicity-adjusted p values are shown above horizontal black bars.
Figure 8
Figure 8
Increased levels of microbial translocation and gastrointestinal (GI) barrier permeability markers during P. fragile co-infection of ART-treated SIVmac239-infected rhesus macaques. Markers of microbial translocation and GI barrier permeability were measured throughout P. fragile co-infection of ART-treated SIVmac239-infected rhesus macaques (RMs) (n = 4) via ELISA. Zonulin (A), intestinal fatty acid-binding protein (I-FABP; B), Soluble CD14 (sCD14; C), and LPS-binding protein (LBP; D) levels were measured in plasma by ELISA. In all panels, each RM is represented by a different symbol and color. Baseline (BL) is the average of data collected at weeks 6, 2, and 0 post-SIV infection (p.i.). Inoculation with SIVmac239 at week 0 p.i. is indicated by a purple dashed arrow. Inoculation with P. fragile at week 12 p.i. is indicated by a blue dashed arrow. Antiretroviral therapy (ART) was initiated at week 8 p.i., indicated by the dark-grey bar. Antimalarial treatment occurred throughout week 14 p.i., indicated by the light-grey bar. Statistical significance between all timepoints was calculated using a mixed-effects analysis with the Geisser–Greenhouse correction and a Tukey’s multiple-comparison test, with individual variances computed for each comparison. Significant multiplicity-adjusted p values are shown above horizontal black bars.
Figure 9
Figure 9
Multivariate ANOVA (MANOVA) reveals significant correlations between clinical markers of SIV and malaria infection, as well as neutrophil frequency and function and peripheral markers of GI dysfunction. Pearson’s partial correlation coefficients were generated using a MANOVA for 14 different parameters (VL; anemia; absolute CD4+ count; peripheral neutrophils; plasma zonulin; sCD4; I-FABP; LBP; NE; cathepsin G; CitH3; IP-10; MCP-1; and CRP). The correlation coefficients were adjusted against animal number. Boxes highlighted in light green represent positive correlations trending towards significance (0.05 < p < 0.07), and boxes highlighted in dark green or red represent statistically significant positive and negative correlations, respectively (p < 0.05).

References

    1. WHO . HIV Data and Statistics 2022. WHO; Geneva, Switzerland: 2022. [(accessed on 11 May 2023)]. Available online: https://www.who.int/teams/global-hiv-hepatitis-and-stis-programmes/hiv/s....
    1. WHO . World Malaria Report 2023. WHO; Geneva, Switzerland: 2023. [(accessed on 12 December 2023)]. Available online: https://www.who.int/publications/i/item/9789240086173.
    1. Tseng A., Seet J., Phillips E.J. The evolution of three decades of antiretroviral therapy: Challenges, triumphs and the promise of the future. Br. J. Clin. Pharmacol. 2015;79:182–194. doi: 10.1111/bcp.12403. - DOI - PMC - PubMed
    1. Finzi D., Blankson J., Siliciano J.D., Margolick J.B., Chadwick K., Pierson T., Smith K., Lisziewicz J., Lori F., Flexner C., et al. Latent infection of CD4+ T cells provides a mechanism for lifelong persistence of HIV-1, even in patients on effective combination therapy. Nat. Med. 1999;5:512–517. doi: 10.1038/8394. - DOI - PubMed
    1. Holkmann Olsen C., Mocroft A., Kirk O., Vella S., Blaxhult A., Clumeck N., Fisher M., Katlama C., Phillips A.N., Lundgren J.D. Interruption of combination antiretroviral therapy and risk of clinical disease progression to AIDS or death. HIV Med. 2007;8:96–104. doi: 10.1111/j.1468-1293.2007.00436.x. - DOI - PubMed

Publication types

MeSH terms