Comparative Study
. 2024 Jun 29;16(7):1052.
doi: 10.3390/v16071052.

Comparative Proteomic Analysis of Huh7 Cells Transfected with Sub-Saharan African Hepatitis B Virus (Sub)genotypes Reveals Potential Oncogenic Factors

Affiliations
Comparative Study

Comparative Proteomic Analysis of Huh7 Cells Transfected with Sub-Saharan African Hepatitis B Virus (Sub)genotypes Reveals Potential Oncogenic Factors

Kiyasha Padarath et al. Viruses. .

Abstract

In sub-Saharan Africa (SSA), the (sub)genotypes A1, D3, and E of the hepatitis B virus (HBV) prevail. Individuals infected with subgenotype A1 have a 4.5-fold increased risk of HCC compared to those infected with other (sub)genotypes. The effect of (sub)genotypes on protein expression and host signalling has not been studied. Mass spectrometry was used to analyse the proteome of Huh7 cells transfected with replication-competent clones. Proteomic analysis revealed significantly differentially expressed proteins between SSA (sub)genotypes. Different (sub)genotypes have the propensity to dysregulate specific host signalling pathways. Subgenotype A1 resulted in dysregulation within the Ras pathway. Ras-associated protein, RhoC, was significantly upregulated in cells transfected with subgenotype A1 compared to those transfected with other (sub)genotypes, on both a proteomic (>1.5-fold) and mRNA level (p < 0.05). Two of the main cellular signalling pathways involving RHOC, MAPK and PI3K/Akt/mTOR, regulate cell growth, motility, and survival. Downstream signalling products of these pathways have been shown to increase MMP2 and MMP9 expression. An extracellular MMP2 and MMP9 ELISA revealed a non-significant increase in MMP2 and MMP9 in the cells transfected with A1 compared to the other (sub)genotypes (p < 0.05). The upregulated Ras-associated proteins have been implicated as oncoproteins in various cancers and could contribute to the increased hepatocarcinogenic potential of A1.

Keywords: (sub)genotypes; hepatitis B virus; hepatocellular carcinoma; oncogenic pathways; viral oncogenesis.


Conflict of interest statement

S.S. has a commercial interest in ReSyn Biosciences which supplied the magnetic microspheres used during mass spectrometry sample preparation. The authors have no additional conflicts of interest to declare.

Figures
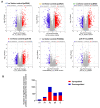
Figure 1
Figure 1
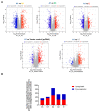
Mass spectrometry analysis of the HBV genotypes: (A) Volcano plots of the differentially expressed proteins in Huh7 cells transfected with replication-competent A1, A2, D3, E, and untransfected control against the vector-only control, using ©Spectronaut software. The negative x-axis represents downregulation (blue) in the vector control group, and the positive axis represents upregulated (red) proteins in the vector control group. (B) A bar graph showing the number of significantly upregulated (red) and downregulated (blue) proteins in each of the HBV (sub)genotypes, and the untransfected cells, compared to the vector control.
Figure 2
Figure 2
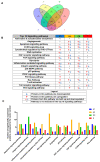
Proteomic analysis of the top 10 signalling pathways amongst the HBV genotypes. (A) Venn diagram indicating the pathways associated with differentially expressed proteins from A1, A2, D3, and E. Proteins were normalised against both the untransfected and vector-only control. (B) Comparison table demonstrating the top 10 pathways across the various genotypes. Proteomic analysis revealed significantly differently expressed proteins (p < 0.05) between the various (sub)genotypes These differentially expressed proteins were further classified into pathways. (C) Comparison table of the number of proteins amongst the top 10 pathways in (sub)genotypes A1, A2, D3, and E, which were present in more than one (sub)genotype.
Figure 3
Figure 3
Mass spectrometry analysis of subgenotype A1 compared to different (sub)genotypes and controls. (A) Volcano plots of the differentially expressed proteins in Huh7 cells transfected with replication-competent A2, D3, E, and untransfected control, and vector control against subgenotype A1 using ©Spectronaut software. The negative x-axis represents downregulation (blue) in subgenotype A1, and the positive axis represents upregulated (red) proteins in subgenotype A1. (B) A bar graph showing the number of significantly upregulated (red) and downregulated (blue) proteins in each of the HBV (sub)genotypes, untransfected, and vector control, compared to subgenotype A1.
Figure 4
Figure 4
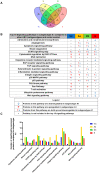
Proteomic analysis of the top 10 signalling pathways amongst the HBV genotypes: (A) Venn diagram indicating the pathways associated with differentially expressed proteins from A2, D3, E, and the vector control (VC). Proteomic analysis revealed significantly differently expressed proteins (p < 0.05) between the various (sub)genotypes These differentially expressed proteins were further classified into pathways. (B) Comparison table of the number of proteins amongst the top 10 pathways in subgenotype A1 compared to (sub)genotypes A2, D3, E, and the VC. (C) Comparison table of the number of proteins amongst the top 10 pathways in subgenotype A1 compared to (sub)genotypes A2, D3 and E, and vector control, which were present in more than one sample.
Figure 5
Figure 5
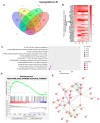
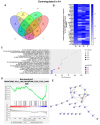
Upregulated common proteins found in subgenotype A1 in comparison to the other HBV (sub)genotypes. (A) Venn diagram illustrating the 32 significantly differentially expressed upregulated proteins found in A1 compared to the other HBV (sub)genotypes and the vector control. (B) The heatmaps show the upregulated (red) average log2 expression of the 32 significantly expressed common proteins in A1 compared to other HBV (sub)genotypes and the vector control. (C) A dot plot generated using the upregulated potential protein in ShinyGO analysis, with Reactome pathway enrichment and fold enrichment based on the number of genes present in each pathway. The FDR cut-off was set at 0.05, and the number of pathways was set to 10. (D) GSEA enrichment plot between subgenotype A1 and the vector control, showing the upregulated enrichment of Reactome pathway of RHO GTPases activating formins. (E) Network analysis of upregulated dysregulated proteins using STRING network (Fold cut-off set to 0.4). Lines of different colors represent seven types of evidence used in predicting associations. Red line: fusion evidence; green line: neighborhood evidence; blue line: co-occurrence evidence; purple line: experimental evidence; yellow line: text mining evidence; light blue line: database evidence; black line: co-expression evidence.
Figure 6
Figure 6
Downregulated common proteins found in subgenotype A1 in comparison to the other HBV (sub)genotypes. (A) Venn diagram illustrating the 31 significantly differentially expressed downregulated proteins found in A1 compared to the other HBV (sub)genotypes and the vector control. (B) The heatmaps show the downregulated (blue) average log2 expression of the 32 significantly expressed common proteins in A1 compared to other HBV (sub)genotypes and the vector control. (C) A dot plot generated using the downregulated potential protein in ShinyGO analysis, with Reactome pathway enrichment and fold enrichment based on the number of genes present in each pathway. The FDR cut-off was set at 0.05, and the number of pathways was set to 10. (D) GSEA enrichment plot between subgenotype A1 and the vector control, showing the downregulated enrichment of the Reactome pathway of Toll-like receptor TLR1–TLR2 cascade. (E) Network analysis of downregulated dysregulated proteins using STRING network (Fold cut-off set to 0.4). Lines of different colors represent seven types of evidence used in predicting associations. Red line: fusion evidence; green line: neighborhood evidence; blue line: co-occurrence evidence; purple line: experimental evidence; yellow line: text mining evidence; light blue line: database evidence; black line: co-expression evidence.
Figure 7
Figure 7
Verification of the potential Ras-associated proteins. Ras-associated proteins RHOC (A), Rap2B (B), and GNB1 (C) were verified as potential proteins by measuring the mRNA expression normalised to the GADPH housekeeping control 5 days post-transfection. Results are expressed as a ratio between the mRNA expression of the Ras-associated proteins and GAPDH. Significant differences were analysed using a one-way ANOVA statistical test and compared to the expression in subgenotype A1. * = p-value < 0.05, ** = p-value < 0.01, *** = p-value < 0.001, **** = p-value < 0.0001 and ns = not significant.
Figure 8
Figure 8
The expression of RHOC and its downstream signalling products. (A) Intracellular (red) and extracellular (green) expression of RHOC in Huh7 cells transfected with the various HBV (sub)genotypes after 5 days. Significant differences were analysed using a one-way ANOVA statistical test and compared to the expression in subgenotype A1 (**** = p-value < 0.0001). (B) The extracellular supernatant was harvested from HBV (sub)genotypes and controls, 5 days post-transfection, and analysed with MMP2 and MMP9 ELISA kit. Results indicated that MMP2 (purple) extracellular expression levels were significantly higher than MMP9 expression levels (pink) using a two-way ANOVA statistical test. Subgenotype A1 showed a non-significant increase in both MMP2 and MMP9 expression levels compared to the other HBV (sub)genotypes and controls.
Figure 9
Figure 9
The localisation of RHOC expression in the various (sub)genotypes. (A) Microscopy of transfected Huh7 cells with the different HBV (sub)genotypes after 5 days, viewed with a fluorescent microscope. Cells were immunostained with a polyclonal rabbit anti-HBc antibody (DAKO) and monoclonal mouse anti-RHOA/RHOC antibody. The nuclei were visualised by DAPI staining. (B) Selected microscopy of transfected Huh7 cells with subgenotype A1 after 5 days, viewed with a fluorescent microscope. Cells were immunostained with a polyclonal rabbit anti-HBc antibody (DAKO) and monoclonal mouse anti-RHOA/RHOC antibody. The nuclei were visualised by DAPI staining. Yellow arrows indicate the areas of focal adhesion where RHOA/RHOC is co-localised with the HBV core protein. (C) A volcano plot indicating the mean fluorescence intensity of the RHOA/RHOA expression in cells transfected with subgenotype A1 compared to other HBV (sub)genotypes and the untransfected (UT) control. Significant differences were analysed using a one-way ANOVA statistical test and compared to the expression in subgenotype A1. * = p-value < 0.05 and **** = p-value < 0.0001. (D) Comparative bar chart showing the percentage of Huh7 cells that have displayed diffused RHOA/RHOC staining or focal adhesion staining, amongst the various HBV genotypes.
Figure 10
Figure 10
The role of potential Ras-associated proteins upregulated in A1. The predicted overexpressed or activated signalling Ras pathway that subgenotype A1 favours. Potential Ras-associated proteins, Rap2B, RhoC and GNB1, are seen throughout the pathway and can affect downstream signalling pathways, TGF-β, PI3K/Akt, and p38 signalling pathways. These downstream signalling pathways have been shown to increase cell proliferation, apoptosis resistance, evasion, and metastasis in HCCs by increasing extracellular MMP2 and MMP9 expression.

References

    1. Ferlay J., Colombet M., Soerjomataram I., Parkin D.M., Piñeros M., Znaor A., Bray F. Cancer statistics for the year 2020: An overview. Int. J. Cancer. 2021;149:778–789. doi: 10.1002/ijc.33588. - DOI - PubMed
    1. Sung H., Ferlay J., Siegel R.L., Laversanne M., Soerjomataram I., Jemal A., Bray F., Bsc M.F.B., Me J.F., Soerjomataram M.I., et al. Global Cancer Statistics 2020: GLOBOCAN Estimates of Incidence and Mortality Worldwide for 36 Cancers in 185 Countries. CA Cancer J. Clin. 2021;71:209–249. doi: 10.3322/caac.21660. - DOI - PubMed
    1. WHO . Global Hepatitis Report 2024: Action for Access in Low- and Middle-Income Countries. World Health Organization; Geneva, Switzerland: 2024.
    1. Llovet J.M., Kelley R.K., Villanueva A., Singal A.G., Pikarsky E., Roayaie S., Lencioni R., Koike K., Zucman-Rossi J., Finn R.S. Hepatocellular carcinoma. Nat. Rev. Dis. Primers. 2021;7:6. doi: 10.1038/s41572-020-00240-3. - DOI - PubMed
    1. Kew M.C. Hepatocellular carcinoma with and without cirrhosis. A comparison in southern African blacks. Gastroenterology. 1989;97:136–139. doi: 10.1016/0016-5085(89)91426-1. - DOI - PubMed

Publication types

MeSH terms

LinkOut - more resources