. 2024 Jul 3;16(7):1073.
doi: 10.3390/v16071073.

The Chameleon Strategy-A Recipe for Effective Ligand Screening for Viral Targets Based on Four Novel Structure-Binding Strength Indices

Affiliations

The Chameleon Strategy-A Recipe for Effective Ligand Screening for Viral Targets Based on Four Novel Structure-Binding Strength Indices

Magdalena Latosińska et al. Viruses. .

Abstract

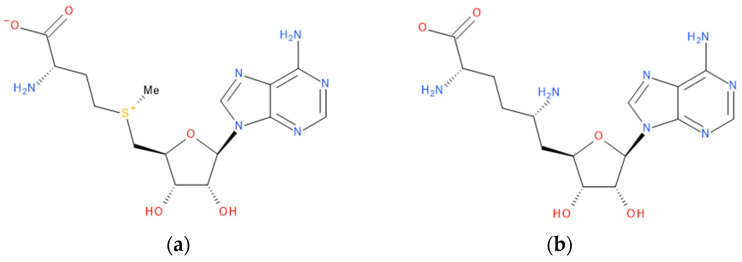
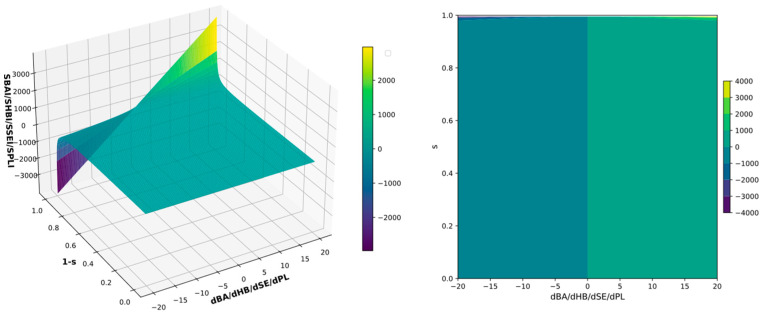
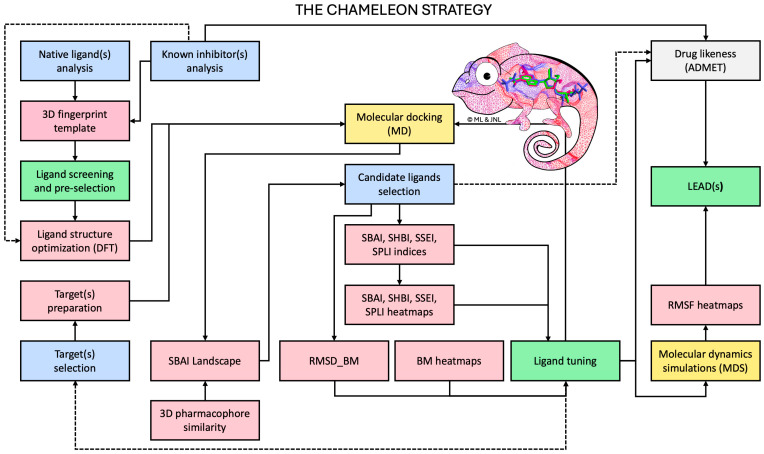
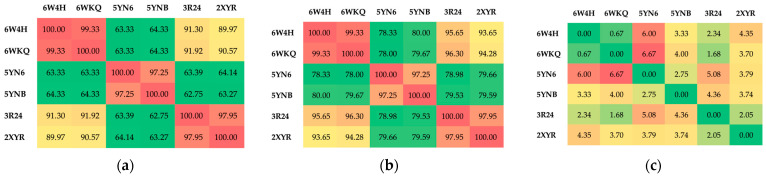
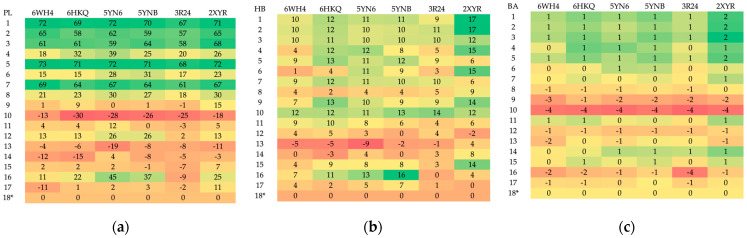
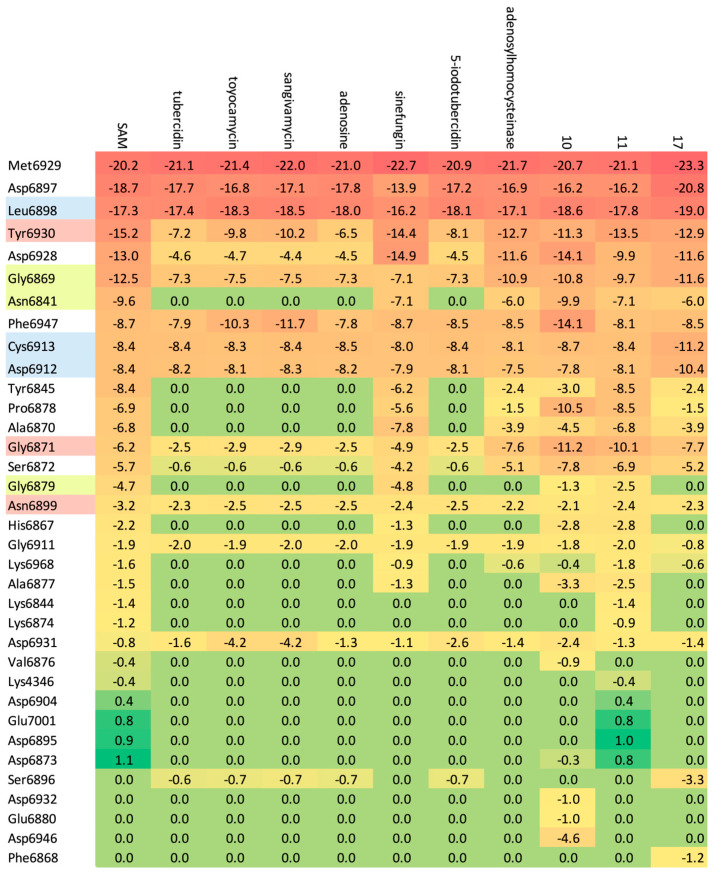
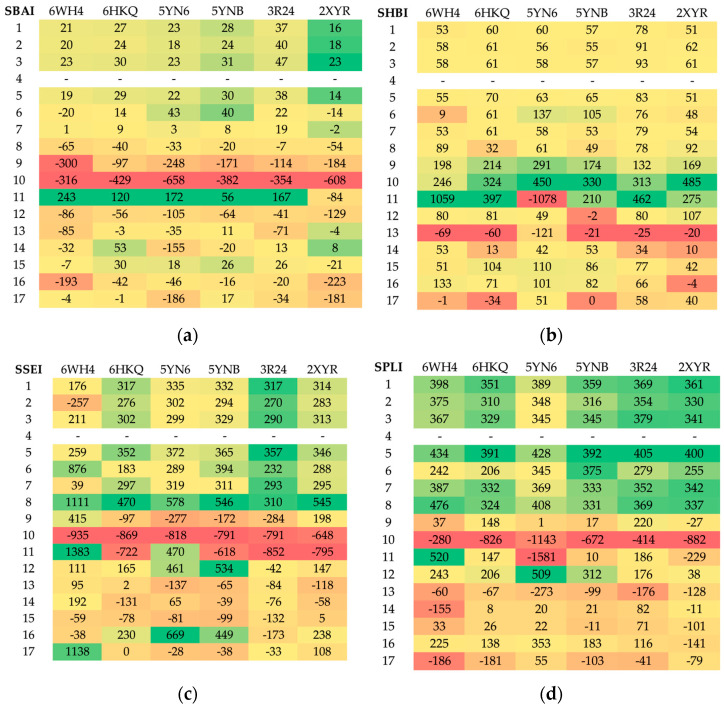
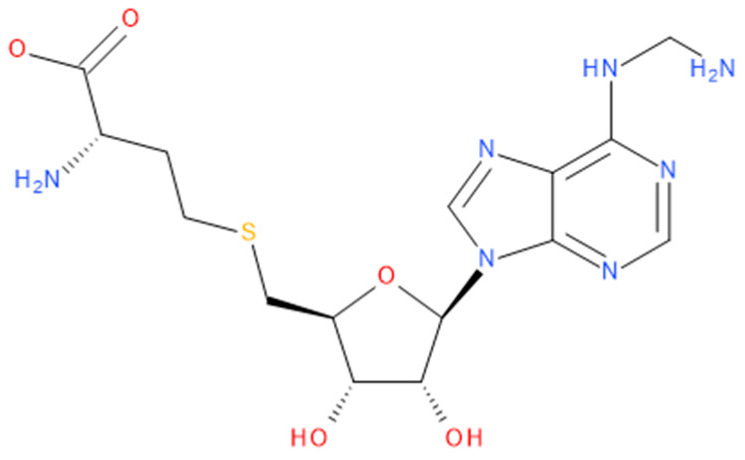
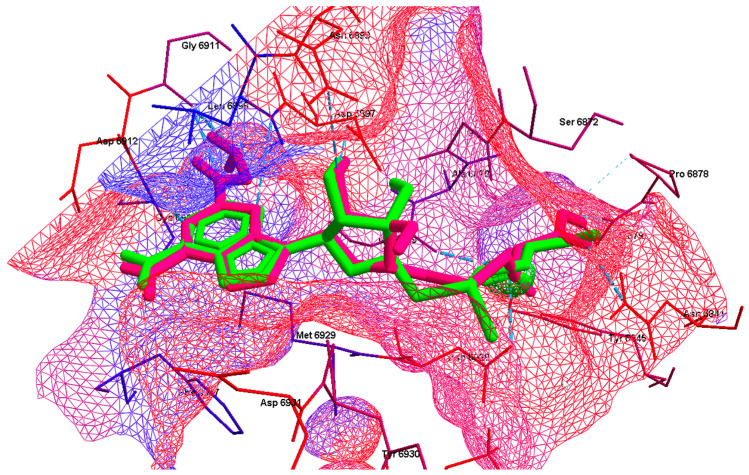
The RNA viruses SARS-CoV, SARS-CoV-2 and MERS-CoV encode the non-structural Nsp16 (2'-O-methyltransferase) that catalyzes the transfer of a methyl group from S-adenosylmethionine (SAM) to the first ribonucleotide in mRNA. Recently, it has been found that breaking the bond between Nsp16 and SAM substrate results in the cessation of mRNA virus replication. To date, only a limited number of such inhibitors have been identified, which can be attributed to a lack of an effective "recipe". The aim of our study was to propose and verify a rapid and effective screening protocol dedicated to such purposes. We proposed four new indices describing structure-binding strength (structure-binding affinity, structure-hydrogen bonding, structure-steric and structure-protein-ligand indices) were then applied and shown to be extremely helpful in determining the degree of increase or decrease in binding affinity in response to a relatively small change in the ligand structure. After initial pre-selection, based on similarity to SAM, we limited the study to 967 compounds, so-called molecular chameleons. They were then docked in the Nsp16 protein pocket, and 10 candidate ligands were selected using the novel structure-binding affinity index. Subsequently the selected 10 candidate ligands and 8 known inhibitors and were docked to Nsp16 pockets from SARS-CoV-2, MERS-CoV and SARS-CoV. Based on the four new indices, the best ligands were selected and a new one was designed by tuning them. Finally, ADMET profiling and molecular dynamics simulations were performed for the best ligands. The new structure-binding strength indices can be successfully applied not only to screen and tune ligands, but also to determine the effectiveness of the ligand in response to changes in the target viral entity, which is particularly useful for assessing drug effectiveness in the case of alterations in viral proteins. The developed approach, the so-called chameleon strategy, has the capacity to introduce a novel universal paradigm to the field of drugs design, including RNA antivirals.

Keywords: RNA viruses; SARS; chameleon strategy; drug design; molecular chameleons; molecular docking; molecular dynamics simulations; novel approach; structure hydrogen bond index; structure protein–ligand index; structure steric effect index; structure–binding affinity index.


Conflict of interest statement

The authors declare no conflicts of interest.

Figures

Figure 1
Figure 1
The structures of (a) S-adenosylmethionine (SAM, AdoMet)—essential for coronavirus replication and (b) sinefungin—the known Nsp16 inhibitor.
Figure 2
Figure 2
The 3D surface (left) and contour (right) plots of structure–binding strength indices (SBSI). The di independent variable was truncated to the range from −20 to 20; the SBSI(di, s) was truncated for visualization purposes.
Figure 3
Figure 3
The chameleon strategy flowchart. The blue and green boxes represent steps, yellow, grey and pink boxes indicate the methods, the solid and dashed line shows fundamental and optional paths, respectively.
Figure 4
Figure 4
Protein alignment across the Nsp16 structures (a) identity—left, (b) similarity—middle and (c) gaps—right in the protein sequences. The most similar protein pairs in terms of identity and similarity are marked in red and the least similar in green. The largest number of gaps are marked in red; the smallest number is marked in green. The EBLOSUM62 matrix with gap penalty (GOP) = 2.0 and gap extension penalty (GEP) = 2.0 was used.
Figure 5
Figure 5
The superimposed structures of Nsp16 (a) SARS-CoV-2 (6W4H) vs. MERS-CoV (5YN6) and (b) SARS-CoV-2 (6W4H) vs. SARS-CoV (3R24) with the rigid areas marked in red (red ∆B = +4, blue ∆B = −2). The region of increased rigidity is located near Glu7062 (6W4H) and TYR30, Thr140 and Gln266 (6XKM), Arg38 (5YN6) and TYR 30 and Lys141 (3R24 and 2XYR).
Figure 6
Figure 6
The superimposed structures of Nsp16 (a) SARS-CoV-2 (6W4H vs. 6WKQ), (b) SARS-CoV (3R24 vs. 2XYR) and (c) MERS-CoV (5YN6 vs. 5YNB) with the rigid areas marked in red (red ∆B = +4, blue ∆B = −2). The region of increased rigidity is located near Glu7062 (6W4H) and TYR30, THR140 and GLN266 (6XKM), Arg38 (5YN6) and TYR 30 and Lys141 (3R24 and 2XYR). The white bands serve to indicate the gaps.
Figure 7
Figure 7
The chart showing pre-selected and rejected ligands (low absolute SBAI—red/high absolute SBAI—green).
Figure 8
Figure 8
A comparison of the heatmaps visualizing (a) protein–ligand energy, PL, (b) hydrogen bond term, HB and (c) binding affinity, BA, for 102 complexes under investigation (* reference ligand). (Red represents favorable values, while green indicates unfavorable values.).
Figure 9
Figure 9
Different heatmaps visualizing the relative (a) protein–ligand, (b) hydrogen bonding (c) binding affinity among the set of 102 structures (* reference ligand). (Red indicates an increase and green a decrease in value).
Figure 10
Figure 10
The best poses of the known inhibitors: 1 (dark green), 2 (yellow), 3 (cyan), 4 (green), 5 (white), 6 (red), 7 (blue) and 8 (violet); target from 6WH4. The hydrogen bonds between the ligand and the Nsp16 residues are shown with a blue dashed line. The residues are colored according to their hydrophobicity. The colors of the hydrophobic surface reflect the hydrophobicity of the residues.
Figure 11
Figure 11
The best poses of the candidate ligands: 9 (brown), 10 (red), 11 (dark cyan), 12 (light pink), 13 (light blue), 14 (dark violet), 15 (orange), 16 (navy) and 17 (yellow). The native ligand, SAM, is shown in light green; target from 6WH4. The residues are colored according to their hydrophobicity. The colors of the hydrophobic surface reflect the hydrophobicity of the residues.
Figure 12
Figure 12
A comparison of the components of the binding pattern (hydrophobic interactions and hydrogen bonds) (a) SAM (b) sinefungin, (c) ligand 9 (d) ligand 10 (e) ligand 11 and (f) ligand 17. (The best poses are shown in Figure 9 and Figure 10.).
Figure 13
Figure 13
Heatmap showing the differences in the binding patterns between the different ligands; 6WH4 target. Negative contributions are marked in red; positive contributions are marked in green. The names of the key residues that bind the protein to the ligand via hydrogen bonds are marked with a color (adenine, methionine and glycone moieties in blue, yellow and pink, respectively).
Figure 14
Figure 14
The heatmaps of SBS indices (a) structure–binding affinity index (SBAI), (b) structure–hydrogen bond index (SHBI), (c) structure–steric effect index (SSEI) and (d) structure–protein–ligand index (SPLI) for 102 complexes (17 ligands and six targets). (Red represents the negative values, while green indicates positive values.). Ligand 4 (SAM) is the reference.
Figure 15
Figure 15
The structural formula of 2-Amino-4-[[5-[6-amino-2-(3-aminomethylamino)purin-9-yl]-3,4-dihydroxyoxolan-2-yl]methylsulfanyl]butanoic acid).
Figure 16
Figure 16
The best pose of the new ligand 2-Amino-4-[[5-[6-amino-2-(3-aminomethylamino)purin-9-yl]-3,4-dihydroxyoxolan-2-yl]methylsulfanyl]butanoic acid (magenta). The native ligand, SAM, is shown in light green; target—6WH4. The hydrogen bonds between the ligand and the Nsp16 residues are shown with a blue dashed line. The residues are colored according to their hydrophobicity. The colors of the hydrophobic surface reflect the hydrophobicity of the residues.
Figure 17
Figure 17
The components of the binding pattern: hydrophobic interactions and hydrogen bonds, (2~{S})-2-amino-4-[[(2~{S},3~{S},4~{R},5~{R})-5-[6-(aminomethylamino)purin-9-yl]-3,4-dihydroxy-tetrahydrofuran-2-yl]methylsulfanyl]butanoic acid—Nsp16 complex.
Figure 18
Figure 18
The radar view of physicochemical properties (a) SAM, (b) ligand 10, (c) new ligand (2~{S})-2-amino-4-[[(2~{S},3~{S},4~{R},5~{R})-5-[6-(aminomethylamino)purin-9-yl]-3,4-dihydroxy-tetrahydrofuran-2-yl]methylsulfanyl]butanoic acid; ADMET 3.0.
Figure 19
Figure 19
Root means square fluctuation (RMSF) graph representing MDS of the individual residues. The color scale bar is displayed in the image; the most flexible residues are shown in red.
Figure 20
Figure 20
Multimodel (several models superimposed) visualization of the fluctuations of the Nsp16 complexed with (a) ligand 10, (b) ligand 17, (c) (2-Amino-4-[[5-[6-amino-2-(3-aminomethylamino)purin-9-yl]-3,4-dihydroxyoxolan-2-yl]methylsulfanyl]butanoic acid); residue position color scheme was used.

References

    1. McIntosh K., Dees J.H., Becker W.B., Kapikian A.Z., Chanock R.M. Recovery in Tracheal Organ Cultures of Novel Viruses from Patients with Respiratory Disease. Proc. Natl. Acad. Sci. USA. 1967;57:933–940. doi: 10.1073/pnas.57.4.933. - DOI - PMC - PubMed
    1. Van Der Hoek L., Pyrc K., Jebbink M.F., Vermeulen-Oost W., Berkhout R.J.M., Wolthers K.C., Wertheim-van Dillen P.M.E., Kaandorp J., Spaargaren J., Berkhout B. Identification of a New Human Coronavirus. Nat. Med. 2004;10:368–373. doi: 10.1038/nm1024. - DOI - PMC - PubMed
    1. Hamre D., Procknow J.J. A New Virus Isolated from the Human Respiratory Tract. Exp. Biol. Med. 1966;121:190–193. doi: 10.3181/00379727-121-30734. - DOI - PubMed
    1. Woo P.C.Y., Lau S.K.P., Chu C., Chan K., Tsoi H., Huang Y., Wong B.H.L., Poon R.W.S., Cai J.J., Luk W., et al. Characterization and Complete Genome Sequence of a Novel Coronavirus, Coronavirus HKU1, from Patients with Pneumonia. J. Virol. 2005;79:884–895. doi: 10.1128/JVI.79.2.884-895.2005. - DOI - PMC - PubMed
    1. Peiris J., Lai S., Poon L., Guan Y., Yam L., Lim W., Nicholls J., Yee W., Yan W., Cheung M., et al. Coronavirus as a Possible Cause of Severe Acute Respiratory Syndrome. Lancet. 2003;361:1319–1325. doi: 10.1016/S0140-6736(03)13077-2. - DOI - PMC - PubMed

MeSH terms

LinkOut - more resources