. 2024 Jun 24;12(7):705.
doi: 10.3390/vaccines12070705.

Feline Infectious Peritonitis mRNA Vaccine Elicits Both Humoral and Cellular Immune Responses in Mice

Affiliations

Feline Infectious Peritonitis mRNA Vaccine Elicits Both Humoral and Cellular Immune Responses in Mice

Terza Brostoff et al. Vaccines (Basel). .

Abstract

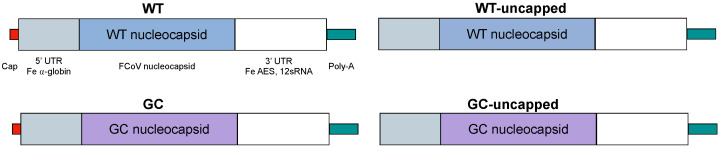
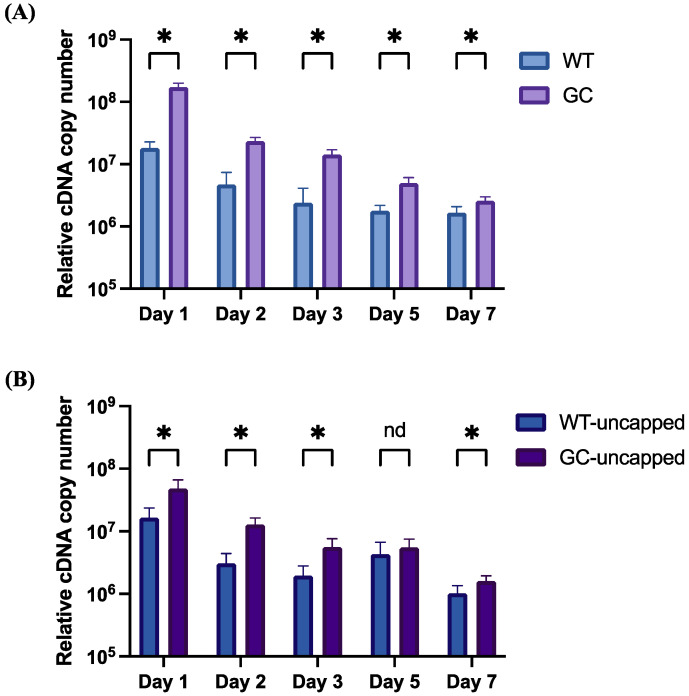
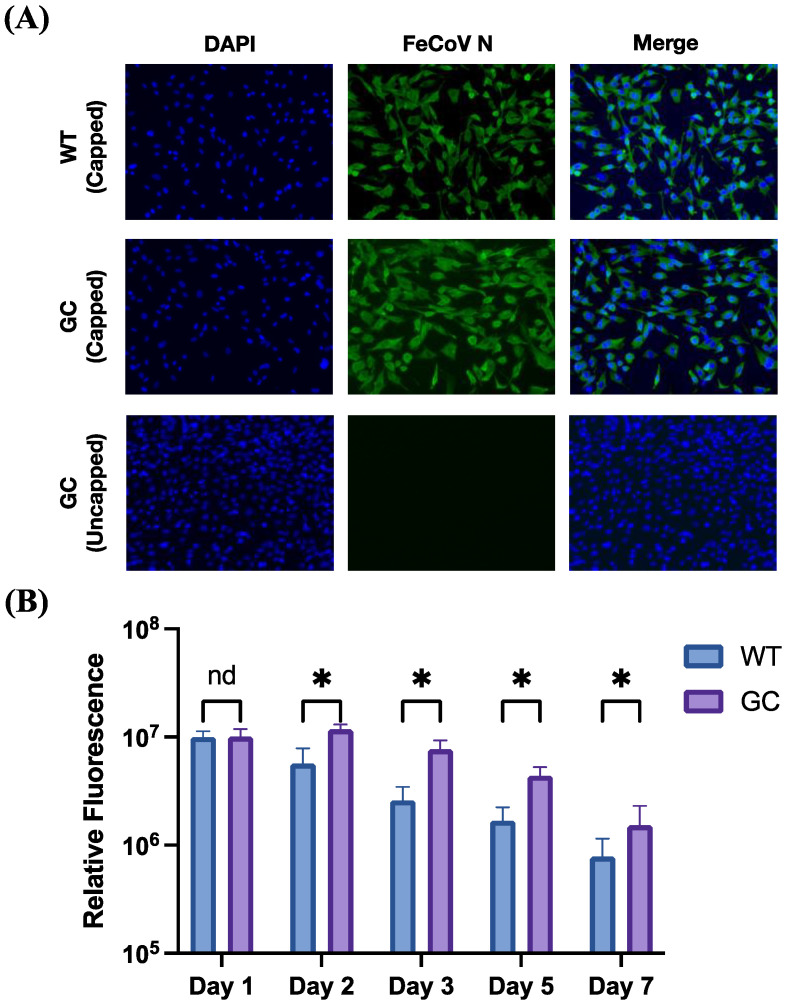
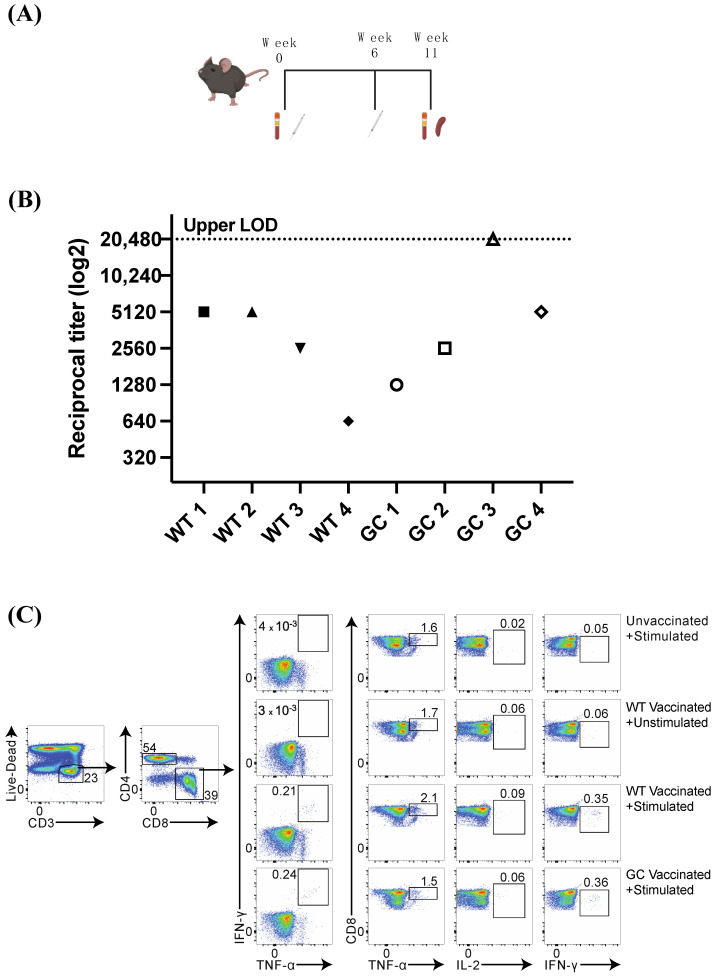
Feline infectious peritonitis (FIP) is a devastating and often fatal disease caused by feline coronavirus (FCoV). Currently, there is no widely used vaccine for FIP, and many attempts using a variety of platforms have been largely unsuccessful due to the disease's highly complicated pathogenesis. One such complication is antibody-dependent enhancement (ADE) seen in FIP, which occurs when sub-neutralizing antibody responses to viral surface proteins paradoxically enhance disease. A novel vaccine strategy is presented here that can overcome the risk of ADE by instead using a lipid nanoparticle-encapsulated mRNA encoding the transcript for the internal structural nucleocapsid (N) FCoV protein. Both wild type and, by introduction of silent mutations, GC content-optimized mRNA vaccines targeting N were developed. mRNA durability in vitro was characterized by quantitative reverse-transcriptase PCR and protein expression by immunofluorescence assay for one week after transfection of cultured feline cells. Both mRNA durability and protein production in vitro were improved with the GC-optimized construct as compared to wild type. Immune responses were assayed by looking at N-specific humoral (by ELISA) and stimulated cytotoxic T cell (by flow cytometry) responses in a proof-of-concept mouse vaccination study. These data together demonstrate that an LNP-mRNA FIP vaccine targeting FCoV N is stable in vitro, capable of eliciting an immune response in mice, and provides justification for beginning safety and efficacy trials in cats.

Keywords: feline coronavirus; feline infectious peritonitis; mRNA vaccine; nucleocapsid.


Conflict of interest statement

The authors declare no conflict of interest.

Figures

Figure 1
Figure 1
mRNA vaccine sequence and design. Modifications commonly applied to the 5′ and 3′ UTRs were used for both WT mRNA (“WT”) and GC-content optimized mRNA (“GC”). For in vitro studies, identical sequences were used but co-transcriptional capping was not performed as an mRNA control without the presence of protein production.
Figure 2
Figure 2
Relative mRNA abundance after in vitro transfection with FCoV N mRNA. Equivalent cell numbers were extracted for q-RT PCR at the indicated timepoints post transfection. Plotted are mean and standard deviation of relative cDNA copy number at each time point, with averages representing biological triplicates and qPCR run in technical triplicates per sample. (A) Comparison of capped WT vs. GC mRNA; (B) comparison of uncapped WT vs. GC mRNA. For comparisons, * = p < 0.05, nd = no difference.
Figure 3
Figure 3
Relative protein expression by IFA after in vitro transfection with FCoV N mRNA. (A) Representative images of FCoV N expression (green, middle and right panels) at 1 day post-transfection. Nuclei are stained with DAPI in blue; top panels represent transfection with capped WT mRNA, middle panels represent transfection with capped GC mRNA, and bottom panels represent transfection with uncapped GC mRNA (negative control). Images have been enhanced identically in this figure. (B) Integrated density was measured at the time points indicated, thresholded to mock-transfected and day 0 transfected average. Plotted are mean and standard deviation of ~10 10× images at each time point. For comparisons, * = p ≤ 0.02, nd = no difference. (C) Western blot was run for cells transfected with indicated mRNAs at day 1 post-transfection, with equivalent cell numbers loaded in each lane (expected size ~50 kDa).
Figure 3
Figure 3
Relative protein expression by IFA after in vitro transfection with FCoV N mRNA. (A) Representative images of FCoV N expression (green, middle and right panels) at 1 day post-transfection. Nuclei are stained with DAPI in blue; top panels represent transfection with capped WT mRNA, middle panels represent transfection with capped GC mRNA, and bottom panels represent transfection with uncapped GC mRNA (negative control). Images have been enhanced identically in this figure. (B) Integrated density was measured at the time points indicated, thresholded to mock-transfected and day 0 transfected average. Plotted are mean and standard deviation of ~10 10× images at each time point. For comparisons, * = p ≤ 0.02, nd = no difference. (C) Western blot was run for cells transfected with indicated mRNAs at day 1 post-transfection, with equivalent cell numbers loaded in each lane (expected size ~50 kDa).
Figure 4
Figure 4
In vivo immune responses in mice. (A) Schematic of mouse study; 10 mice were bled before vaccination (week 0), then vaccinated with WT (n = 4), GC (n = 4), or mock-vaccinated with PBS (n = 2). Mice were boosted at week 6 with the same vaccine or PBS, then euthanized at week 11 for serum and spleen collection. (B) Endpoint serum antibody titers were measured by ELISA and plotted as reciprocal titers, with each mouse represented along the X axis (WT 1–4 represent each of the four mice vaccinated with WT; GC 1–4 represent each of the four mice vaccinated with GC) (95% confidence interval). (C) Endpoint splenocytes were stimulated overnight with overlapping peptides corresponding to the entire N protein, then analyzed by flow cytometry. Gating strategy and representative plots are shown for each group. Unvaccinated + Stimulated = PBS (mock)-vaccinated mouse splenocytes stimulated overnight with peptide pool; WT Vaccinated + Unstimulated or Stimulated = WT-vaccinated mouse splenocytes stimulated overnight with 0.5% DMSO (Unstimulated) or with peptide pool (Stimulated); and GC Vaccinated + Stimulated = GC-vaccinated mouse splenocytes stimulated overnight with peptide pool. Markers of stimulation and immune activation (TNF-α, IL-2, and IFN-γ +) are shown as percentages of Live CD3+CD8+ cells.

References

    1. Pedersen N.C. A Review of Feline Infectious Peritonitis Virus Infection: 1963-2008. J. Feline Med. Surg. 2009;11:225–258. doi: 10.1016/J.JFMS.2008.09.008. - DOI - PMC - PubMed
    1. MacLachlan N., Dubovi E. Coronaviridae. Academic Press; Burlington, MA, USA: 2017.
    1. Jaimes J.A., Whittaker G.R. Feline Coronavirus: Insights into Viral Pathogenesis Based on the Spike Protein Structure and Function. Virology. 2018;517:108. doi: 10.1016/J.VIROL.2017.12.027. - DOI - PMC - PubMed
    1. Tuanthap S., Chiteafea N., Rattanasrisomporn J., Choowongkomon K. Comparative Sequence Analysis of the Accessory and Nucleocapsid Genes of Feline Coronavirus Strains Isolated from Cats Diagnosed with Effusive Feline Infectious Peritonitis. Arch. Virol. 2021;166:2779–2787. doi: 10.1007/S00705-021-05188-7. - DOI - PMC - PubMed
    1. Le Poder S. Feline and Canine Coronaviruses: Common Genetic and Pathobiological Features. Adv. Virol. 2011;2011:609465. doi: 10.1155/2011/609465. - DOI - PMC - PubMed

LinkOut - more resources