. 2024 Oct 2;32(10):3597-3617.
doi: 10.1016/j.ymthe.2024.07.014. Epub 2024 Jul 25.

Specific targeting of cancer vaccines to antigen-presenting cells via an endogenous TLR2/6 ligand derived from cysteinyl-tRNA synthetase 1

Affiliations

Specific targeting of cancer vaccines to antigen-presenting cells via an endogenous TLR2/6 ligand derived from cysteinyl-tRNA synthetase 1

Hyeong Yun Kim et al. Mol Ther. .

Abstract

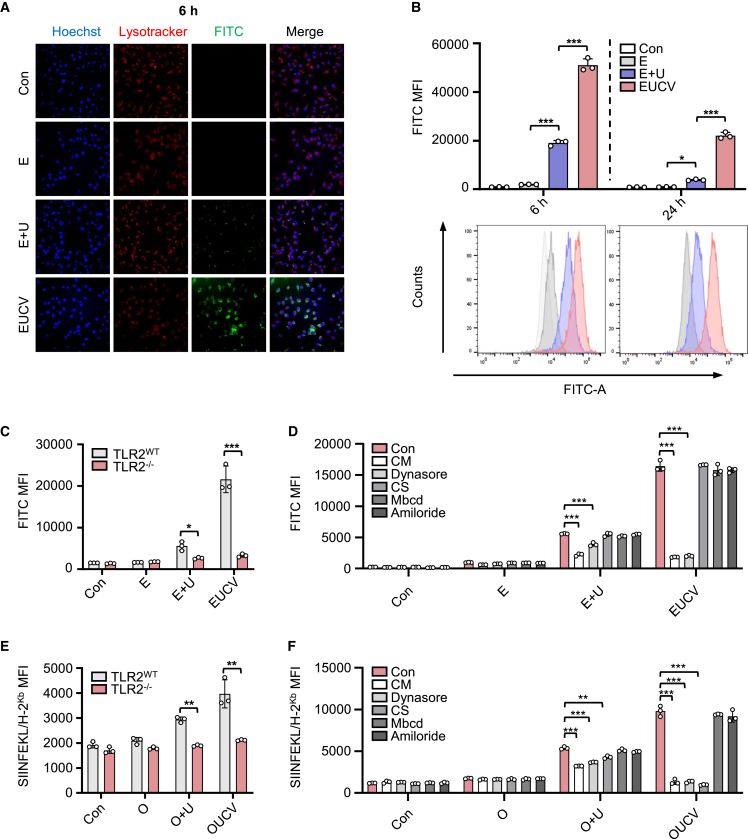
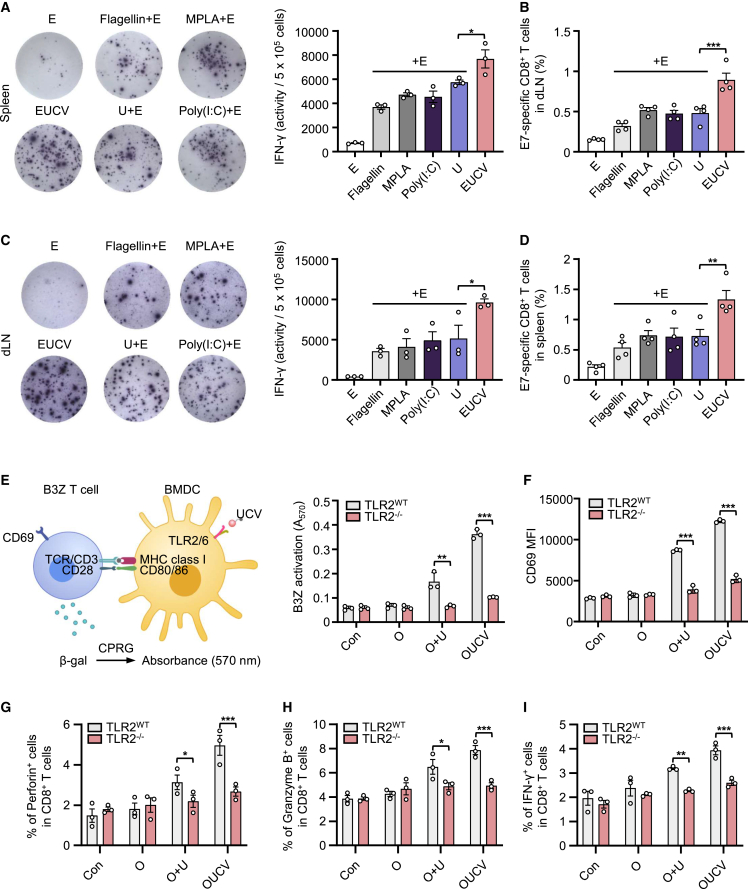
Cancer vaccines have been developed as a promising way to boost cancer immunity. However, their clinical potency is often limited due to the imprecise delivery of tumor antigens. To overcome this problem, we conjugated an endogenous Toll-like receptor (TLR)2/6 ligand, UNE-C1, to human papilloma virus type 16 (HPV-16)-derived peptide antigen, E7, and found that the UNE-C1-conjugated cancer vaccine (UCV) showed significantly enhanced antitumor activity in vivo compared with the noncovalent combination of UNE-C1 and E7. The combination of UCV with PD-1 blockades further augmented its therapeutic efficacy. Specifically, the conjugation of UNE-C1 to E7 enhanced its retention in inguinal draining lymph nodes, the specific delivery to dendritic cells and E7 antigen-specific T cell responses, and antitumor efficacy in vivo compared with the noncovalent combination of the two peptides. These findings suggest the potential of UNE-C1 derived from human cysteinyl-tRNA synthetase 1 as a unique vehicle for the specific delivery of cancer antigens to antigen-presenting cells via TLR2/6 for the improvement of cancer vaccines.

Keywords: Toll-like receptor 2; antigen uptake presentation; cancer vaccine; cervical cancer; conjugated vaccine; cysteinyl-tRNA synthetase; human papillomavirus 16; immune checkpoint inhibitor; immune stimulator; protein delivery.


Conflict of interest statement

Declaration of interests S.K. is an inventor on patents 10-2022-0070287 related to this paper and is a founder of Zymedi.

Figures

None
Graphical abstract
Figure 1
Figure 1
Design of the UNE-C1-conjugated cancer vaccine and its biodistribution and pharmacokinetic profile (A) We designed the conjugated cancer vaccines to covalently link the cancer antigens, linkers, and immune stimulators. For example, we selected E743–62 from HPV-16 oncoprotein E7 as the cancer antigen, the three repeats of (GGGGS) as the linker peptide, and U obtained from human CARS1 as the immune stimulator and fused them into one peptide entity (upper panel). This conjugated cancer vaccine is expected to show enhanced anticancer efficacy with increased local retention in draining lymph nodes, specific delivery to DCs, and enhanced priming of CD8+ T cells (lower panel). (B–D) C57BL/6 mice were subcutaneously injected with 5 nmol of FAM-labeled E or EUCV. (B) Inguinal, axillary, and iliac lymph nodes were excised, and the presence of each peptide was monitored by fluorescence intensity through IVIS at the indicated time interval (n = 3 per group). The fluorescence signals in axillary or iliac lymph nodes were determined as ratios to those in the inguinal lymph node (n = 3 per group). (C and D) After 2 h of immunization, immune cells were harvested from the excised inguinal lymph nodes, and the 5-FAM signals in T cells, B cells, macrophages and DCs, and DC subtypes were assessed via flow cytometry (n = 3 per group). (E and F) 5-FAM-labeled E or EUCV were either (E) subcutaneously or (F) intravenously injected into C57BL/6 mice (n = 3 per group). Less than 50 μL of blood was collected, and the antigen concentration in plasma was quantified for 24 h after injection. The data were used to determine drug concentrations in plasma over time (fit data ± mean with error). Data are representative of three independent experiments, and the results are presented as the mean ± SEM. Statistical significance was analyzed using Student’s t test (∗p < 0.05, ∗∗p < 0.01, ∗∗∗p < 0.001). U, UNE-C1; E, HPV-16 E743–62 peptide; EUCV, HPV-16 E743–62 peptide conjugated UNE-C1; IVIS, in vivo imaging system; DCs, dendritic cells.
Figure 2
Figure 2
Pathway analysis of the UCV for antigen internalization and antigen presentation (A and B) 5-FAM-labeled E and EUCV were treated to BMDCs for 6 and 24 h (each 100 nM). (A) The cells with the internalized and surface-presented antigen were visualized and analyzed using confocal microscopy and (B) flow cytometry, respectively. (C) BMDCs from naive or TLR2–/– C57BL/6 mice were treated with 5-FAM-labeled E, E+U, and EUCV for 24 h. Antigen uptake was analyzed from the CD11c+ gating population, and the FITC signal was evaluated using flow cytometry. (D) BMDCs from naive C57BL/6 mice were preincubated with chlorpromazine (CM, 40 μM), dynasore (20 μM), cathepsin S inhibitor (CS, 2 μM), methyl-β-cyclodextrin (Mbcd, 2 μM), and amiloride(2 mM) for 30 min. FAM-labeled E, E+U, and EUCV were treated to BMDCs for 24 h, and antigen uptake was detected using flow cytometry. (E) Antigen presentation was analyzed from the CD11c+ gating population from BMDCs after pretreatment with 100 nM of O, O+U, or OUCV, and the SIINFEKL/H-2Kb signal was evaluated using flow cytometry. (F) Flow cytometry analysis of SIINFEKL/H-2Kb expression in BMDCs was conducted after pretreating with CM (40 μM), dynasore (20 μM), CS (2 μM), Mbcd (2 μM), and amiloride (2 mM). After 30 min of pretreatment, 100 nM of O, O+U, or OUCV was used for the assay. Data are representative of three independent experiments, and results are presented as the mean ± SD and SEM. Statistical significance was analyzed using Student’s t test or two-way ANOVA (∗p < 0.05, ∗∗p < 0.01, ∗∗∗p < 0.001). U, UNE-C1; O, ovalbumin247–264A4K peptide; BMDC, bone marrow-derived dendritic cell; CD, cluster of differentiation; LN, lymph node.
Figure 3
Figure 3
Evaluation of improved antigen-specific CD8+ T cell immune response and TLR2-dependent cross-presentation of UCV (A and B) (A) C57BL/6 mice were immunized with the indicated reagents on days 0 and 7. On day 14, spleen and dLNs tissues were harvested from immunized mice, and immune cells were isolated. The isolated immune cells (5 × 105 cells) from spleen were ex vivo stimulated with the E7 epitope (2 μg/mL) for 48 h and analyzed using an ELISpot reader (n = 3 per group). (B) Percentages of E7-specific CD8+ T cells in the spleen were measured using E7 tetramers by flow cytometry (n = 3 per group). (C) Immune cells (5 × 105 cells) isolated from dLNs were stimulated ex vivo with the E7 epitope for 48 h and analyzed using an ELISpot reader (n = 3 per group). (D) Percentages of E7-specific CD8+ T cells in the dLNs were measured using E7 tetramers by flow cytometry (n = 3 per group). (E–I) BMDCs from TLR2 WT and TLR2–/– mice were incubated for 24 h with O, O+U, or OUCV and co-cultured overnight in the presence of B3Z CD8+ T cells. T cell activation was determined based on (E) β-galactosidase activity, (F) CD69 expression, (G) Perforin+, (H) Granzyme B+, and (I) IFN-γ+ CD8+ T cell population via absorbance measurement and flow cytometry, respectively. Data are representative of three independent experiments, and the results are presented as the mean ± SEM. Statistical significance was analyzed using Student’s t test (∗p < 0.05, ∗∗p < 0.01, ∗∗∗p < 0.001). B3Z, B3xZ.8 CD8+ T cells; CPRG, chlorophenol red-β-D-galactopyranoside; TCR, T cell receptor; E7 epitope, HPV16 E749–57.
Figure 4
Figure 4
Induction of antigen-specific T cell response and tumor regression by the UCVs in a subcutaneous cervical cancer and lymphoma model (A) C57BL/6 mice were subcutaneously inoculated with 1 × 105 TC-1 cells. On days 6 and 13, mice were subcutaneously injected with 5 nmol of E, E+U, and EUCV, and tumor volumes were measured 3 times a week using a caliper (n = 4 per group). (B–D) Tumors were excised on day 20, and TILs were isolated from tumor tissues. The frequencies of (B) CD8+ T cells and (C) E7-specific CD8+ T cells were assessed using flow cytometry. (D) The expression levels of genes related to CD8+ T cell activation, including Perforin, Granzyme B, FasL, Granulysin, IFN-γ, CXCL-9, CD69, and Tbx21, were analyzed using qRT-PCR. (E) C57BL/6 mice were subcutaneously inoculated with 1 × 106 E.G7-OVA cells. On days 3 and 10, mice were subcutaneously injected with 5 nmol of O, O+U, and OUCV, and tumor volumes were measured 2–3 times a week using a caliper (n = 4–5 per group). (F–H) Tumors were excised on day 17, and TILs were isolated from tumor tissue. The frequencies of (F) CD8+ T cells and (G) OVA-specific CD8+ T cells were assessed using flow cytometry. (H) The expression levels of inflammatory cytokines and genes related to cell activation were analyzed using qRT-PCR. Data are representative of three independent experiments, and the results are presented as the mean ± SEM. Statistical significance was analyzed using Student’s t test (∗p < 0.05, ∗∗p < 0.01, ∗∗∗p < 0.001). S.C., subcutaneous; TIL, tumor-infiltrated lymphocyte.
Figure 5
Figure 5
Synergistic effect of the combination of the UCV and anti-PD-1 blockade (A and B) C57BL/6 mice were subcutaneously inoculated with 1 × 105 TC-1 cells. On days 6 and 13, mice were subcutaneously injected with 5 nmol of E and EUCV at the opposite dorsal side. Anti-PD-1 blockade was intraperitoneally injected on days 6, 9, 12, and 15 to check the synergistic effect. (A) Tumor volumes were measured 3 times a week using a caliper (n = 8 per group), and (B) the percentage of mouse survival was determined. (C) Individual tumor growth and survival profile of TC-1 tumor-bearing mice treated with the indicated vaccine and/or anti-PD-1 blockade for 60 days (n = 8 per group). (D) Gene expression was assessed via qRT-PCR using resected tumor tissue. (E) Tumor tissue slides were stained with anti-CD8, anti-perforin, and anti-granzyme B antibodies to identify T cells, followed by immunohistochemistry. Scale bar, 50 μm. Data are representative of three independent experiments, and the results are presented as the mean ± SEM. Statistical significance was analyzed using Student’s t test, and survival days were analyzed using the Kaplan-Meier method with the log rank (Mantel-Cox) test (∗p < 0.05, ∗∗p < 0.01, ∗∗∗p < 0.001). PD-1, programmed cell death protein 1; CXCL-9, chemokine (C-X-C motif) ligand 9.

References

    1. Kwon N.H., Fox P.L., Kim S. Aminoacyl-tRNA synthetases as therapeutic targets. Nat. Rev. Drug Discov. 2019;18:629–650. doi: 10.1038/s41573-019-0026-3. - DOI - PubMed
    1. Nguyen T.T.T., Choi Y.H., Lee W.K., Ji Y., Chun E., Kim Y.H., Lee J.E., Jung H.S., Suh J.H., Kim S., Jin M. Tryptophan-dependent and -independent secretions of tryptophanyl- tRNA synthetase mediate innate inflammatory responses. Cell Rep. 2023;42 doi: 10.1016/j.celrep.2022.111905. - DOI - PubMed
    1. Park M.C., Goughnour P.C., Jun S., Cho S., Song E., Kim S.B., Kim H.Y., Hyun J.K., Kim P., Jung H.S., Kim S. Two distinct receptor-binding domains of human glycyl-tRNA synthetase 1 displayed on extracellular vesicles activate M1 polarization and phagocytic bridging of macrophages to cancer cells. Cancer Lett. 2022;539 doi: 10.1016/j.canlet.2022.215698. - DOI - PubMed
    1. Guo M., Yang X.L., Schimmel P. New functions of aminoacyl-tRNA synthetases beyond translation. Nat. Rev. Mol. Cell Biol. 2010;11:668–674. doi: 10.1038/nrm2956. - DOI - PMC - PubMed
    1. Cho S., Kim S.B., Lee Y., Song E.C., Kim U., Kim H.Y., Suh J.H., Goughnour P.C., Kim Y., Yoon I., et al. Endogenous TLR2 ligand embedded in the catalytic region of human cysteinyl-tRNA synthetase 1. J. Immunother. Cancer. 2020;8 doi: 10.1136/jitc-2019-000277. - DOI - PMC - PubMed