. 2024 Dec;21(1):2371868.
doi: 10.1080/1547691X.2024.2371868. Epub 2024 Jul 27.

Systemic and immunotoxicity induced by topical application of perfluoroheptane sulfonic acid (PFHpS) or perfluorooctane sulfonic acid (PFOS) in a murine model

Affiliations

Systemic and immunotoxicity induced by topical application of perfluoroheptane sulfonic acid (PFHpS) or perfluorooctane sulfonic acid (PFOS) in a murine model

Lisa M Weatherly et al. J Immunotoxicol. 2024 Dec.

Abstract

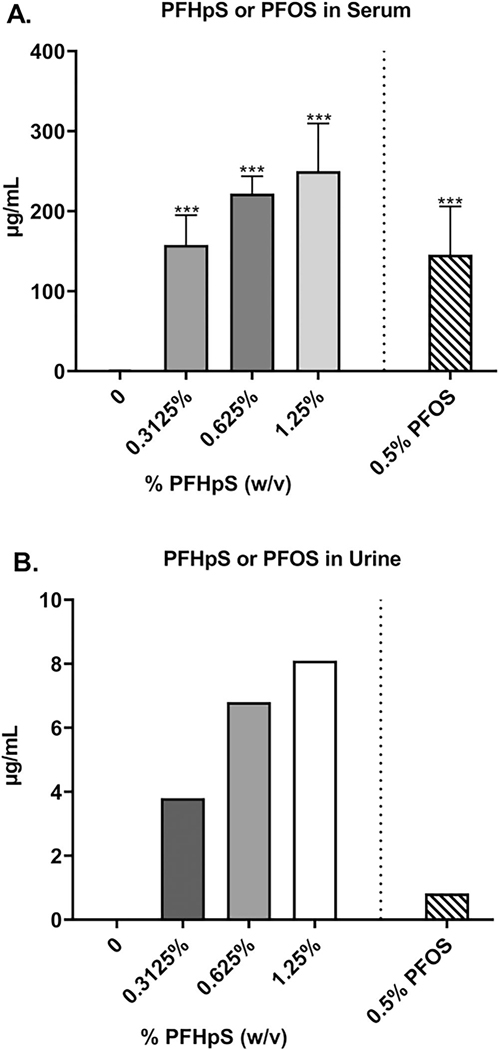
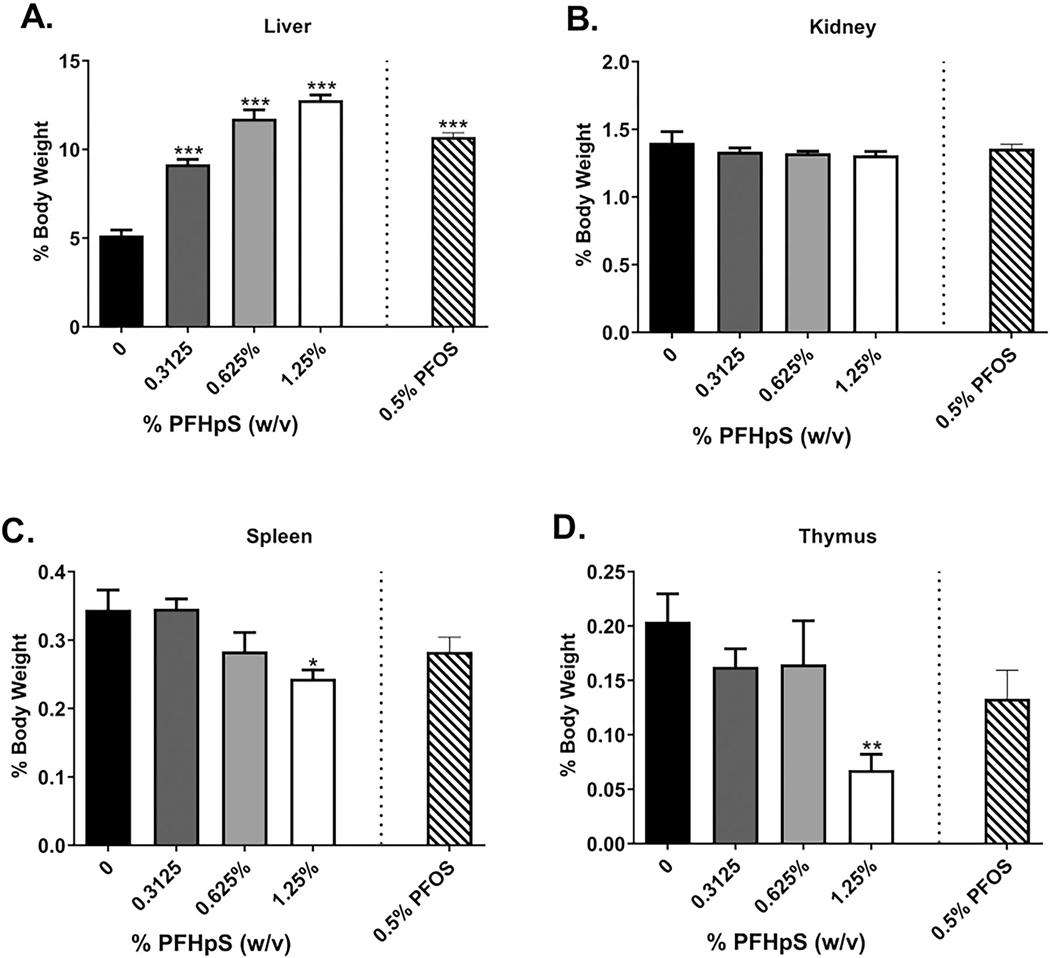
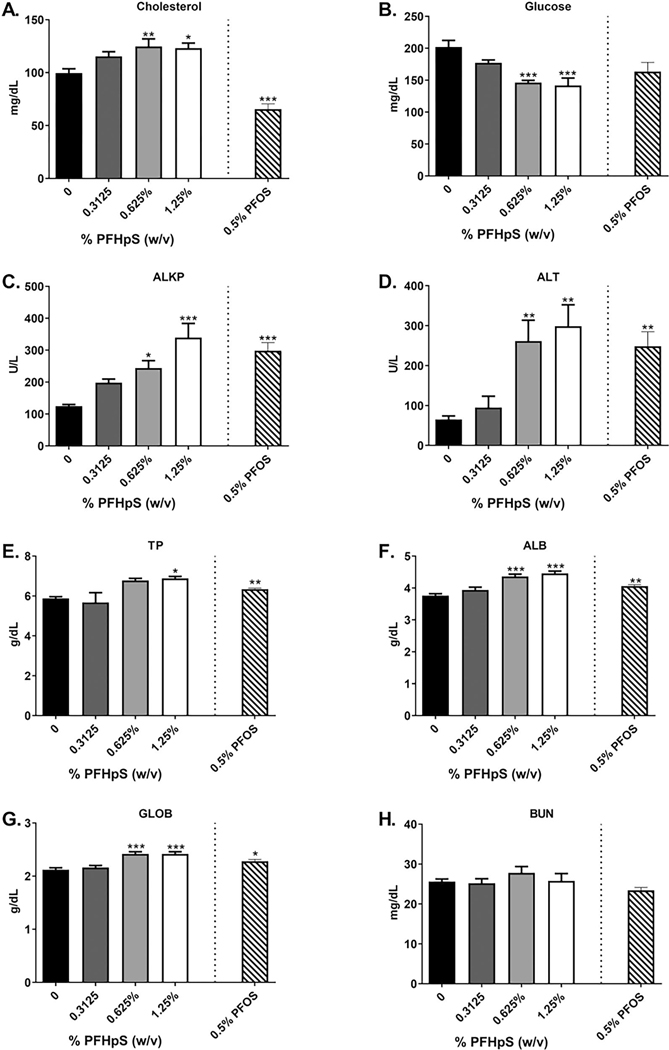
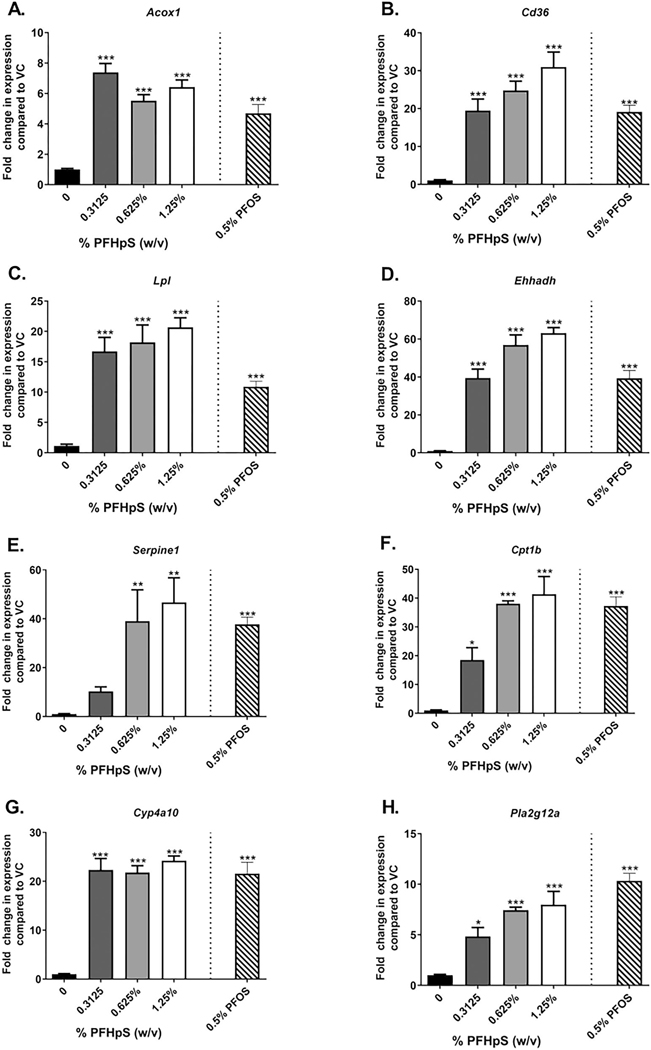
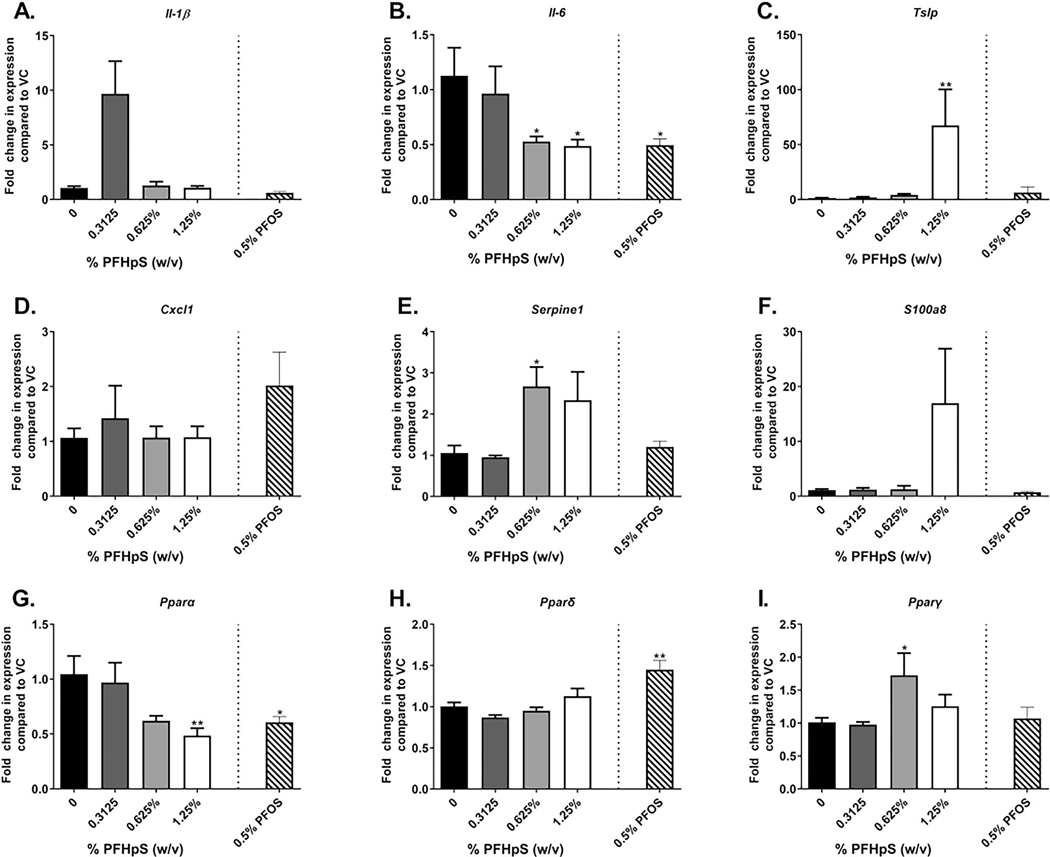
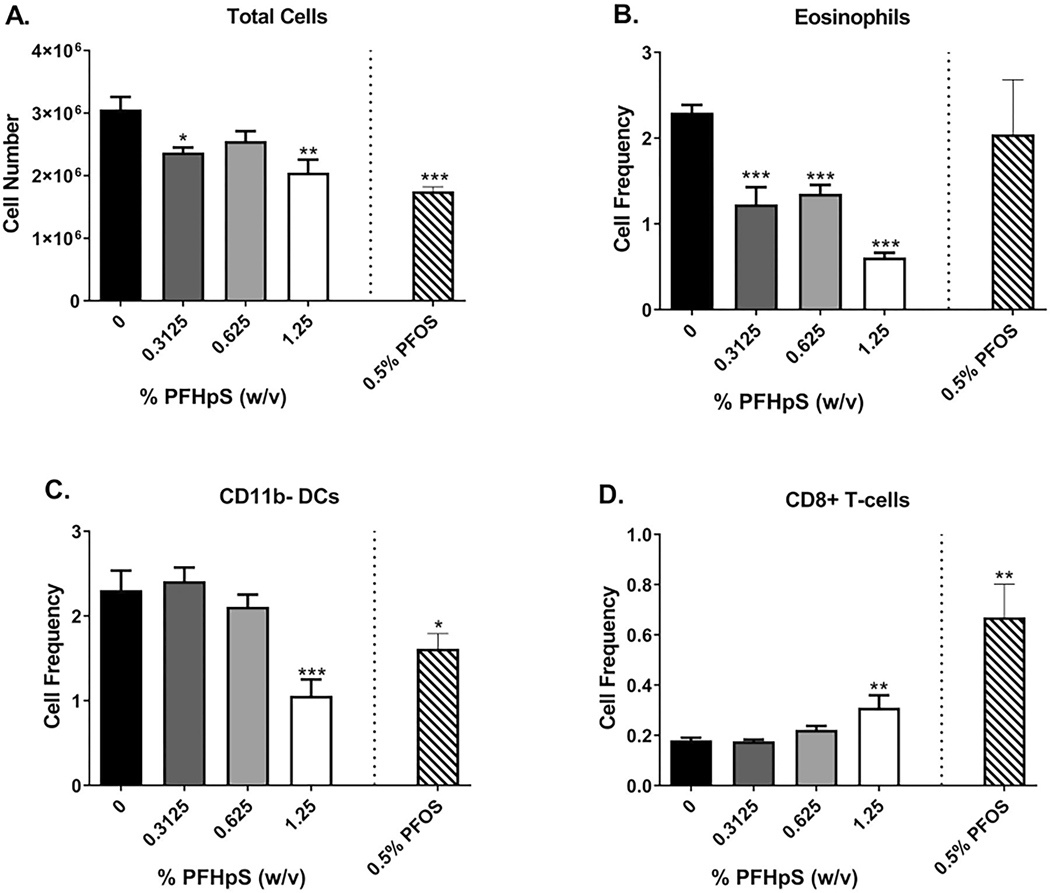
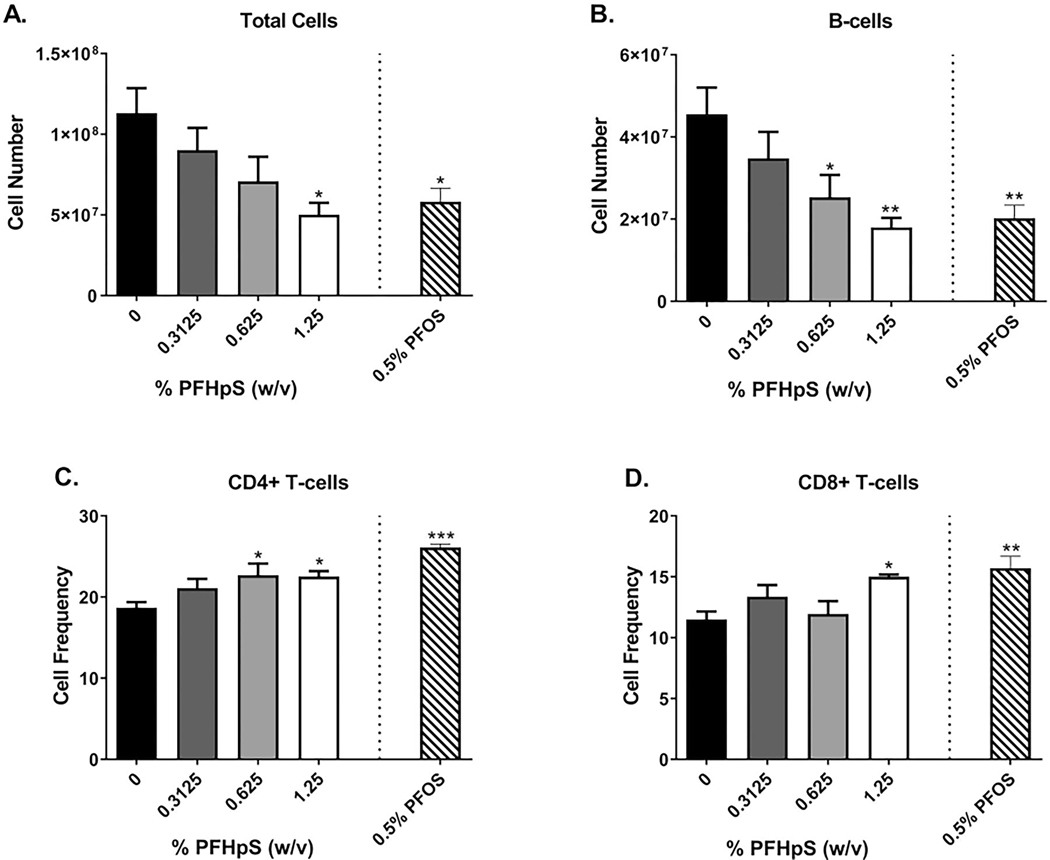
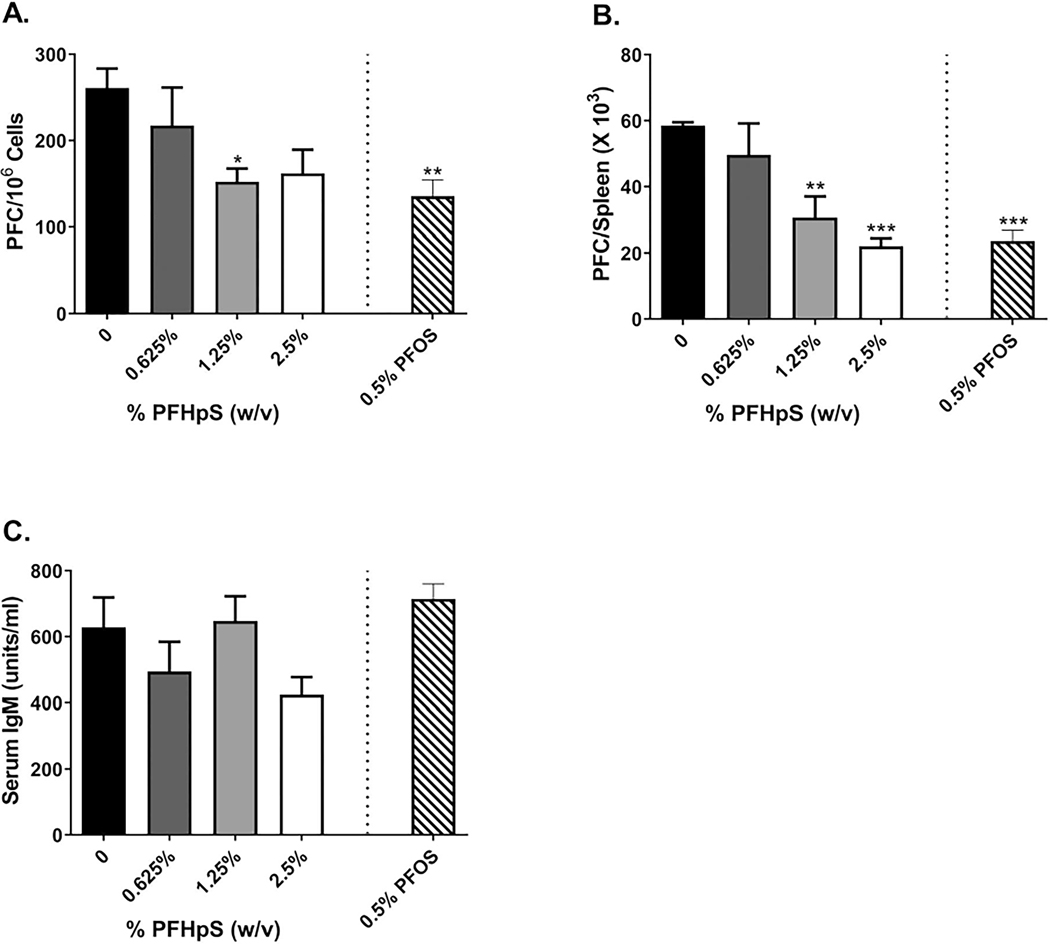
Per- and polyfluoroalkyl substances (PFAS) are a large group of synthetic surfactants of over 12,000 compounds that are incorporated into numerous products for their chemical and physical properties. Studies have associated PFAS with adverse health effects. Although there is a high potential for dermal exposure, these studies are lacking. The present study evaluated the systemic and immunotoxicity of subchronic 28- or 10-days of dermal exposure, respectively, to PFHpS (0.3125-2.5% or 7.82-62.5 mg/kg/dose) or PFOS (0.5% or 12.5 mg/kg/dose) in a murine model. Elevated levels of PFHpS were detected in the serum and urine, suggesting that absorption is occurring through the dermal route. PFHpS induced significantly increased relative liver weight, significantly decreased relative spleen and thymus weight, altered serum chemistries, and altered histopathology. Additionally, PFHpS significantly reduced the humoral immune response and altered immune subsets in the spleen, suggesting immunosuppression. Gene expression changes were observed in the liver, skin, and spleen of genes involved in fatty acid metabolism, necrosis, and inflammation. Immune-cell phenotyping identified significant decreases in B-cells and CD11b+ monocyte and/or macrophages in the spleen along with decreases in eosinophils and dendritic cells in the skin. These findings support PFHpS absorption through the skin leading to liver damage and immune suppression.

Keywords: PPAR; Perfluoroheptane sulfonic acid (PFHpS;), toxicity; dermal; immune; immunosuppression; liver damage.


Figures

Figure 1.
Figure 1.
Changes in PFHpS and PFOS concentration in serum and urine after dermal exposure. Analysis of changes in the concentration of PFHpS and PFOS in serum (A) and concentration of PFHpS and PFOS in urine samples (B) following 28 days of PFHpS exposure. Each concentration represents mean (± SE) of 5 mice/group. Urine concentrations are five pooled samples per group. Statistical significance, relative to 0% vehicle control, was determined by one-way ANOVA followed by a Dunnett’s post-test (PFHpS) or a t-test (PFOS) indicated as ***p < 0.001.
Figure 2.
Figure 2.
Changes in relative organ weights after dermal exposure to PFHpS or PFOS. Analysis of changes in (A) liver, (B) kidney, (C) spleen, and (D) thymus weights following 28 days of PFHpS exposure. Data displayed as organ weight as % body weight. Each concentration represents mean (± SE) of 5 mice/group. Statistical significance, relative to 0% control, was determined by one-way ANOVA followed by a Dunnett’s post-test (PFHpS) or a t-test (PFOS) indicated as *p < 0.05, **p < 0.01, ***p < 0.001.
Figure 3.
Figure 3.
Changes in serum chemistry after dermal exposure to PFHpS or PFOS. Analysis of changes in (A) cholesterol, (B) glucose (C) alkaline phosphatase (ALKP), (D) alanine amino-transferase (ALT), (E) total protein (TP), (F) albumin (ALB), (G) globulin and (H) urea nitrogen following 28 days of PFHpS exposure. Each concentration represents the mean (± SE) of 5 mice/group. Statistical significance, relative to 0% vehicle control, was determined by one-way ANOVA followed by a dunnett’s post-test (PFHpS) or a t-test (PFOS) indicated as *p < 0.05, **p < 0.01, ***p < 0.001.
Figure 4.
Figure 4.
Histopathology of liver, ear, and spleen following dermal exposure to PFHpS. Representative H&E-stained liver, ear, and spleen sections from control and 1.25% PFHpS-treated mice. Vehicle control 0% PFHpS exposure shows normal liver with mononuclear cell infiltrate (arrow), note size of hepatocytes and normal cytoplasmic rarefaction (black circle), 20× magnification (a). Marked hepatocyte hypertrophy (note size and eosinophilia of hepatocytes (black circle)) and minimal multifocal necrosis of hepatocytes (arrows) with a few associated neutrophils (inflammation) was found in 1.25% PFHpS exposed mice, 20× magnification (B). Vehicle control 0% PFHpS exposure shows normal ear (skin), note thickness of epidermis is 1–2 cell layers (arrow), 20× magnification (C). Minimal epidermal hyperplasia was observed in 1.25% PFHpS exposed mice with thickness of epidermis 3–4 cell layers (arrow), 20× magnification (D). Vehicle control 0% PFHpS exposure shows normal spleen (note overall thickness of spleen and size of lymphoid aggregates), 5× magnification (E). Mildly decreased lymphocytic cellularity, decreased overall thickness of the spleen, and decreased size of lymphoid aggregates were observed with 1.25% PFHpS exposed mice, 5× magnification (F).
Figure 5.
Figure 5.
Liver gene expression following dermal exposure to PFHpS. Gene expression in the liver following 28 days of PFHpS exposure. Changes in (A) Acox1, (B) Cd36, (C) Lpl, (D) Ehhadh, (E) Serpine1, (F) Cpt1b, (G) Cyp4a10, (H) Pla2g12a, (I) Cset, (J) Fabp1, (K) Apoa1, (L) Avpr1a, (M) Pparα, (N) Pparδ, and (O) Pparγ were evaluated. Data shown are means (± SE) of 5 mice/group. Statistical significance, relative to 0% vehicle control (VC), was determined by one-way ANOVA with a dunnett’s post-test (PFHpS) or a t-test (PFOS) where *p < 0.05, **p < 0.01, ***p < 0.001. Kruskal-wallis with dunn’s post-test was conducted for Serpine1 and pparγ due to unequal variance.
Figure 5.
Figure 5.
Liver gene expression following dermal exposure to PFHpS. Gene expression in the liver following 28 days of PFHpS exposure. Changes in (A) Acox1, (B) Cd36, (C) Lpl, (D) Ehhadh, (E) Serpine1, (F) Cpt1b, (G) Cyp4a10, (H) Pla2g12a, (I) Cset, (J) Fabp1, (K) Apoa1, (L) Avpr1a, (M) Pparα, (N) Pparδ, and (O) Pparγ were evaluated. Data shown are means (± SE) of 5 mice/group. Statistical significance, relative to 0% vehicle control (VC), was determined by one-way ANOVA with a dunnett’s post-test (PFHpS) or a t-test (PFOS) where *p < 0.05, **p < 0.01, ***p < 0.001. Kruskal-wallis with dunn’s post-test was conducted for Serpine1 and pparγ due to unequal variance.
Figure 6.
Figure 6.
Skin gene expression following dermal exposure to PFHpS or PFOS. Gene expression in the skin following 28 days of PFHpS exposure. Changes in (A) Il-1β, (B) Il-6, (C) Tslp, (D) Cxcl1, (E) Serpine1, (F) S100a8, (G) Pparα, (H) Pparδ, and (I) Pparγ were evaluated. Data shown are means (± SE) of 4–5 mice/group. Statistical significance, relative to 0% vehicle control (VC), was determined by one-way ANOVA with a Dunnett’s post-test (PFHpS) or a t-test (PFOS) where *p < 0.05, **p < 0.01, ***p < 0.001. Kruskal–wallis with a Dunn’s post-test was conducted for Il-1β, tslp, Serpine1, S100a8, and pparα due to unequal variance.
Figure 7.
Figure 7.
Skin barrier gene expression following dermal exposure to PFHpS or PFOS. Gene expression in the skin following 28 days of PFHpS exposure. Changes in (A) Flg2, (B) Itgbl1, (C) Lor, (D) Flg, (E) Krt10, and (F) Krt14 were evaluated. Data shown are means (± SE) of 5 mice/group. Statistical significance relative to 0% vehicle control (VC) was determined by one-way ANOVA with a dunnett’s post-test (PFHpS) or a t-test (PFOS) where *p < 0.05, **p < 0.01, ***p < 0.001.
Figure 8.
Figure 8.
Skin phenotyping following dermal exposure to PFHpS. Phenotyping in the ear following 28 days of PFHpS exposure. Changes in total (A) cells, (B) eosinophils, (C) CD11b DC, and (D) CD8+ T-cells were evaluated and quantified via flow cytometry. Statistical significance relative to 0% vehicle control (VC) was determined by one-way ANOVA with a Dunnett’s post-test (PFHpS) or a t-test (PFOS) where *p < 0.05, **p < 0.01, ***p < 0.001.
Figure 9.
Figure 9.
Spleen phenotyping following dermal exposure to PFHpS. Phenotyping in the spleen following 28 days of PFHpS exposure. Changes in total (A) cells, (B) B-cells, (C) CD4+ T-cells, and (D) CD8+ T-cells were evaluated and quantified via flow cytometry. Statistical significance, relative to 0% vehicle control (VC), was determined by one-way ANOVA with a Dunnett’s post-test (PFHpS) or a t-test (PFOS) where *p < 0.05, **p < 0.01, ***p < 0.001.
Figure 10.
Figure 10.
Spleen gene expression following dermal exposure to PFHpS or PFOS. Gene expression in the spleen following 28 days of PFHpS exposure. Changes in (A) Tlr5, (B) Tlr6, (C) Tlr7, (D) Tlr8, (E) Abcg1, and (F) Il-10 were evaluated. Data shown are means (± SE) of 5 mice/group. Statistical significance, relative to 0% vehicle control (VC), was determined by one-way ANOVA with Dunnett’s post-test (PFHpS) or a t-test (PFOS) where *p < 0.05, **p < 0.01, ***p < 0.001. Kruskal-wallis with Dunn’s post-test was conducted for Tlr5, Tlr8, and Abcg1 due to unequal variance.
Figure 11.
Figure 11.
Dermal PFHpS and PFOS exposure suppresses the spleen IgM response to SRBC. Analysis of antibody producing spleen cells after a 10-day dermal exposure to PFHpS suppressed the (A) specific activity and (B) total activity, but not (C) serum IgM response to SRBC. Bars shown are mean fold-change (± SE) of 4–5 mice/group. Statistical significance, relative to 0% vehicle control, was determined by one-way ANOVA followed by Dunnett’s post-test (PFHpS) or a t-test (PFOS) indicated as *p < 0.05, **p < 0.01, ***p < 0.001.

References

    1. Aas C, Fuglei E, Herzke D, Yoccoz N, Routti H. 2014. Effect of body condition on tissue distribution of perfluoroalkyl substances (PFASs) in arctic fox (Vulpes lagopus). Environ Sci Technol. 48(19):11654–11661. doi: 10.1021/es503147n. - DOI - PubMed
    1. Anderson S, Meade B. 2014. Potential health effects associated with dermal exposure to occupational chemicals. Environ Health Insights. 8(Suppl 1): 51–62. doi: 10.4137/EHI.S15258. - DOI - PMC - PubMed
    1. Anderson S, Franko J, Anderson K, Munson A, Lukomska E, Meade B. 2013. Immunotoxicity and allergic potential induced by topical application of dimethyl carbonate (DMC) in a murine model. J Immunotoxicol. 10(1): 59–66. doi: 10.3109/1547691X.2012.691124. - DOI - PMC - PubMed
    1. ATSDR (Agency for Toxic Substances and Disease Registry). 2021. Toxicological profile for perfluoroalkyls. Atlanta, GA. https://wwwn.cdc.gov/TSP/ToxProfiles/ToxProfiles.aspx?id=1117&tid=237. - PubMed
    1. Averina M, Brox J, Huber S, Furberg A. 2018. Perfluoroalkyl substances in adolescents in northern Norway: Lifestyle and dietary predictors. The Tromso study, fit futures 1. Environ Int. 114:123–130. doi: 10.1016/j.envint.2018.02.031. - DOI - PubMed

Publication types

MeSH terms

LinkOut - more resources