. 2024 Dec;19(1):2380930.
doi: 10.1080/15592294.2024.2380930. Epub 2024 Jul 27.

Folate-mediated transgenerational inheritance of sperm DNA methylation patterns correlate with spinal axon regeneration

Affiliations

Folate-mediated transgenerational inheritance of sperm DNA methylation patterns correlate with spinal axon regeneration

Andy Madrid et al. Epigenetics. 2024 Dec.

Erratum in

  • Correction.
    [No authors listed] [No authors listed] Epigenetics. 2024 Dec;19(1):2388387. doi: 10.1080/15592294.2024.2388387. Epub 2024 Aug 4. Epigenetics. 2024. PMID: 39097935 Free PMC article. No abstract available.

Abstract

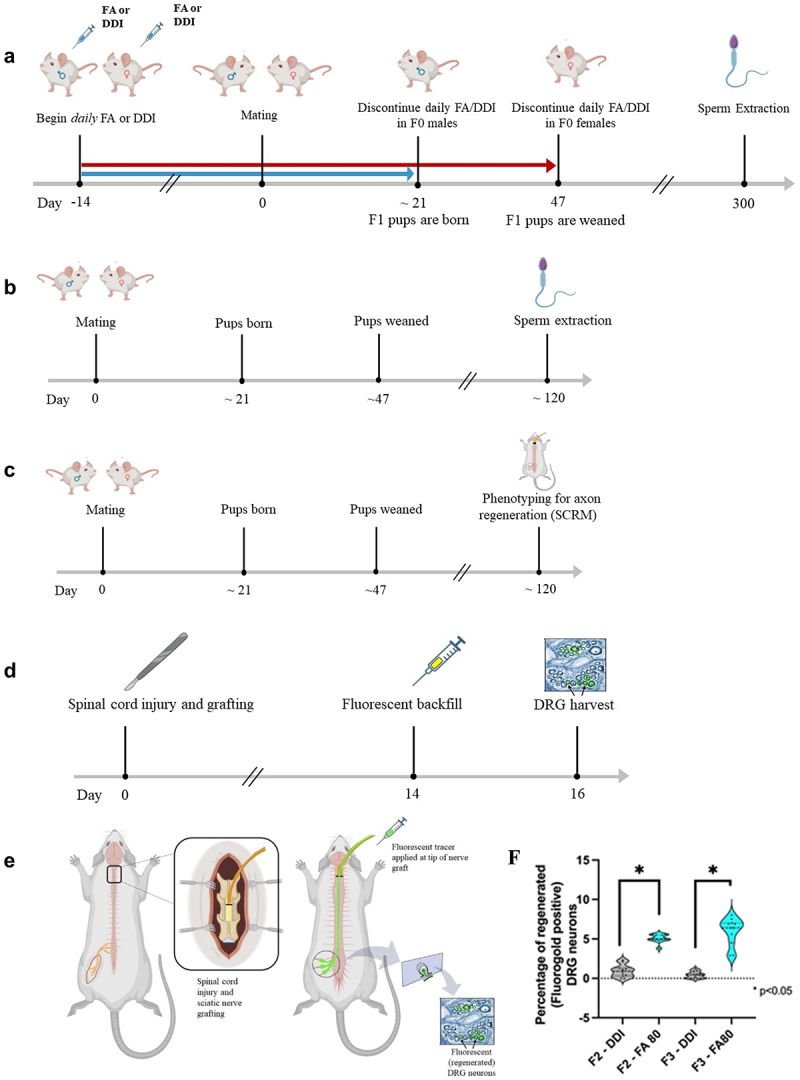
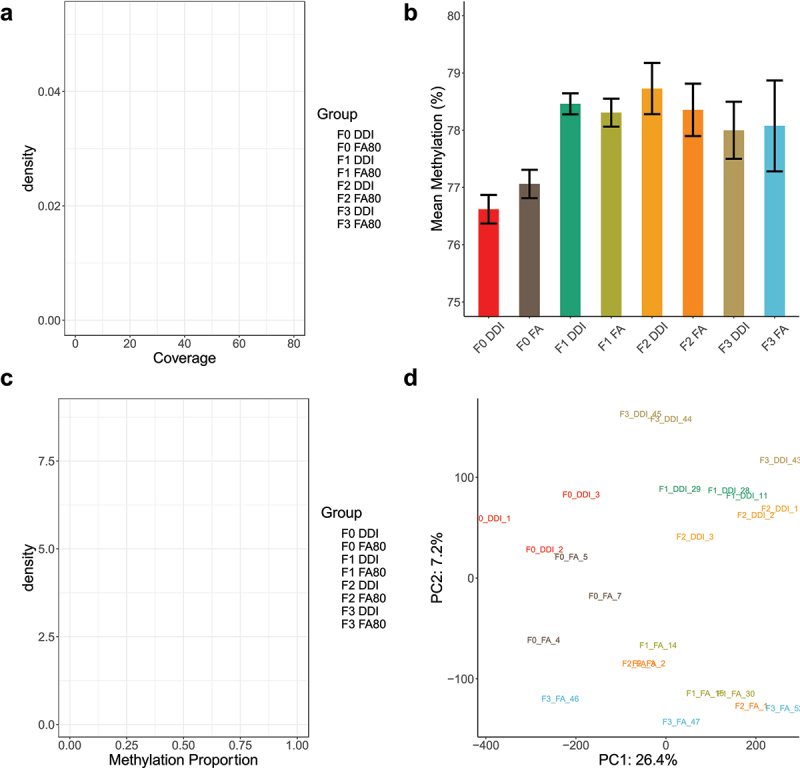
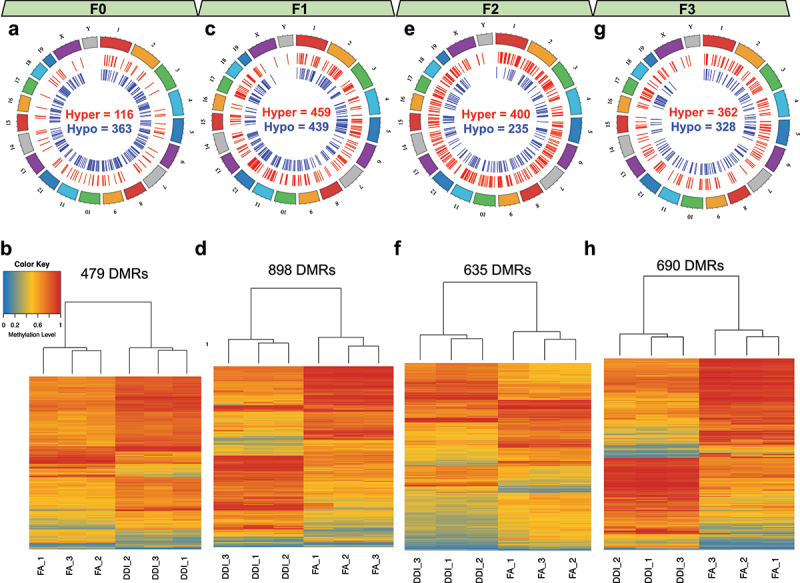
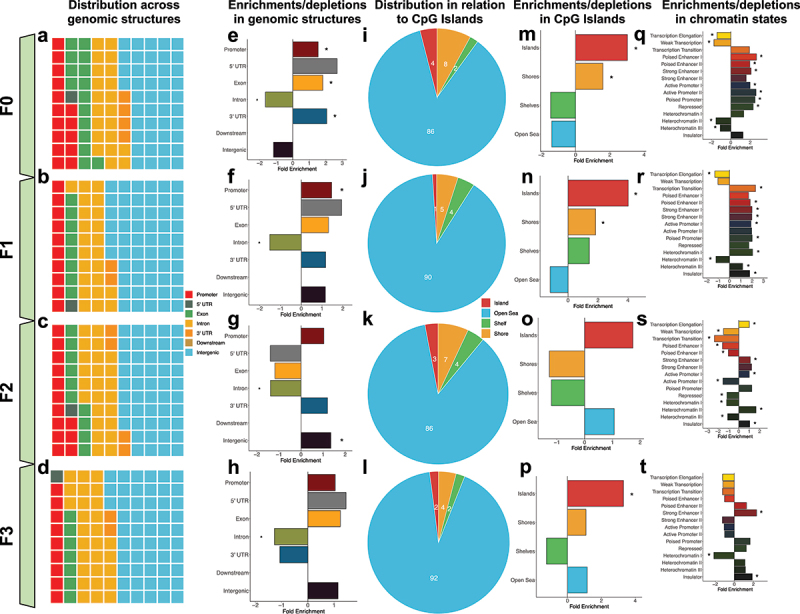
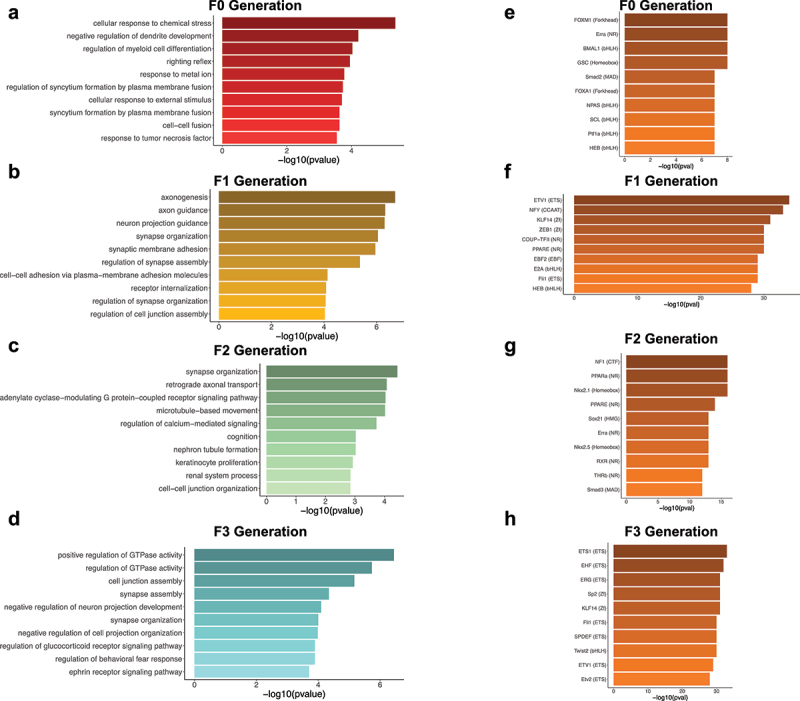
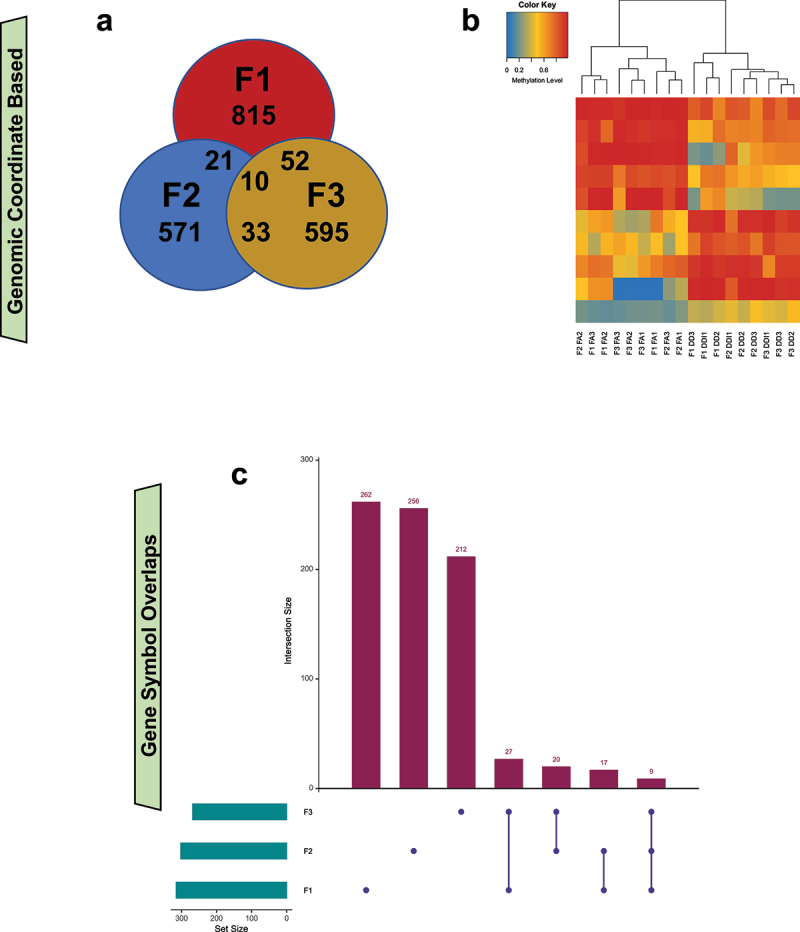
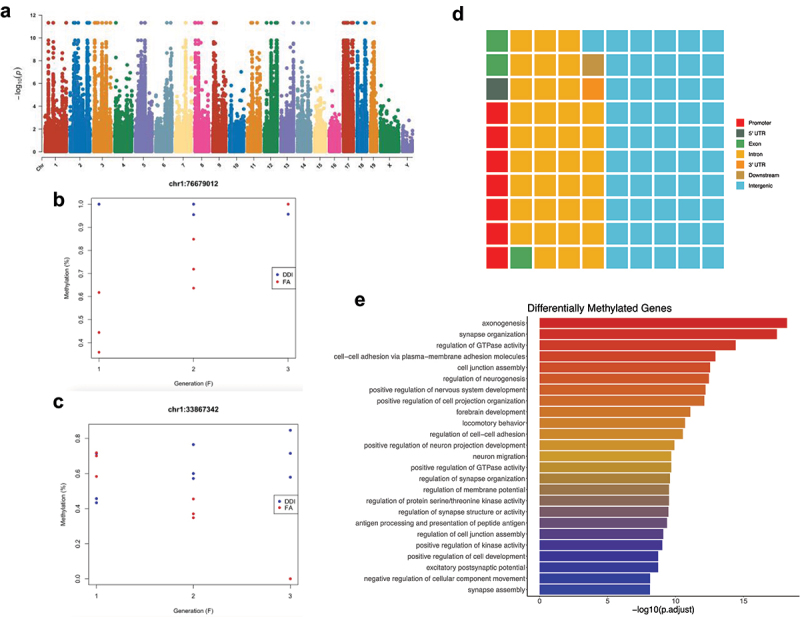
In mammals, the molecular mechanisms underlying transgenerational inheritance of phenotypic traits in serial generations of progeny after ancestral environmental exposures, without variation in DNA sequence, remain elusive. We've recently described transmission of a beneficial trait in rats and mice, in which F0 supplementation of methyl donors, including folic acid, generates enhanced axon regeneration after sharp spinal cord injury in untreated F1 to F3 progeny linked to differential DNA methylation levels in spinal cord tissue. To test whether the transgenerational effect of folic acid is transmitted via the germline, we performed whole-genome methylation sequencing on sperm DNA from F0 mice treated with either folic acid or vehicle control, and their F1, F2, and F3 untreated progeny. Transgenerational differentially methylated regions (DMRs) are observed in each consecutive generation and distinguish folic acid from untreated lineages, predominate outside of CpG islands and in regions of the genome that regulate gene expression, including promoters, and overlap at both the differentially methylated position (DMP) and gene levels. These findings indicate that molecular changes between generations are caused by ancestral folate supplementation. In addition, 29,719 DMPs exhibit serial increases or decreases in DNA methylation levels in successive generations of untreated offspring, correlating with a serial increase in the phenotype across generations, consistent with a 'wash-in' effect. Sibship-specific DMPs annotate to genes that participate in axon- and synapse-related pathways.

Keywords: CNS regeneration; Folic acid; spinal cord injury; transgenerational epigenetic inheritance; whole genome methylation sequencing (WGMS).


Conflict of interest statement

No potential conflict of interest was reported by the author(s).

Figures

Figure 1.
Figure 1.
Breeding paradigm, axon regeneration phenotyping, and sperm DNA extraction. (a) timeline of the F0 breeding paradigm and sperm extraction. Male and female F0 animals were treated with daily injections of folic acid (FA) or DDI vehicle control starting two weeks before mating; the injections were discontinued 1) in the males when the F1 pups were born and 2) in the females when the pups were weaned. Sperm was extracted from the F0 animals after breeding, and DNA was extracted and used for whole-genome methylation sequencing (WGMS). (b) Timeline of the F1–F3 breeding paradigm and sperm harvest. Untreated F1, F2, and F3 animals were generated from the F0 lineage. Sperm was harvested from adult F1, F2, and F3 animals (n = 3), and DNA was extracted and used for WGMS. (c) Timeline for axon regeneration phenotyping (SCRM). (d, e) Details of SCRM in F2 and F3 male mice: Animals undergo bilateral C3 dorsal column transection and implantation of a sciatic nerve graft at the injury site. Two weeks later, a florescent tracer is applied to the free end of the graft (green arrow). The ends of the axons that have extended into the graft (i.e. regenerated) ipsilateral to sciatic nerve harvest take up the tracer, which is detected 48 h later in the corresponding lumbar DRG neuron cell bodies. The L4-L6 DRGs were harvested 2 days later. The fluorescent tracer is seen only in regenerated DRG neurons. (f) Intraperitoneal (IP) folic acid supplementation of F0 progenitors enhances spinal axon regeneration in untreated F2 and F3 male progeny. Percentage of regenerated DRG neurons in untreated offspring (F2–F3) descending from F0 progenitors treated with folic acid vs. DDI control. The figure shows responses to test compounds by group and by generation as violin plots. Comparisons of differences within generations were made using the Wilcoxon rank-sum test, and statistical significance was reported as p < 0.05 (FA-turquoise, DDI-grey: F2 FA: n = 10, F2 DDI: n = 11, F3 FA: n = 11, F3 DDI: n = 13).
Figure 2.
Figure 2.
Global DNA methylation in transgenerational sperm specimens show no significant changes in total methylation levels in untreated generations. (a) A density plot depicts the average read coverage (x-axis) for each of the experimental groups. Coverage depicts the number of sequencing reads covering a given CpG across the genome after collapsing across the 2 DNA strands. Experimental groups are colour-coordinated. (b) A bar plot shows the average genome-wide methylation abundance (%) (y-axis) of biological replicates across all experimental groups and generations (x-axis). (c) A density plot displays the distribution of methylation values (x-axis) and their density (y-axis) of all the tested CpG sites. The distribution of methylation abundance is bimodal, with peaks at 0 (unmethylated) and 1 (fully methylated). Experimental groups are colour-coordinated. (d) A plot shows the distribution of samples plotted against the first 2 principal components following principal component analysis using methylated values from all tested CpG sites.
Figure 3.
Figure 3.
Transgenerational DMRs after F0 exposure to folic acid are found in each consecutive generation and are able to distinguish DDI- from FA-lineage specimens. (a, c, e, g) Circos plots depict the relative location of DMRs distributed across the genome in the F0 generation (a), the F1 generation (c), the F2 generation (e), and the F3 generation (g). Hypermethylated DMRs are shown in red. Hypomethylated DMRs are shown in blue. (b, d, f, h) Heatmaps show the unsupervised hierarchical clustering of tested samples as determined using the DNA methylation levels from CpGs contained within identified generational DMRs for the F0 generation (b), the F1 generation (d), the F2 generation (f), and the F3 generation (h). Low methylation is depicted in blue. High methylation is depicted in red.
Figure 4.
Figure 4.
Transgenerational DMRs are found in regions of the genome known to regulate gene expression, including promoters and in CpG islands. (A-D) Waffle plots show the relative proportion of DMRs located in each of the standard genomic features for each of the tested generations. Genomic features are colour-coordinated. (E-H) Bar plots show the fold enrichment (x-axis) of the transgenerational DMRs, relative to background regions, for each of the genomic features (y-axis). Significant enrichments/depletions are depicted by an asterisk (*) (adjusted P-value <0.05; Fisher’s exact test). (I-L) Pie charts show the proportions of transgenerational DMRs based on their locations relative to CpG islands. DMRs were determined to be either in CpG islands (red), on the shores of CpG islands (yellow), the shelves of CpG islands (green), or distal to CpG islands in the open sea (blue). (M-P). Bar plots show the fold enrichment (x-axis) of the transgenerational DMRs, relative to background regions, for each of the CpG island features (y-axis). Significant enrichments/depletions are depicted by an asterisk (*) (adjusted P-value <0.05; Fisher’s exact test). (Q-T)) Bar plots show the fold enrichment (x-axis) of the transgenerational DMRs, relative to background regions, for each of the varying 15-chromatin states previously identified in the mouse genome (y-axis). Significant enrichments/depletions are depicted by an asterisk (*) (adjusted P-value <0.05; Fisher’s exact test).
Figure 5.
Figure 5.
Ontological and transcription factor enrichment analyses of transgenerational DMRs identify genes involved in axon- and synapse-related processes and transcription factors. (a-d) Bar plots depict the top 10 ontological terms (y-axis) for enriched biological processes from transgenerational DMR-associated genes in the F0 generation (a), the F1 generation (b), the F2 generation (c), and the F3 generation (d). The x-axis displays the -log10 value of the adjusted P-value (FDR) for each ontological term. (E-H) Bar plots show the top 10 transcription factors (y-axis) with enriched motifs in the transgenerational DMR sequences for the F0 generation (e), the F1 generation (f), the F2 generation (g), and the F3 generation (h). The x-axis displays the -log10 value of the adjusted P-value (FDR) for each enriched transcription factor.
Figure 6.
Figure 6.
Transgenerational DMRs in untreated generations overlap at both DMR location and gene-level, suggesting commonality of molecular changes caused by ancestral FA treatment. (a) A Venn diagram depicts the overlap of DMRs, based on genomic coordinates, from the F1 (red), F2 (blue), and F3 (yellow) generations. (b) A heatmap shows the unsupervised hierarchical clustering of tested samples using the mean DNA methylation levels from the 10 transgenerational DMRs that are identified in all 3 generations. (c) An UpSet plot shows the overlap of transgenerational DMR-associated genes between the generations that were not directly treated (i.e., F1–F3). Green bars show the number of DMR-associated genes for each generation. Purple bars show the number of DMR-associated genes specific to each tested overlap.
Figure 7.
Figure 7.
An interaction model finds molecular evidence of differential DNA methylation in successive F1–F3 generations after ancestral F0 folic acid treatment, with incremental or decremental methylation in 29,719 DMPs. (a) Manhattan plot shows the relative location (x-axis) and significance (y-axis) of the tested CpGs following an analysis of the interaction between groups (i.e., DDI vs FA) and generations (i.e., F1–F3). (b) Plot shows percent DNA methylation (y-axis) of the top DMPs – after ranking by p value – showing increasing methylation levels in FA animals (red) compared to DDI animals (blue) in serial generations (x-axis). (c) Plot shows percent DNA methylation (y-axis) of the top DMPs – after ranking by p value – showing decreasing methylation levels in FA animals (red) compared to DDI animals (blue) in serial generations (x-axis). (d) Waffle plot shows the relative proportion of wash-in DMPs in each of the standard genomic features. Genomic features are colour-coordinated. (e) A bar plot depicts the top 25 enriched ontological terms (y-axis) in genes displaying wash-in DMPs. The x-axis displays the -log10 value of the adjusted P-value (FDR) for each ontological term.

References

    1. Crews D, Gillette R, Scarpino SV, et al. Epigenetic transgenerational inheritance of altered stress responses. PSNS; 2012;109(23):9143–17. - PMC - PubMed
    1. Rahman MS, Pang WK, Ryu DY, et al. Multigenerational and transgenerational impact of paternal bisphenol a exposure on male fertility in a mouse model. Hum Reprod. 2020;35(8):1740–1752. doi: 10.1093/humrep/deaa139 - DOI - PubMed
    1. Nilsson E, Larsen G, Manikkam M, et al. Environmentally induced epigenetic transgenerational inheritance of ovarian disease. PLOS ONE. 2012;7(5):e36129. doi: 10.1371/journal.pone.0036129 - DOI - PMC - PubMed
    1. Korolenko AA, Noll SE, Skinner MK.. Epigenetic inheritance and transgenerational environmental justice. Yale J Biol Med. 2023;96(2):241–250. doi: 10.59249/FKWS5176 - DOI - PMC - PubMed
    1. Madrid A, Borth LE, Hogan KJ, et al. DNA methylation and hydroxymethylation have distinct genome-wide profiles related to axonal regeneration. Epigenetics. 2021;16(1):64–78. doi: 10.1080/15592294.2020.1786320 - DOI - PMC - PubMed