. 2024 Aug 27;43(8):114551.
doi: 10.1016/j.celrep.2024.114551. Epub 2024 Jul 26.

Carcinoma-associated mesenchymal stem cells promote ovarian cancer heterogeneity and metastasis through mitochondrial transfer

Affiliations

Carcinoma-associated mesenchymal stem cells promote ovarian cancer heterogeneity and metastasis through mitochondrial transfer

Leonard Frisbie et al. Cell Rep. .

Abstract

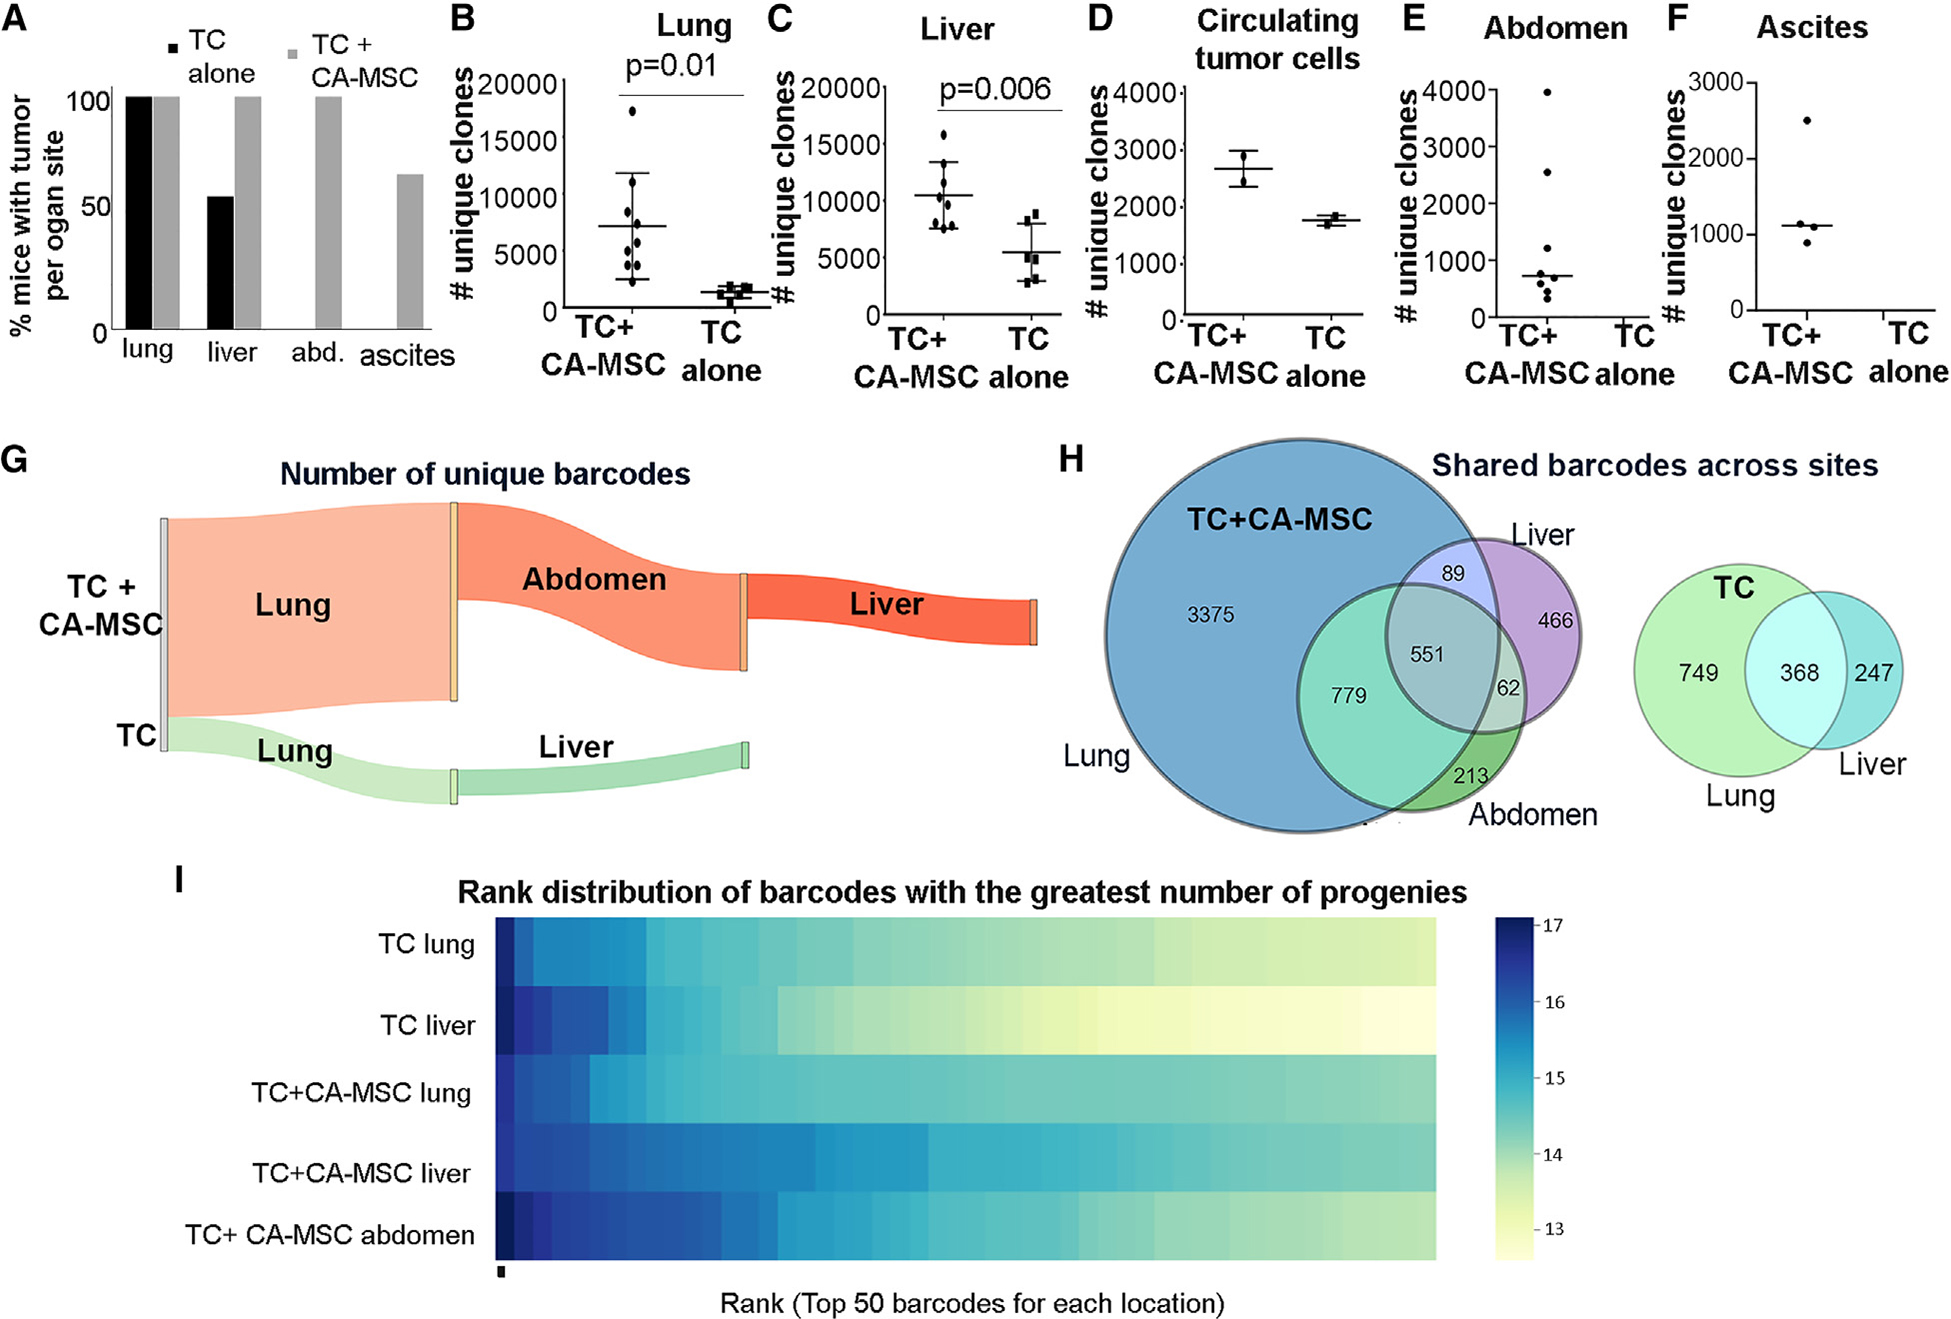
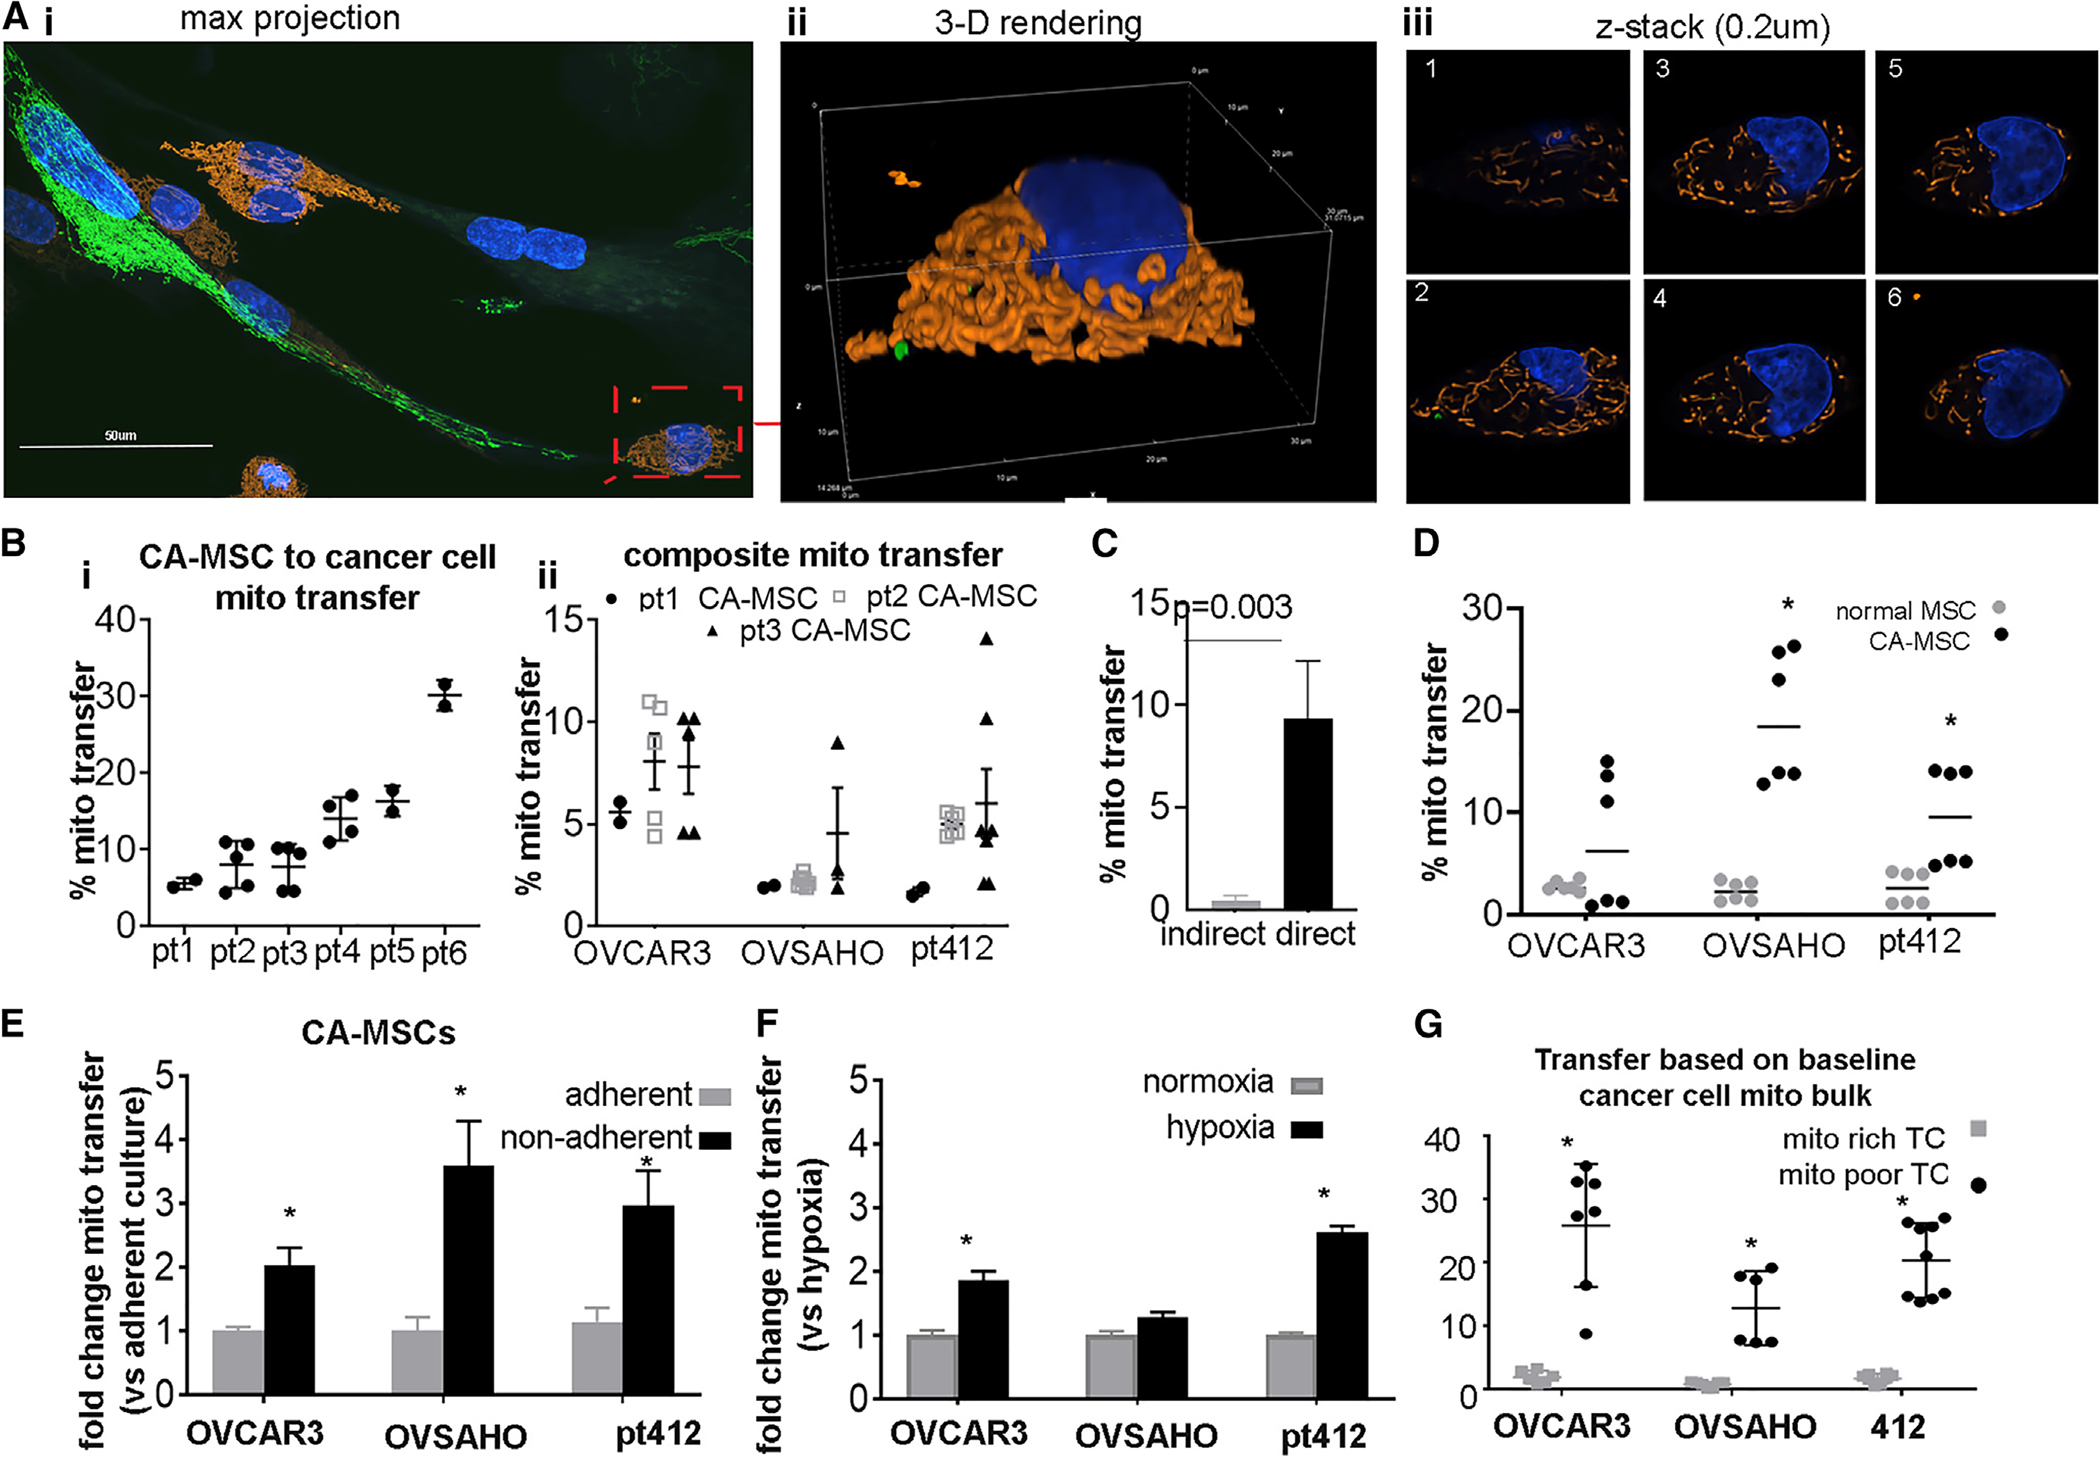
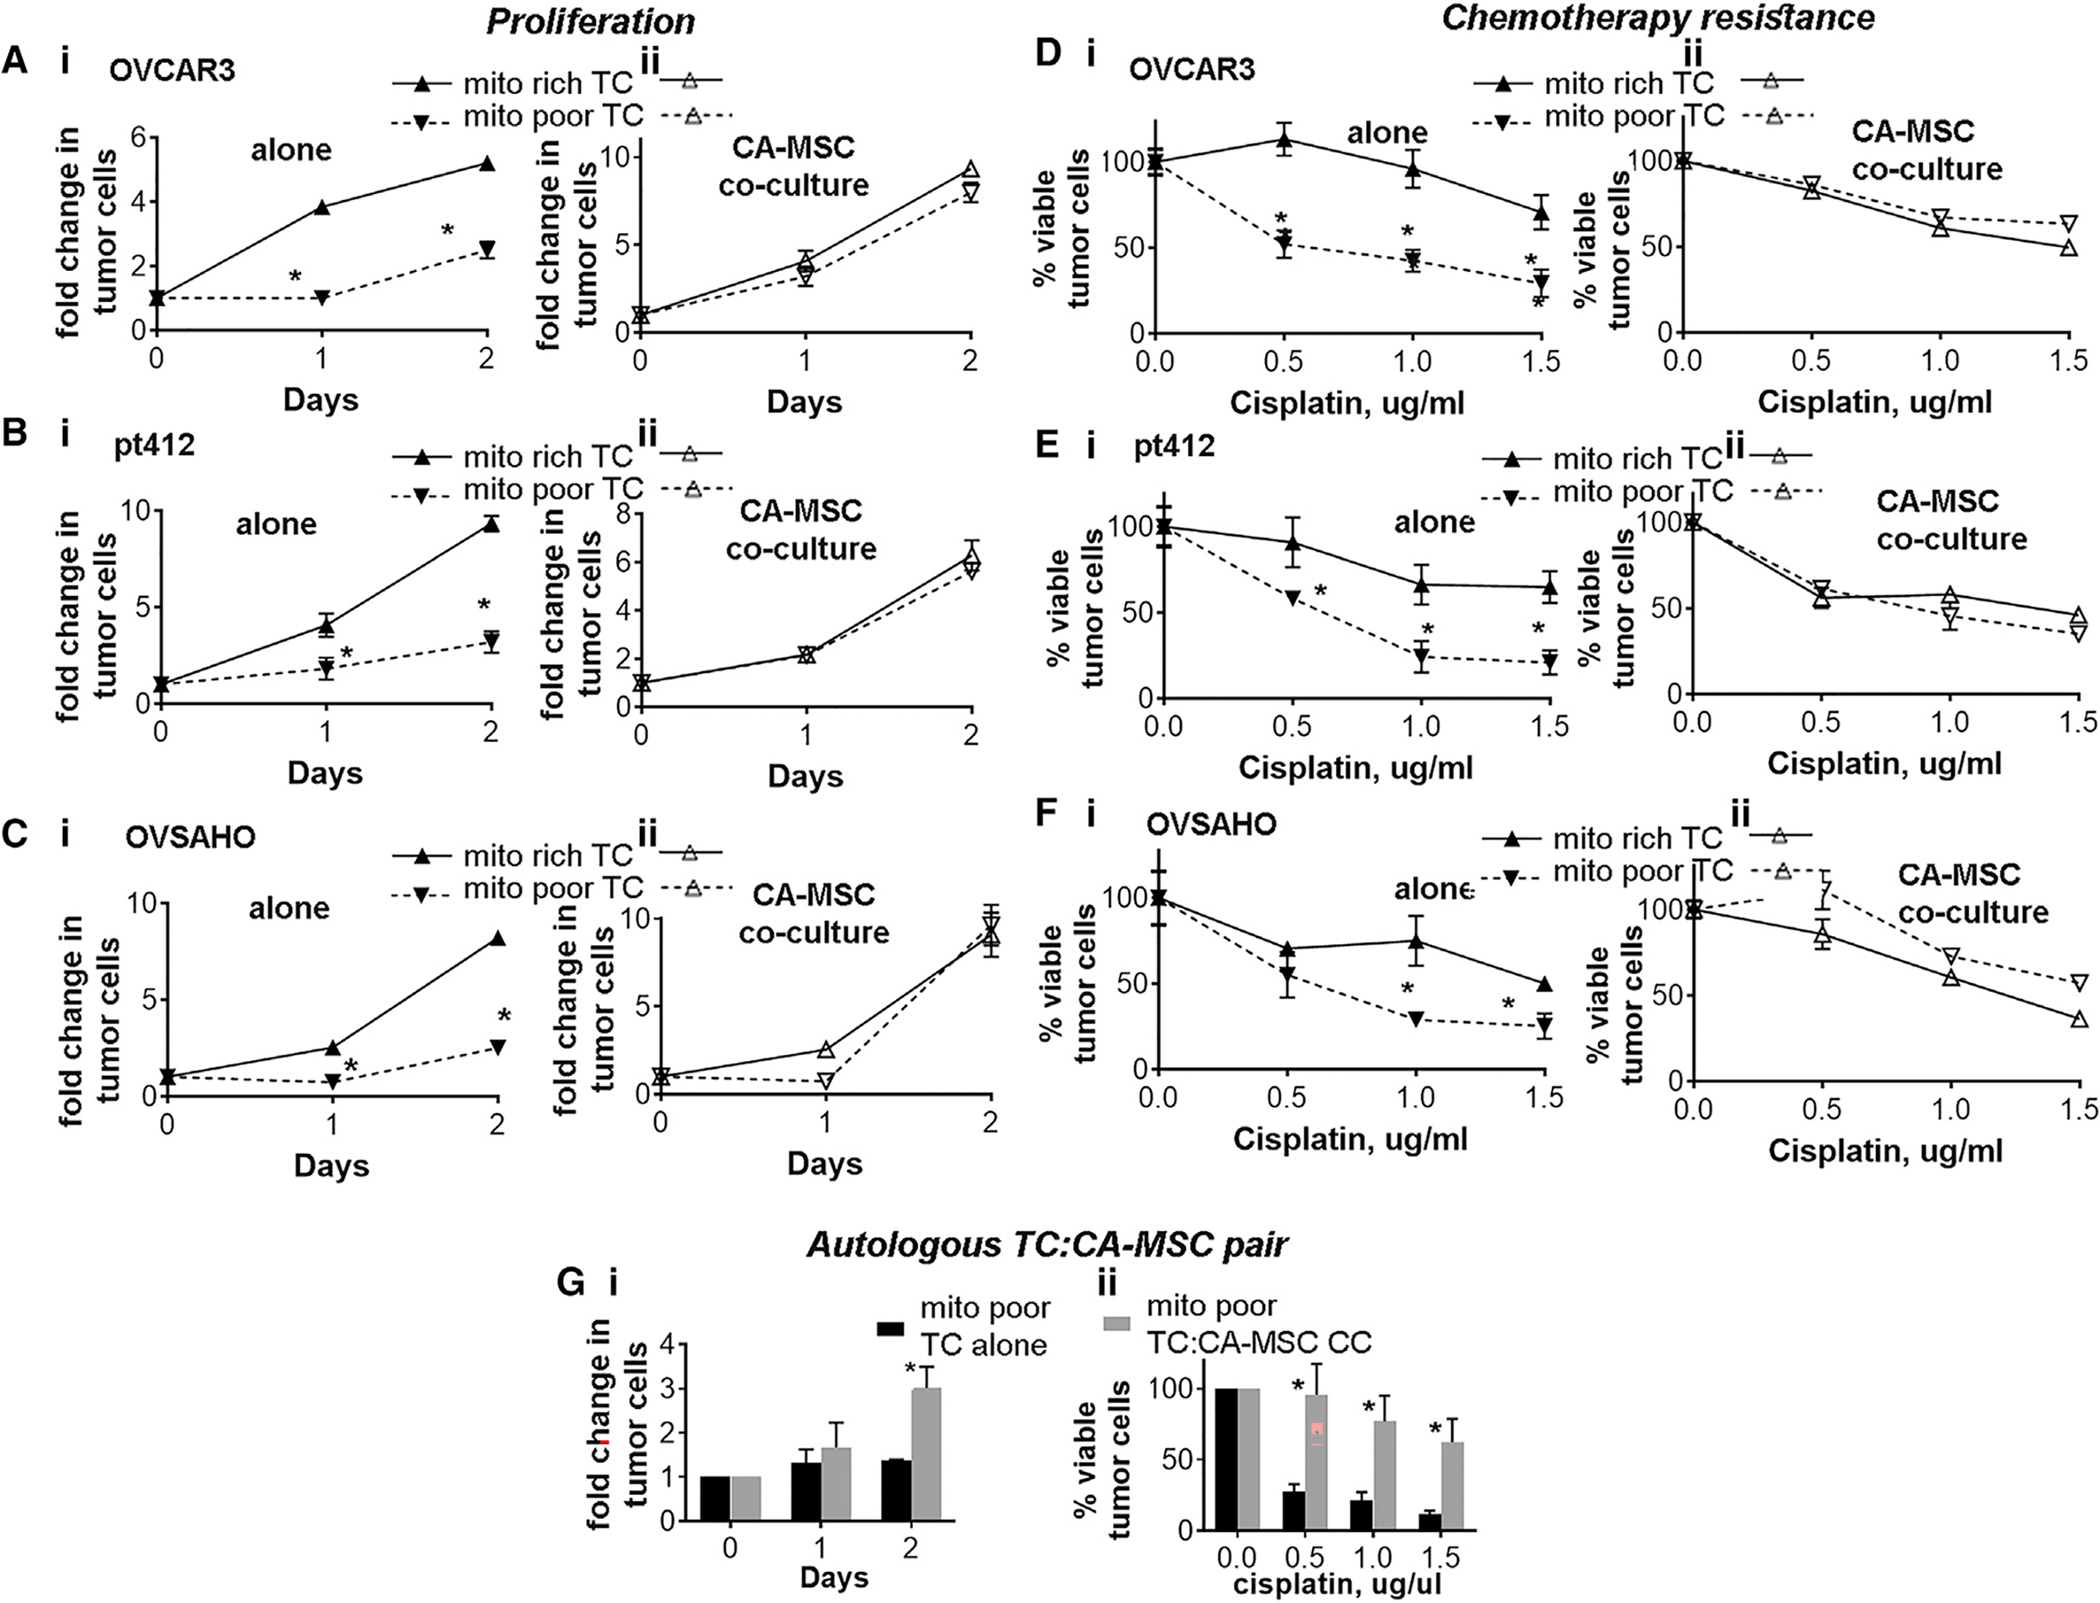
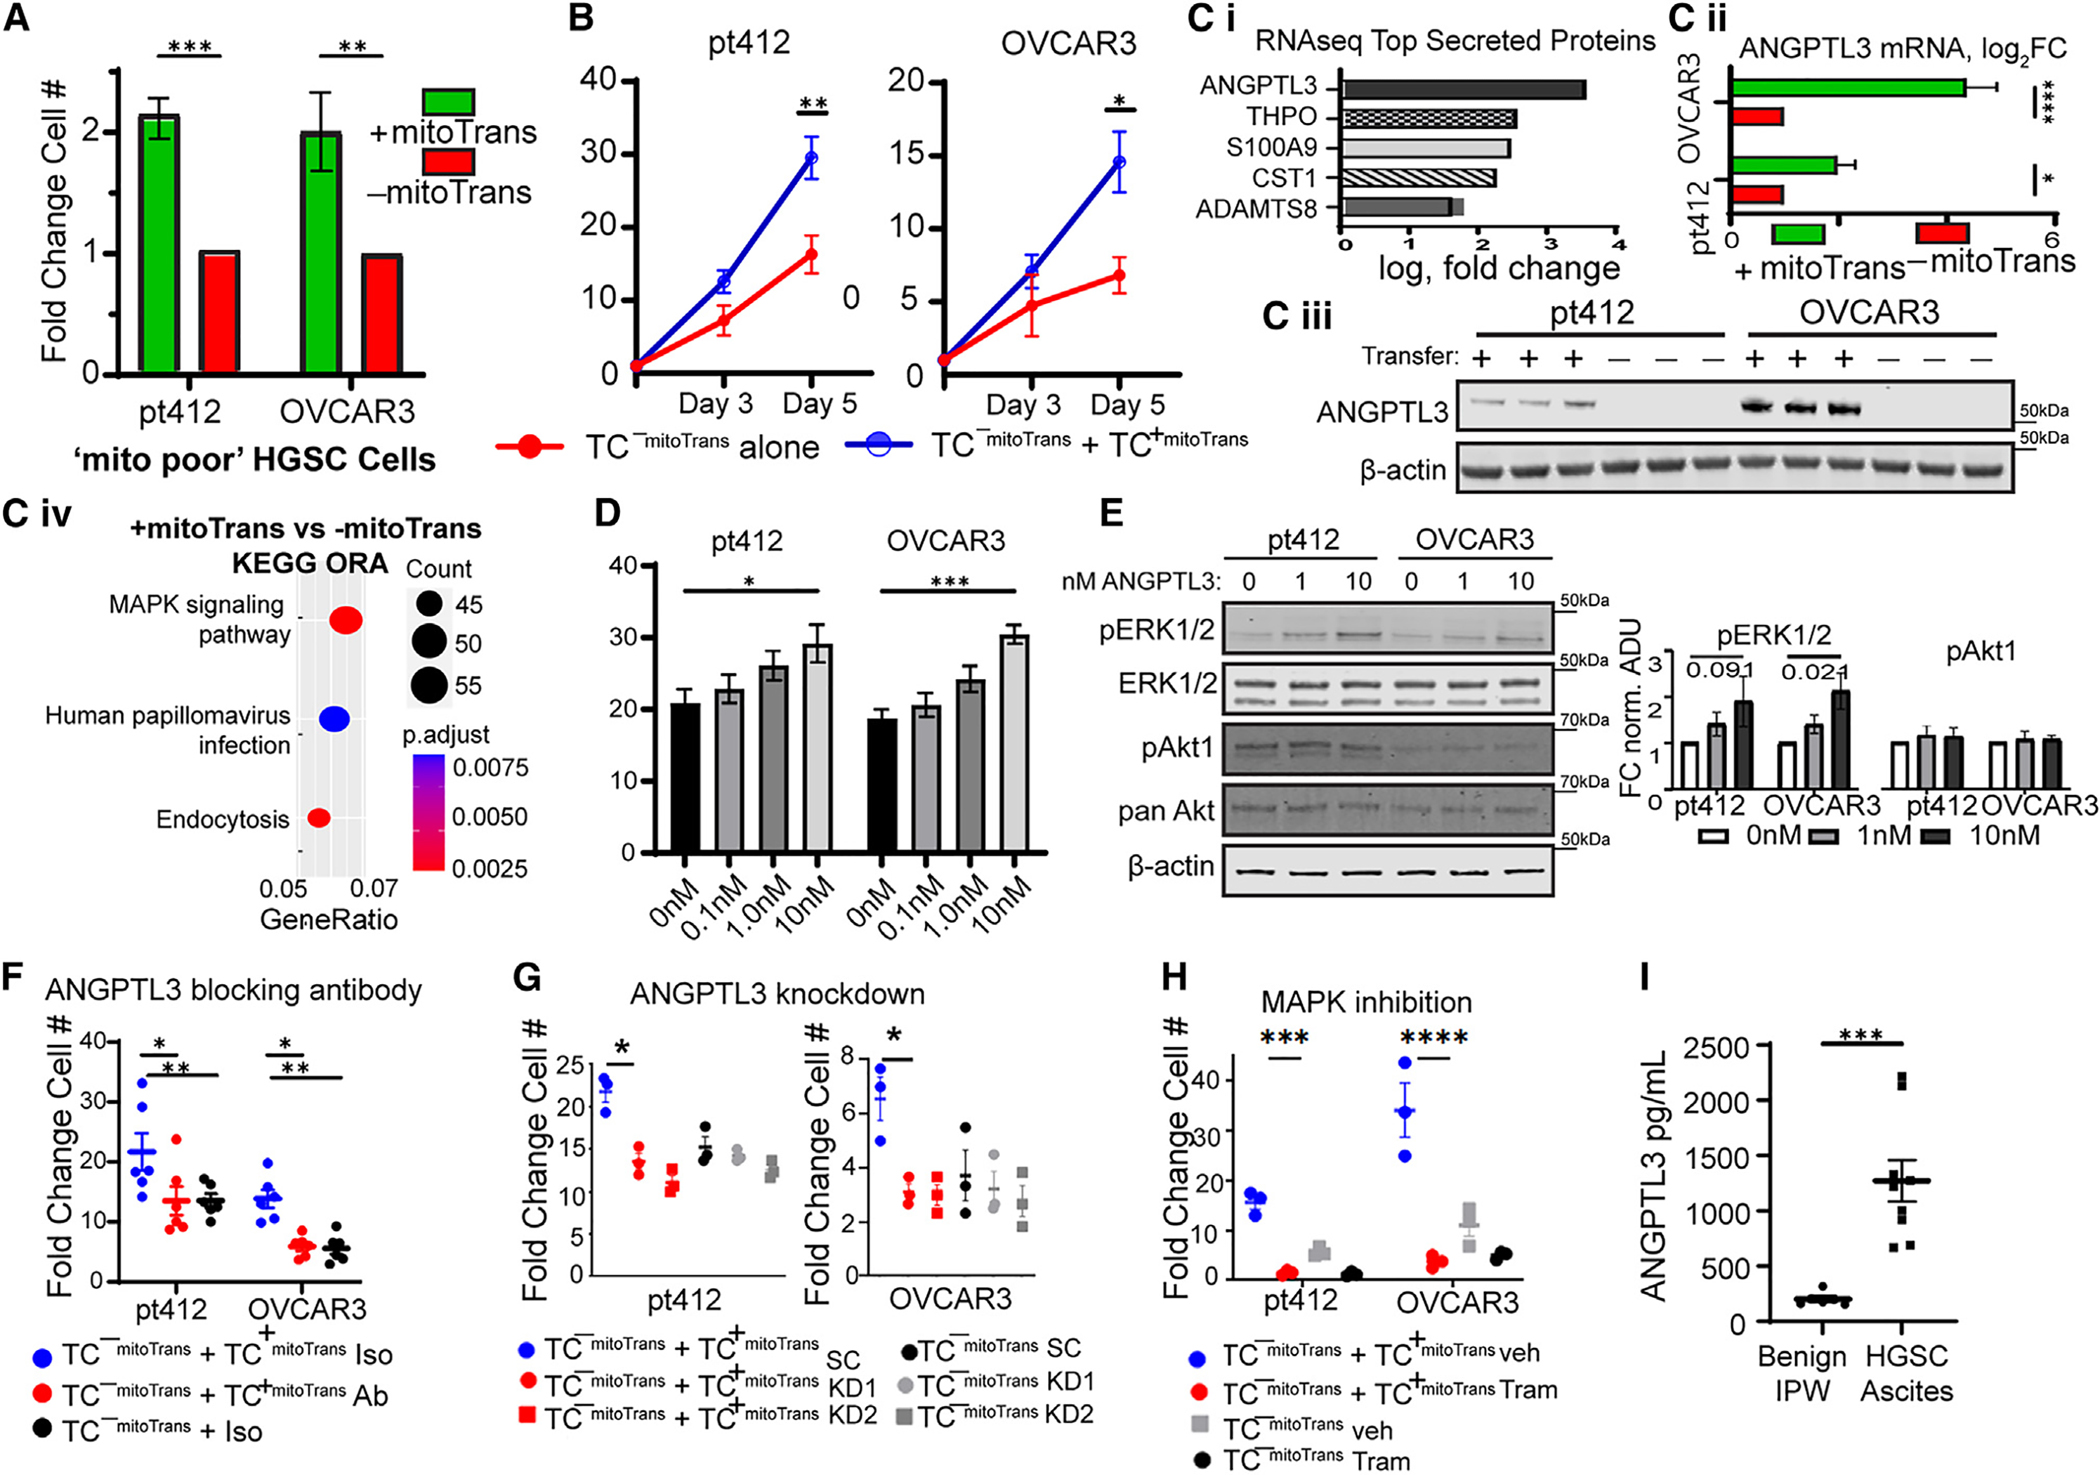
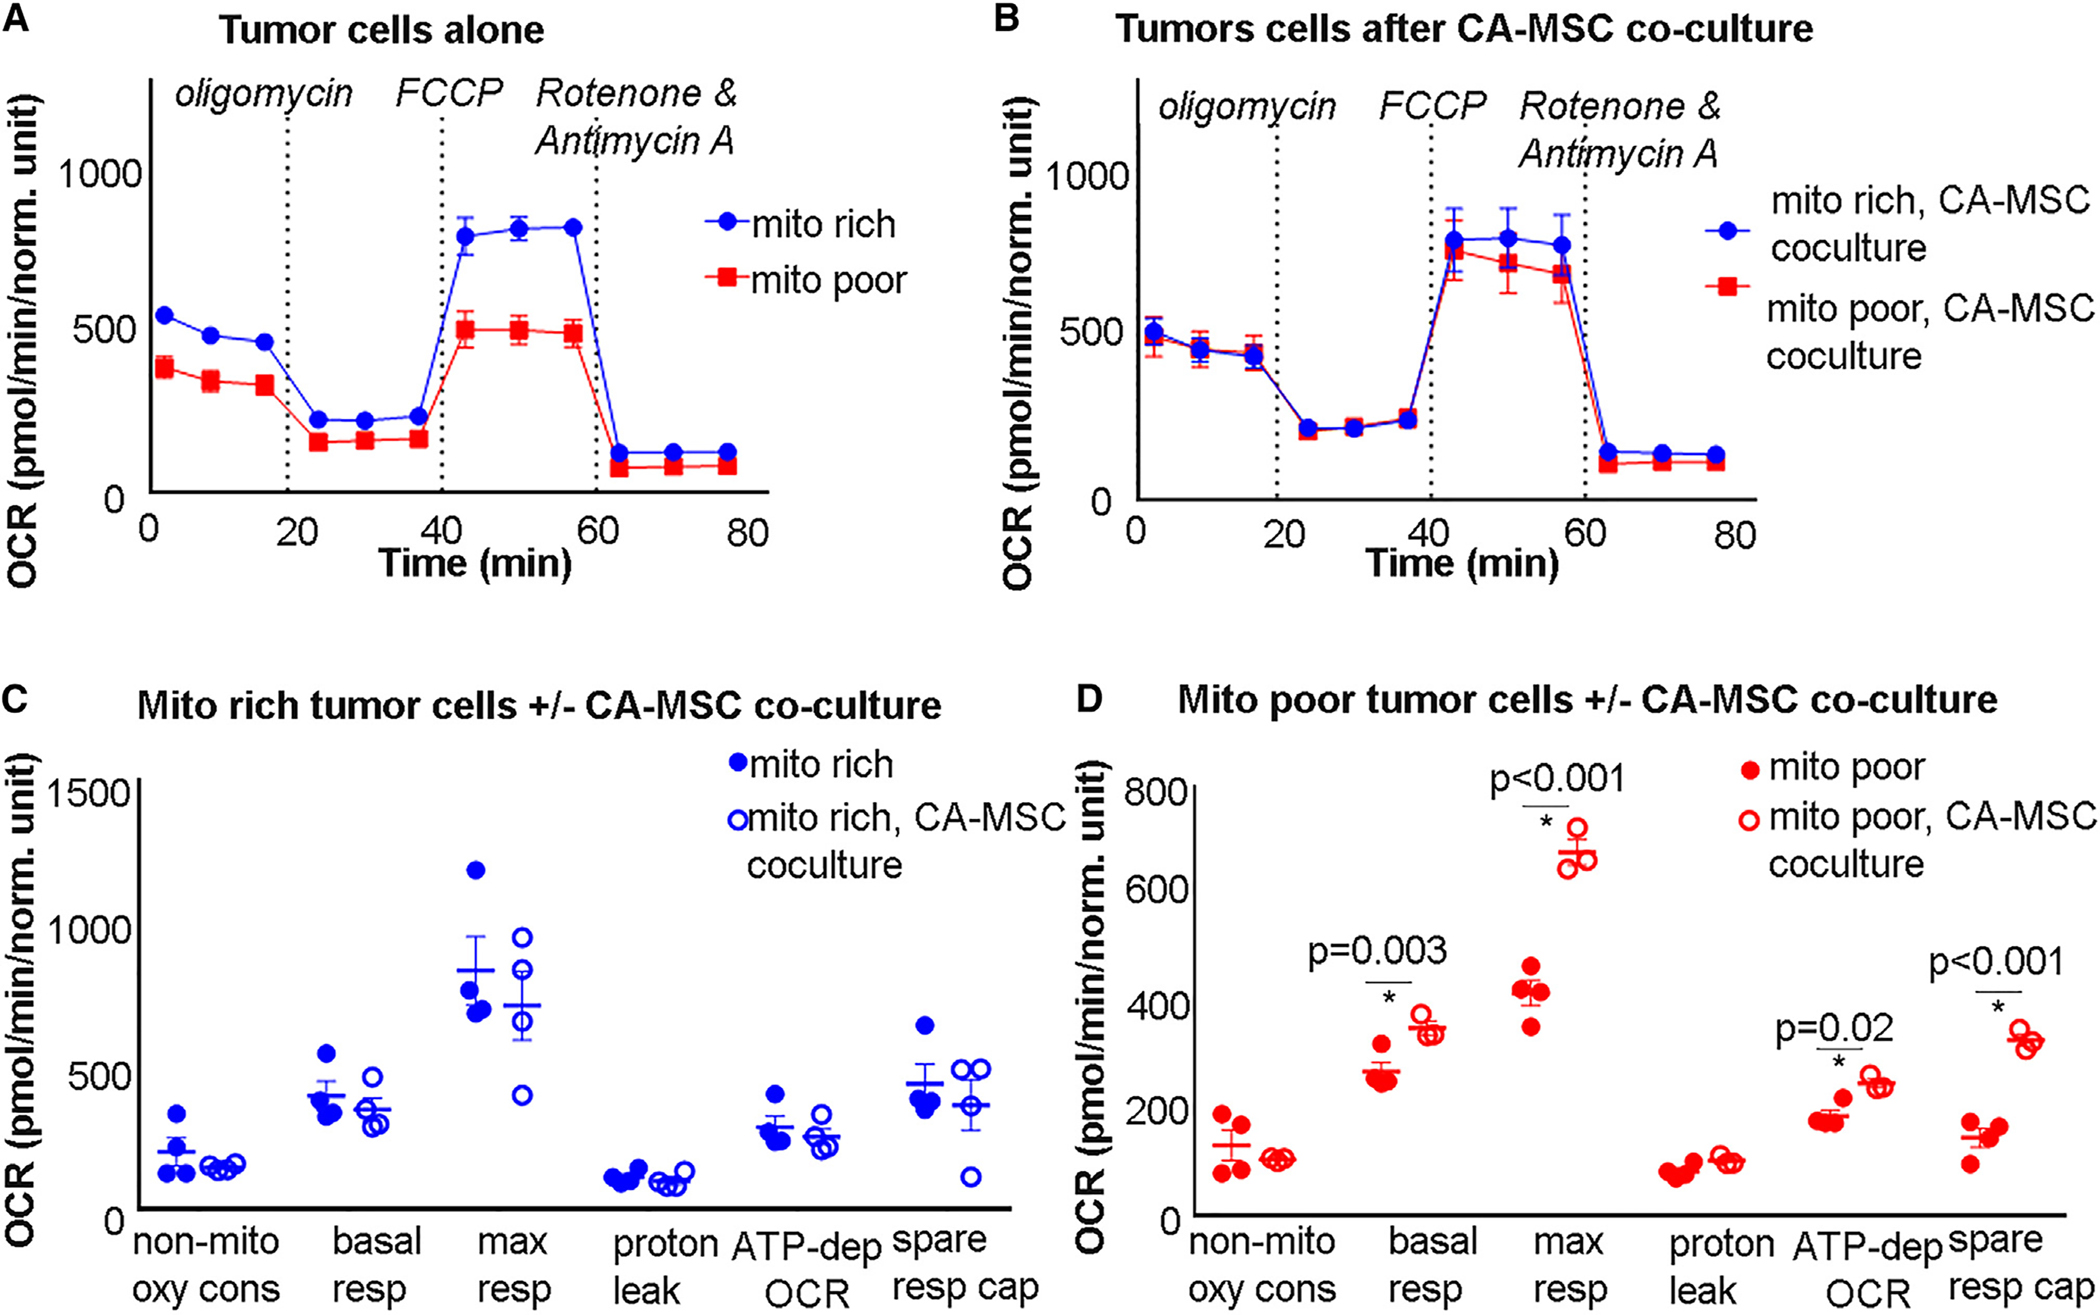
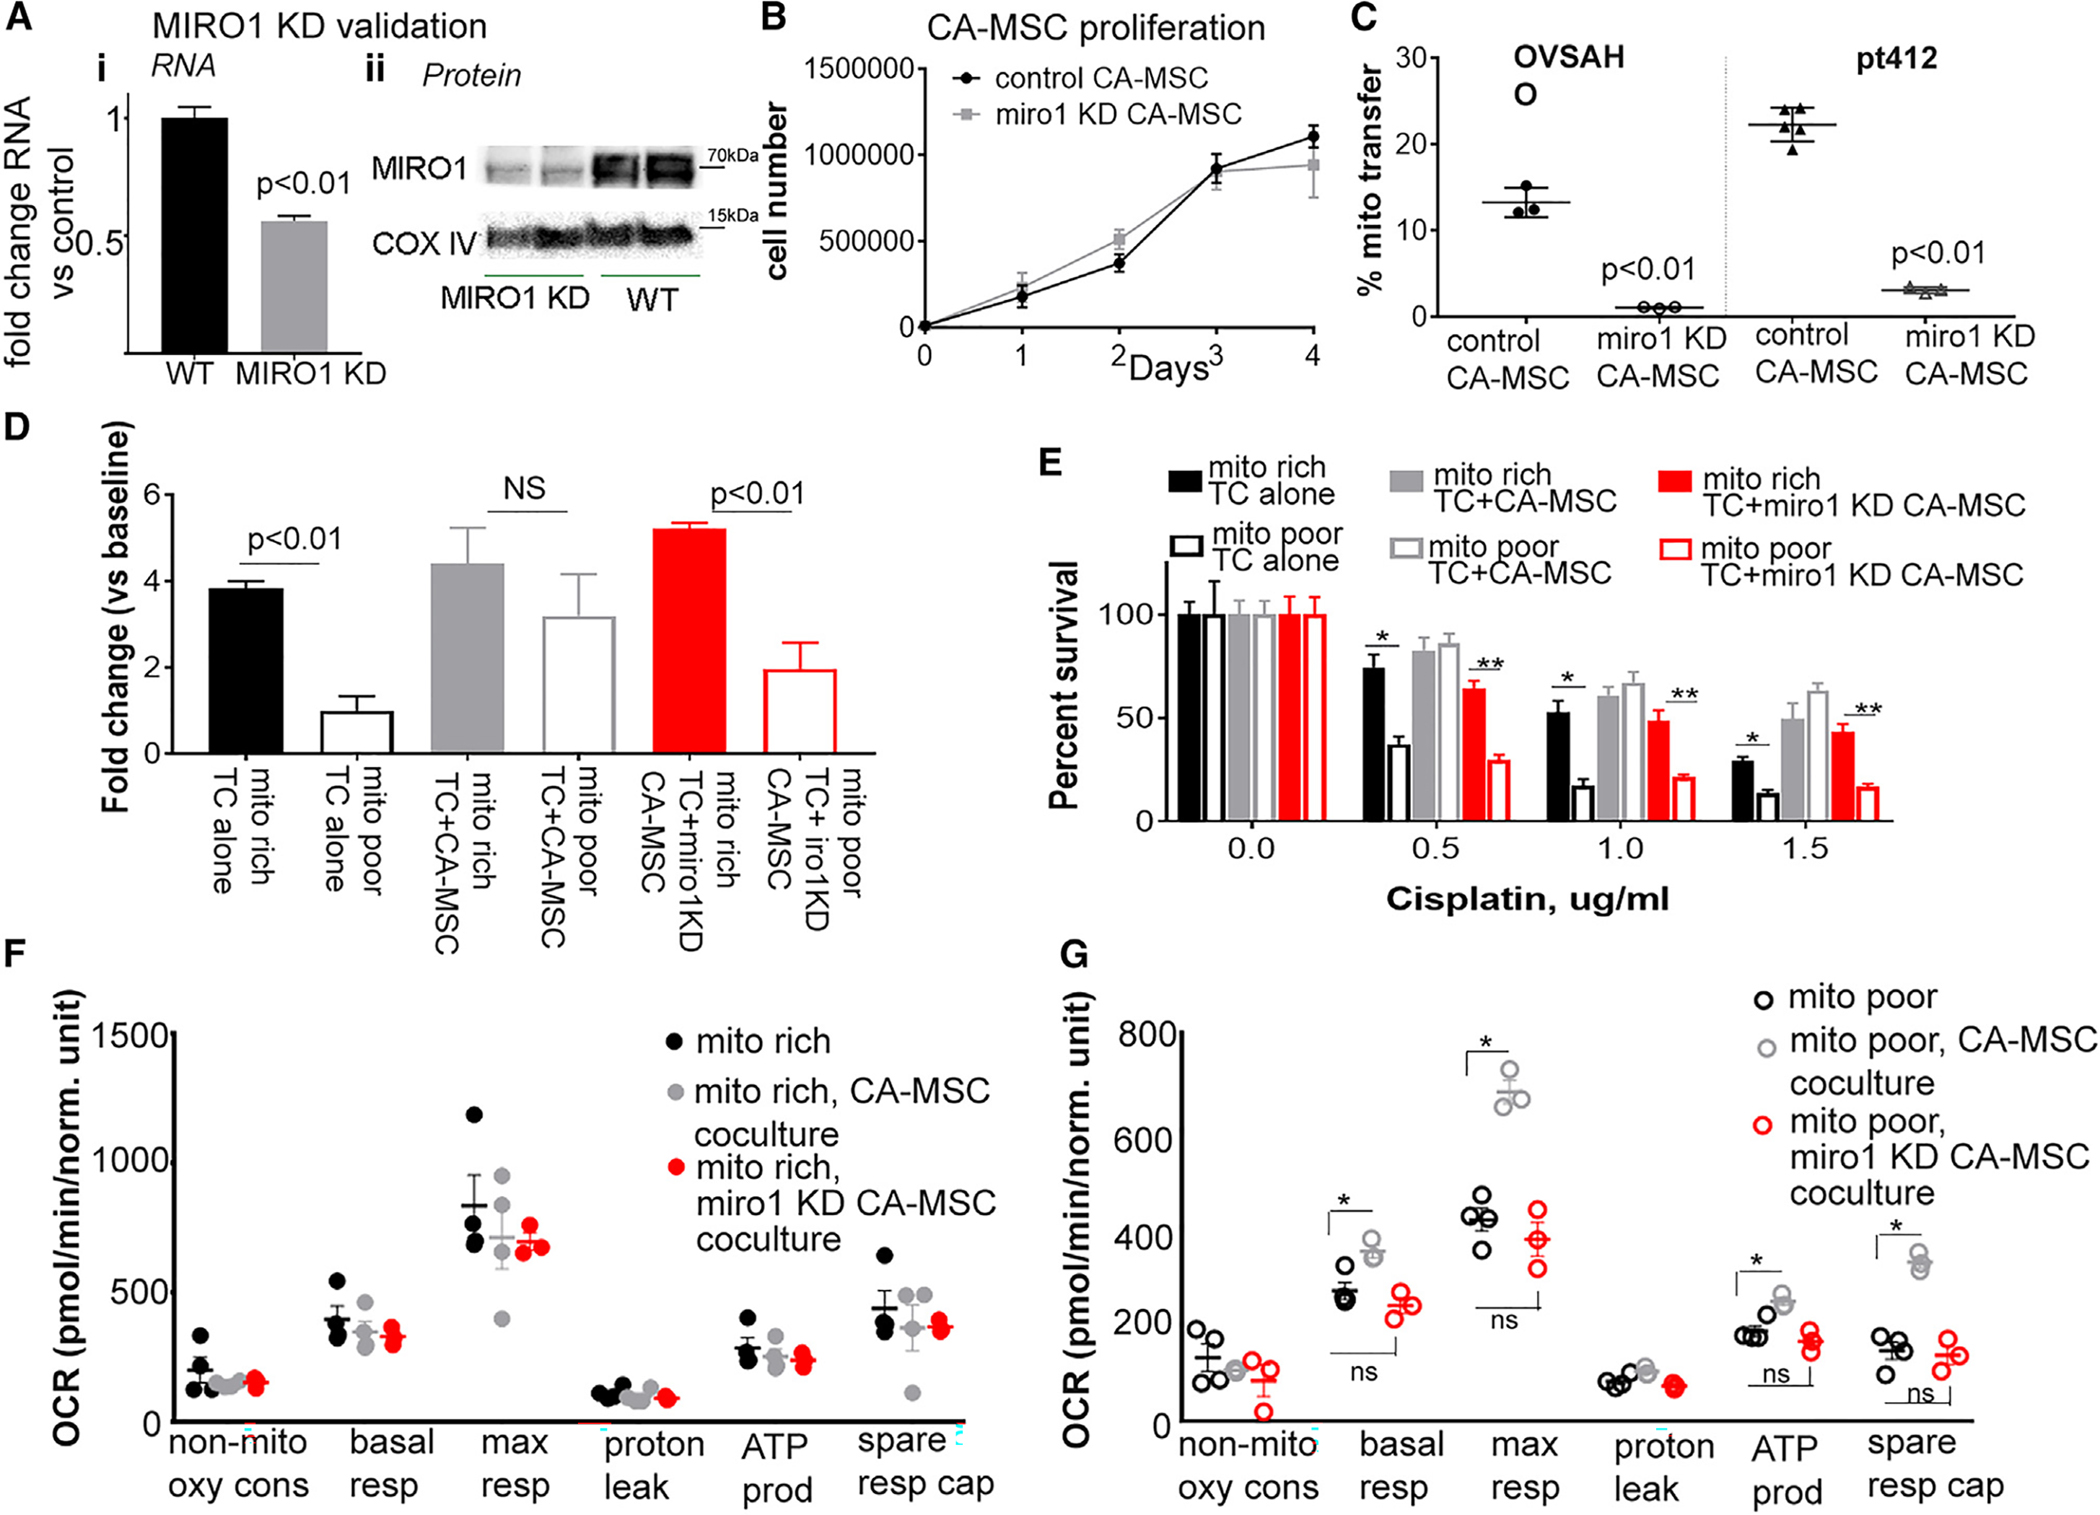
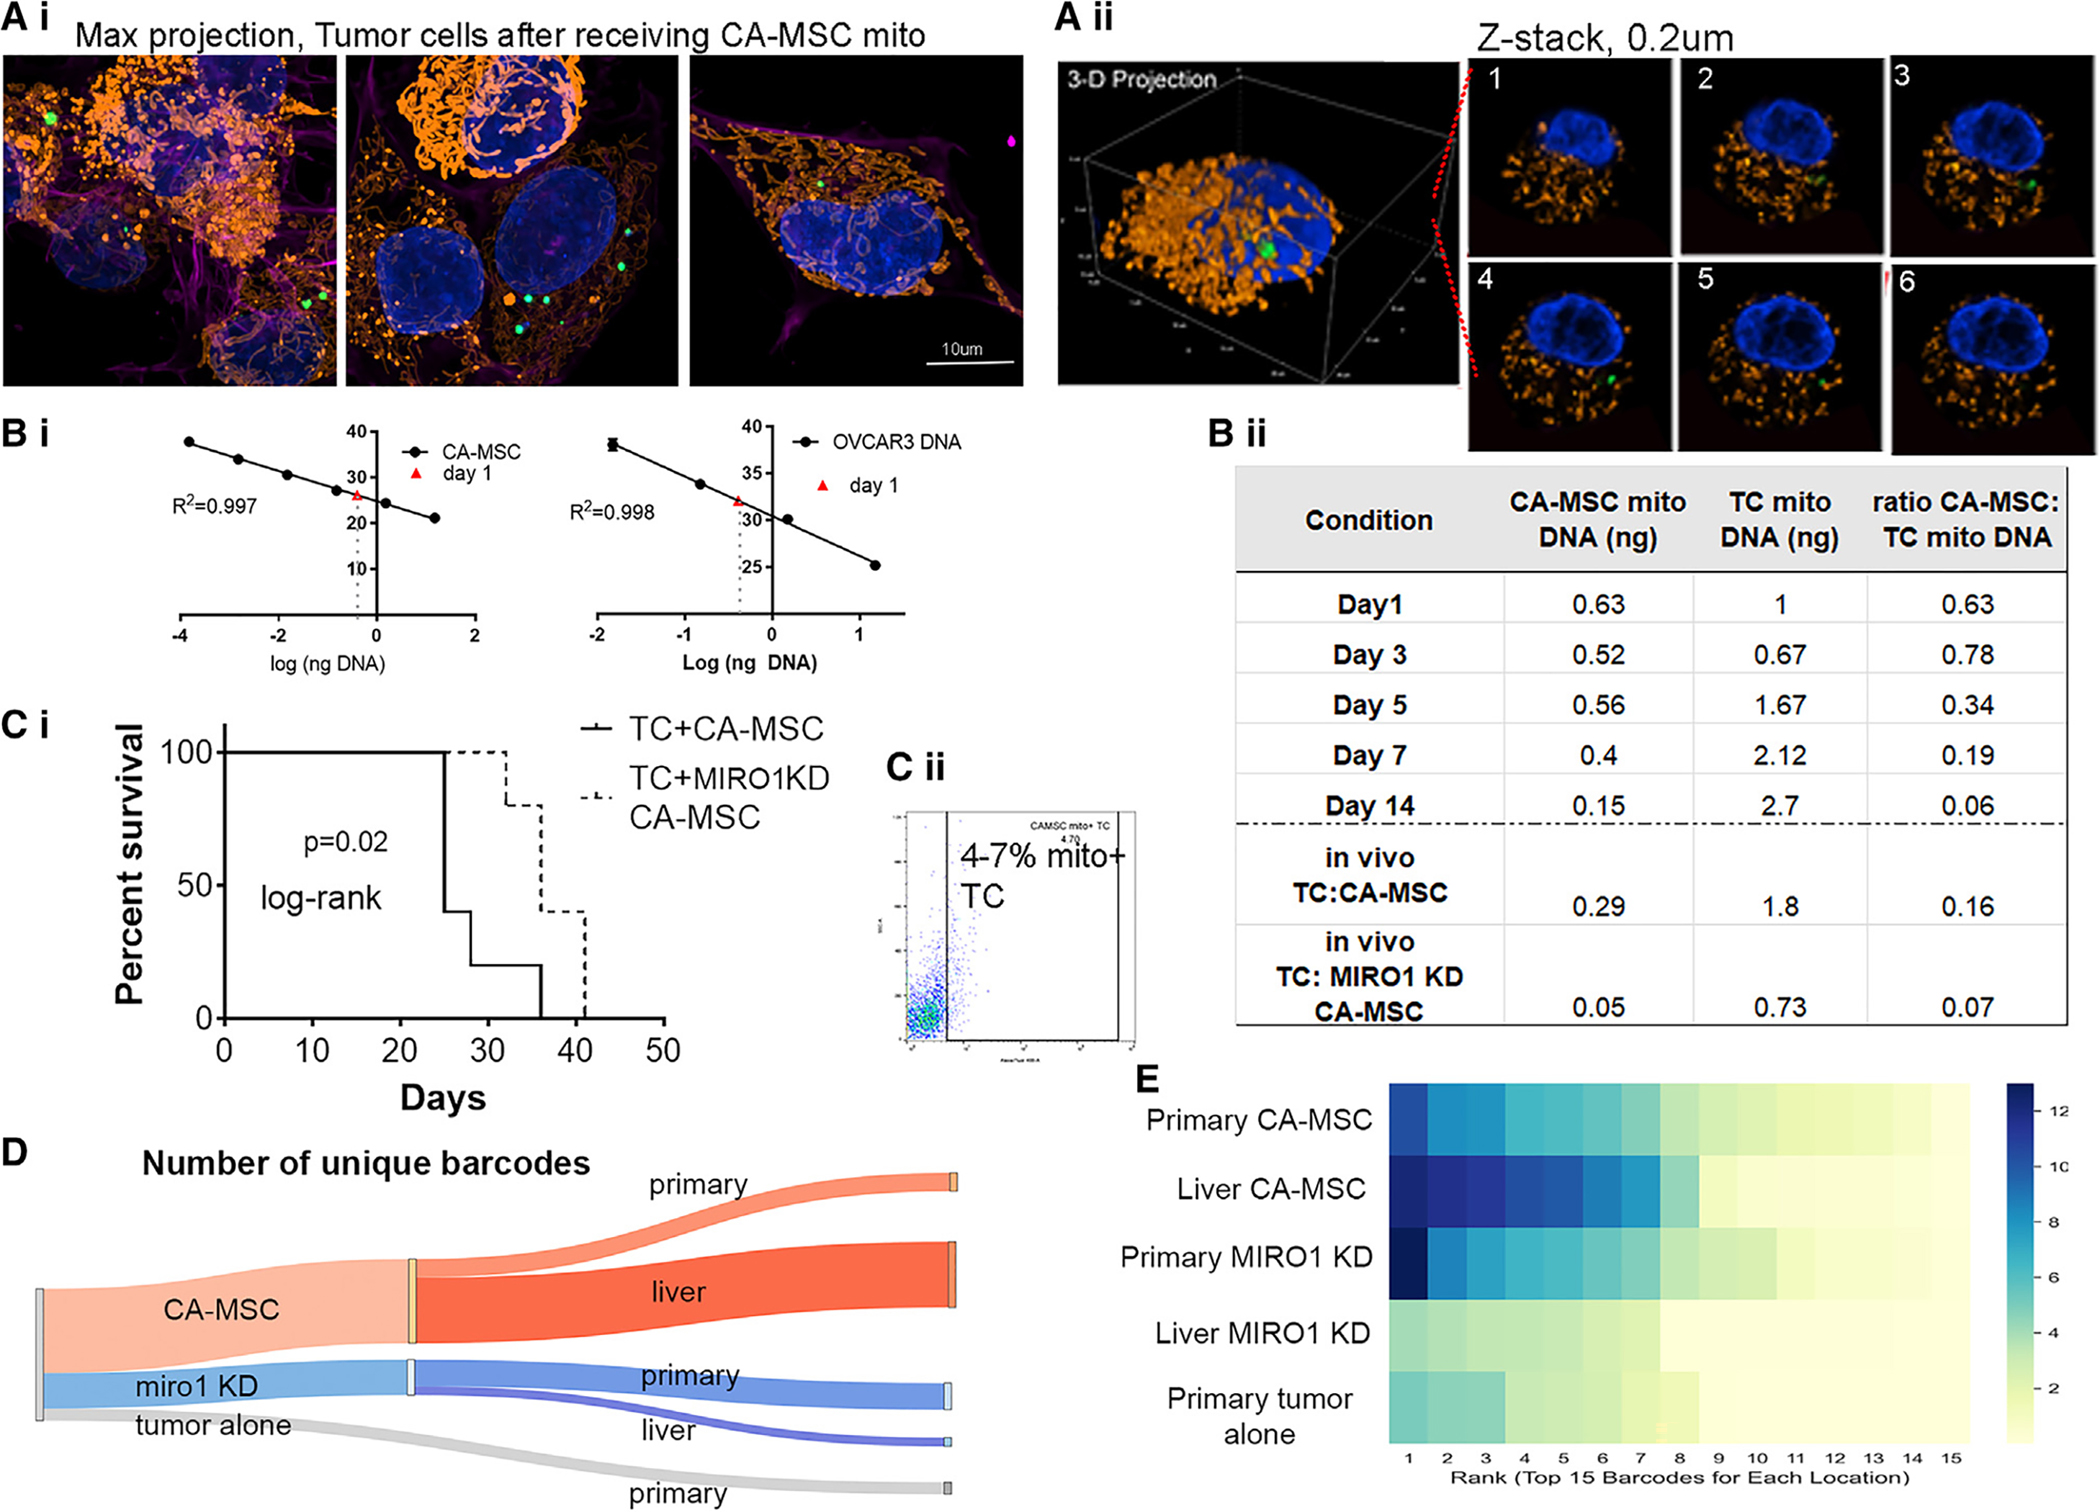
Ovarian cancer is characterized by early metastatic spread. This study demonstrates that carcinoma-associated mesenchymal stromal cells (CA-MSCs) enhance metastasis by increasing tumor cell heterogeneity through mitochondrial donation. CA-MSC mitochondrial donation preferentially occurs in ovarian cancer cells with low levels of mitochondria ("mito poor"). CA-MSC mitochondrial donation rescues the phenotype of mito poor cells, restoring their proliferative capacity, resistance to chemotherapy, and cellular respiration. Receipt of CA-MSC-derived mitochondria induces tumor cell transcriptional changes leading to the secretion of ANGPTL3, which enhances the proliferation of tumor cells without CA-MSC mitochondria, thus amplifying the impact of mitochondrial transfer. Donated CA-MSC mitochondrial DNA persisted in recipient tumor cells for at least 14 days. CA-MSC mitochondrial donation occurs in vivo, enhancing tumor cell heterogeneity and decreasing mouse survival. Collectively, this work identifies CA-MSC mitochondrial transfer as a critical mediator of ovarian cancer cell survival, heterogeneity, and metastasis and presents a unique therapeutic target in ovarian cancer.

Keywords: CP: Cancer; carcinoma-associated mesenchymal stem cells; metastasis; mitochondrial donation; ovarian cancer; oxidative phosphorylation; tumor heterogenity; tumor microenvironment.


Conflict of interest statement

Declaration of interests The authors declare no competing interests.

Figures

Figure 1.
Figure 1.. CA-MSCs increase OVCAR3 ovarian TC heterogeneity in vivo
(A) Quantification of organ-specific tumor involvement per mouse group (n = 10 per group): TC alone vs. TC + CA-MSC. (B–F) Quantification of unique clones at each site of tumor involvement: (B) lung, (C) liver, (D) blood, (E) abdomen, and (F) ascites. n = 8 sites for TC + CA-MSC; n = 6 TC alone; n = 2 blood samples for both groups. (G) Sankey diagram visually demonstrating the number of unique barcodes at each tumor site in TC + CA-MSC vs. TC-alone mice. (H) Venn diagrams demonstrating the distribution of TC clones across organ sites per mouse. (I) Heatmap ranking the log-based total number of unique clones derived from the top 50 most abundant barcodes at each. For (B) and (C), data are presented as the mean ± SEM; displayed p values obtained using Student’s t test.
Figure 2.
Figure 2.. CA-MSCs directly transfer mitochondria to adjacent ovarian TCs
(A) Representative images from coculture demonstrating direct CA-MSC to TC mitochondrial transfer. CA-MSC mitochondria labeled with lentiviral COX8-GFP (green), while endogenous TC mitochondria are COX8-dsRed (orange). (i) Maximum projection image of representative coculture z stack. scale bar, 50 μm. (ii) Three-dimensional (3D) rendering of a subset of (i) showing TC+mitoTrans cell and (iii) representative z slices. (B) Transfer of GFP-CA-MSC mitochondria to TCs quantified using flow cytometry. Six individual patient (pt)-derived CA-MSCs are represented (i) and three individual patient-derived CA-MSCs donating to three individual ovarian cancer cell lines are represented (ii). (C) CA-MSC to TC mitochondrial transfer under indirect coculture vs. direct coculture (n = 5 individual experiments). (D) Comparison of CA-MSCs’ and normal MSCs’ (derived from patients without cancer) ability to transfer mitochondria to TCs (n = 3 individual experiments). (E) Change in CA-MSC to TC mitochondrial transfer under adherent vs. non-adherent conditions (n = 5 individual experiments). (F) Change in CA-MSC to TC mitochondrial transfer under normoxic (21% O2) vs. hypoxic (1% O2) conditions (n = 3 individual experiments). (G) CA-MSC mitochondrial transfer quantified comparing donation to TCs with the highest active mitochondrial content (top 20%, mito rich) and lowest active mitochondrial content (lower 20%, mito poor), as assessed by MitoTracker Deep Red staining. In (B)–(D), CA-MSCs were cocultured, resulting in a 10:1 TC:CA-MSC ratio. *p < 0.05. Data are presented as the mean ± SEM; displayed p values obtained using Student’s t test.
Figure 3.
Figure 3.. TCs with less endogenous mitochondrial bulk demonstrate decreased proliferation and increased chemotherapy sensitivity compared to TCs with high endogenous mitochondrial bulk
(A–Ci) Mito rich TCs vs. mito poor TCs alone proliferation. (A–Cii) Mito rich vs. mito poor TCs with CA-MSCs co-culture, and TC proliferation was quantified, demonstrating coculture rescues the proliferation of mito poor TCs. Three different TC lines were used: (A) OVCAR3, (B) PT412, and (C) OVSAHO. (D–F) TC survival to increasing doses of cisplatin in mito rich vs. mito poor (i) TC alone and (ii) with CA-MSC coculture. Three different TC lines were used: (D) OVCAR3, (E) PT412, and (F) OVSAHO. (G) Mito poor TCs from a paired TC and CA-MSC sample derived from the same patient with HGSC were grown alone or with CA-MSC coculture, and (i) TC proliferation and (ii) chemotherapy sensitivity were compared validating the rescue of mito poor TC growth and chemotherapy survival with CA-MSC coculture in an autologous paired sample. For all experiments, data are presented as the mean ± SEM; displayed p values obtained using Student’s t test, with *p < 0.05. Three independent experiments were run for each assay.
Figure 4.
Figure 4.. Donated mitochondria-to-host nuclear signaling in recipient TCs drives proliferation in non-mitochondria receiving TCs via secretion of ANGPTL3 and MAPK/ERK activation
(A) Proliferation of TC+mitoTrans and TC−mitoTrans cells using PT412 and OVCAR3 HGSC cells (n = 6). (B) Proliferation of TC−mitoTrans cells alone or cocultured with TC +mitoTrans cells (n = 6). (C) (i) Top upregulated differentially expressed genes coding for secreted proteins in TC+mitoTrans compared to TC−mitoTrans cells (n = 4 paired samples). (ii) qPCR (n = 3 paired samples) and (iii) western blotting for ANGPTL3 in TC+mitoTrans and TC−mitoTrans cells (n = 3). (iv) Over-representation analysis using Kyoto Encyclopedia of Genes and Genomes pathways containing differentially expressed genes in TC+mitoTrans cells. (D) Proliferation curve showing fold change in TC number in bulk OVCAR3 and PT412 TCs treated with increasing amounts of recombinant ANGPTL3 protein for 5 days (with daily media change/ANGPTL3 re-dosing) (n = 6 per group). (E) Western blot and corresponding densitometry plot indicating increased phosphorylation of ERK1/2 and unchanged Akt phosphorylation in PT412 and OVCAR3 cells treated with recombinant ANGPTL3 (n = 6 for all groups). (F) Proliferation on day 5 of TC−mitoTrans cells alone or cocultured with TC+mitoTrans cells in the presence of an ANGPTL3 blocking antibody or IgG control (n = 6 per group). (G) Proliferation on day 5 of ANGPTL3 KD or scrambled control TC−mitoTrans cells alone or cocultured with KD/scrambled control TC+mitoTrans cells (n = 3 per group). (H) Proliferation on day 5 of TC−mitoTrans cells alone or cocultured with TC+mitoTrans cells (n = 3 per group) under treatment with either 100 nM trametinib or DMSO vehicle control. (I) ANGPTL3 ELISA of the non-cellular fraction from patient-derived malignant HGSC ascites (n = 8) or IPWs for benign indications (n = 4). For (A)–(H), data are presented as the mean ± SEM; displayed p values obtained using Student’s t test (A–Ciii and I) or one-way ANOVA (D–H). For all data, *p < 0.05; **p < 0.01; ***p < 0.001; ****p < 0.0001.
Figure 5.
Figure 5.. Respiratory capacity of mito poor TCs improves after CA-MSC coculture
(A and B) Representative extracellular flux assay plots of OCR measurements from mito rich vs. mito poor TCs (A) alone and (B) after CA-MSC coculture. (C and D) Summary data of metabolic parameters for the mito rich vs. mito poor TCs (C) alone and (D) after CA-MSC coculture. Each point represents the mean OCR value from an independent experiment (n = 4 paired samples; displayed p values obtained from Student’s t test).
Figure 6.
Figure 6.. Blocking CA-MSC mitochondrial transfer via MIRO1 KD eliminates the proliferation and chemotherapy resistance benefit of TC coculture with CA-MSCs
(A) MIRO1 KD validation at the RNA (i) and protein (ii) level in CA-MSCs. WT = wild-type control (n = 3). (B) Proliferation of MIRO1 KD vs. control CA-MSCs demonstrated that MIRO1 KD did not impact the viability or proliferation of CA-MSCs (n = 3). (C) Quantification of mitochondrial transfer from control vs. MIRO1 KD CA-MSCs to OVSAHO or PT412 TCs (n = 3). (D) Quantification of TC proliferation, represented as fold change from baseline at 48 h, in mito rich vs. mito poor TC alone and with control or MIRO1 KD CA-MSC coculture (n = 3 paired samples per coculture condition). (E) Quantification of TC survival to increasing doses of cisplatin in mito rich vs. mito poor TC alone and with control or MIRO1 KD CA-MSC coculture (n = 3 paired samples per coculture condition). (F) Composite extracellular flux OCR data in mito rich TC alone and with control vs. MIRO1 KD CA-MSC coculture (n = 3 paired samples per coculture condition). (G) Composite OCR data in mito poor TC alone and with control vs. MIRO1 KD CA-MSC coculture. Each point is an independent experiment. *p < 0.05, t test. Mean and SEM are represented (n = 3 paired samples per coculture condition). Data are presented as the mean ± SEM; displayed p values obtained using Student’s t test (A–Ciii and G) or one-way ANOVA (D–F). For all data, ns indicates not significant; *p < 0.05; **p < 0.01.
Figure 7.
Figure 7.. Mitochondria donated from CA-MSCs is retained after TC transfer and in vivo growth, and blockage of CA-MSC mitochondria transfer prolongs mouse survival and decreases TC heterogeneity in a murine ovarian cancer model
(A) Representative images PT412+mitoTrans cells 24 h post-isolation from coculture with COX8-GFP-tagged CA-MSCs via FACS. (i) Maximum projection images. (ii) 3D rendering of a subset of (i) with (iii) six representative z slices. Scale bar, 10 μm. (B) (i) qPCR standard curves used to quantify the amount of CA-MSC and endogenous TC mitochondrial DNA in TCs (n = 3). (ii) Ratio of CA-MSC to TC mtDNA in TCs after coculture corresponding to immunofluorescence pictures in (A) and in vivo TCs isolated from TC:CA-MSC xenografts or TC:MIRO1 KD CA-MSC xenografts. (C) (i) Quantification of TC survival when TCs were cocultured with CA-MSC vs. MIRO1 KD CA-MSC. (ii) Flow cytometry analysis of isolated TCs with CA-MSC-donated mitochondria. (D) Sankey diagram demonstrating number of unique TC barcodes in the CA-MSC vs. MIRO1 KD CA-MSC xenografts. (E) Heatmap of the prevalence of the top 15 barcodes at each location in CA-MSC vs. MIRO1 KD CA-MSC mice, indicating a larger diversity of dominate clones consistent with overall increased heterogeneity in the CA-MSC groups. Displayed p value obtained using log rank test.

References

    1. Siegel RL, Miller KD, and Jemal A (Jan-Feb 2016). Cancer statistics, 2016. CA. Cancer J. Clin. 66, 7–30. 10.3322/caac.21332. - DOI - PubMed
    1. Dagogo-Jack I, and Shaw AT (2018). Tumour heterogeneity and resistance to cancer therapies. Nat. Rev. Clin. Oncol. 15, 81–94. 10.1038/nrclinonc.2017.166. - DOI - PubMed
    1. Roberts CM, Cardenas C, and Tedja R (2019). The Role of IntraTumoral Heterogeneity and Its Clinical Relevance in Epithelial Ovarian Cancer Recurrence and Metastasis. Cancers 11, 1083. 10.3390/cancers11081083. - DOI - PMC - PubMed
    1. Schuh A, Becq J, Humphray S, Alexa A, Burns A, Clifford R, Feller SM, Grocock R, Henderson S, Khrebtukova I, et al. (2012). Monitoring chronic lymphocytic leukemia progression by whole genome sequencing reveals heterogeneous clonal evolution patterns. Blood 120, 4191–4196. 10.1182/blood-2012-05-433540. - DOI - PubMed
    1. Schwarz RF, Ng CK, Cooke SL, Newman S, Temple J, Piskorz AM, Gale D, Sayal K, Murtaza M, Baldwin PJ, et al. (2015). Spatial and temporal heterogeneity in high-grade serous ovarian cancer: a phylogenetic analysis. PLoS Med. 12, e1001789. 10.1371/journal.pmed.1001789. - DOI - PMC - PubMed

Publication types

Substances

LinkOut - more resources