. 2024 Aug 27;43(8):114501.
doi: 10.1016/j.celrep.2024.114501. Epub 2024 Jul 25.

Housing mice near vs. below thermoneutrality affects drug-induced weight loss but does not improve prediction of efficacy in humans

Affiliations

Housing mice near vs. below thermoneutrality affects drug-induced weight loss but does not improve prediction of efficacy in humans

Julie M Jacobsen et al. Cell Rep. .

Abstract

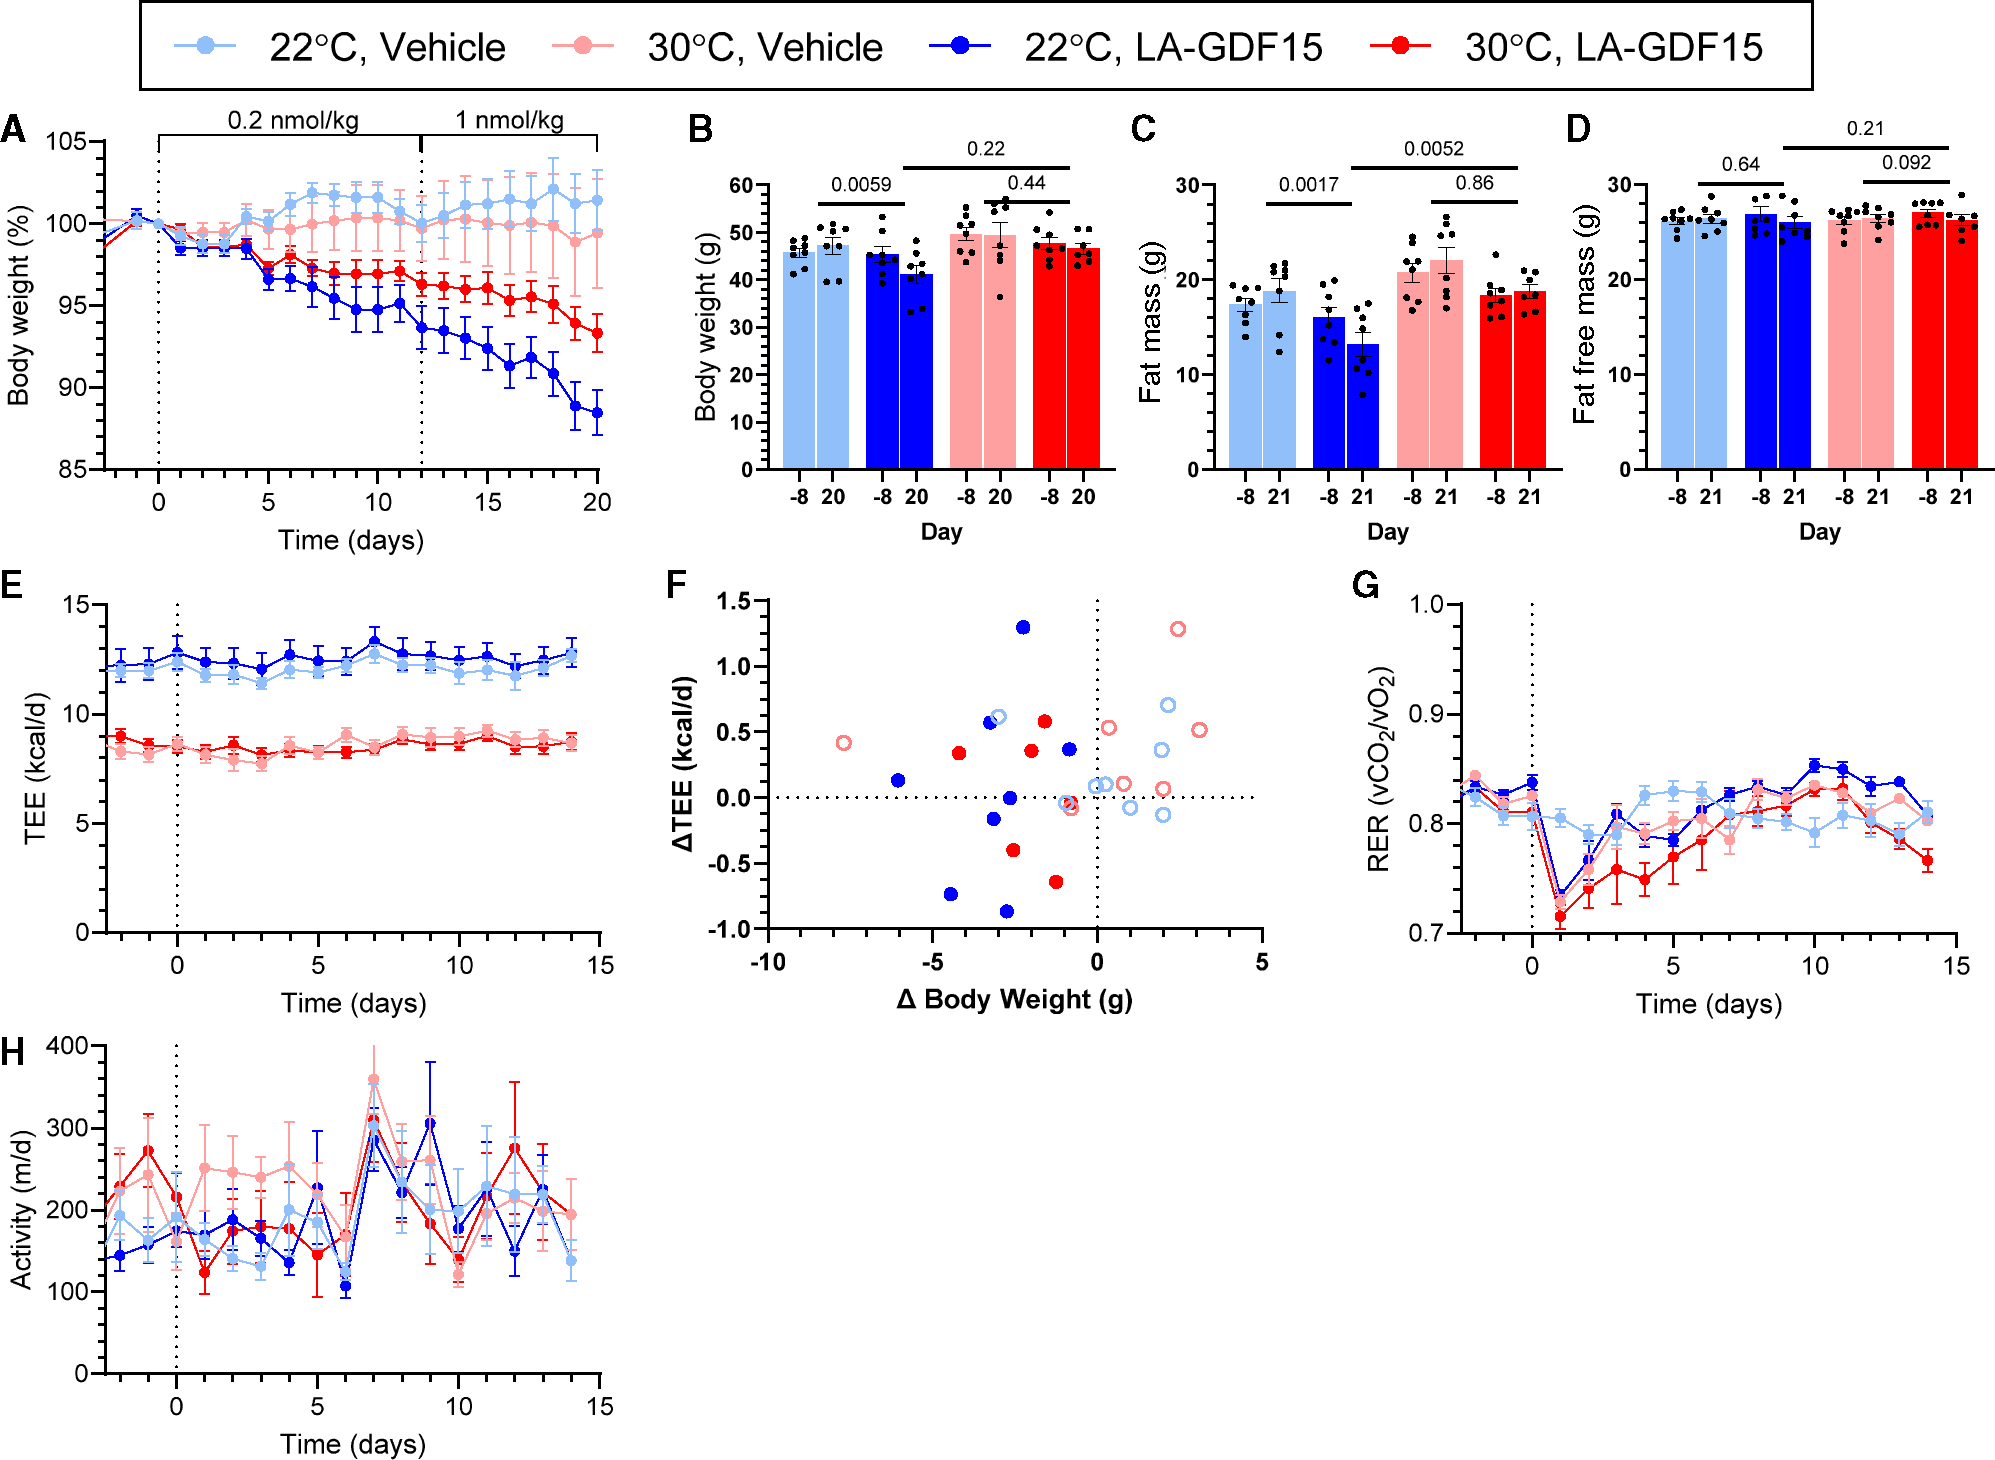
Evaluation of weight loss drugs is usually performed in diet-induced obese mice housed at ∼22°C. This is a cold stress that increases energy expenditure by ∼35% compared to thermoneutrality (∼30°C), which may overestimate drug-induced weight loss. We investigated five anti-obesity mechanisms that have been in clinical development, comparing weight loss in mice housed at 22°C vs. 30°C. Glucagon-like peptide-1 (GLP-1), human fibroblast growth factor 21 (hFGF21), and melanocortin-4 receptor (MC4R) agonist induced similar weight losses. Peptide YY elicited greater vehicle-subtracted weight loss at 30°C (7.2% vs. 1.4%), whereas growth differentiation factor 15 (GDF15) was more effective at 22°C (13% vs. 6%). Independent of ambient temperature, GLP-1 and hFGF21 prevented the reduction in metabolic rate caused by weight loss. There was no simple rule for a better prediction of human drug efficacy based on ambient temperature, but since humans live at thermoneutrality, drug testing using mice should include experiments near thermoneutrality.

Keywords: CP: Metabolism; FGF21; GDF15; GLP-1; MC4R; PYY; diet-induced obese mice; energy expenditure; glucose tolerance; housing temperature; human translatability; pharmaco-mediated weight loss; thermoneutrality.


Conflict of interest statement

Declaration of interests J.M.J., N.P., M.K.G., K.P., S.O., B.S.W., B.A., B.O.C., and R.E.K. are employed by Novo Nordisk A/S, and some are minor shareholders in Novo Nordisk A/S.

Figures

Figure 1.
Figure 1.. Housing near thermoneutrality profoundly decreases TEE and food intake, with a slight increase in weight gain
(A) Body weight at entry to the metabolic chambers in the five indicated experiments. (B) Change in body weight over the 8- to 12-day acclimation to the metabolic chambers. (C and D) Total energy expenditure (TEE) and energy intake on the day before the first dose of vehicle or drug. (E) Change in body weight during 14 days of vehicle treatment. (F) Statistics of pooled data from (A)–(E), mean ± SEM, p values from unpaired t tests. In (A)–(D), all mice were pooled, irrespective of subsequent treatment. Biological replicates = 78–80/group in (A)–(C) and n = 44–45/group in (D). (E) includes only vehicle-treated mice, n = 32/group. Technical replicates: (A–E) n = 1.
Figure 2.
Figure 2.. LA-GLP-1 treatment induces profound weight loss that is similar at 22°C and 30°C
(A) Body weight during treatment of male DIO mice with vehicle or LA-GLP-1 (final 10 nmol/kg subcutaneously [s.c.] daily). (B) Body weight at day of transfer to the indirect calorimetry system (day −12) and at the end of treatment (day 20). (C and D) Fat mass and fat-free mass at days −12 and 20. (E) TEE during treatment. (F) Change in TEE vs. change in body weight. Changes were calculated by subtracting the values on the last day of treatment from the day before the treatment started. (G) Respiratory exchange ratio (RER; VCO2/VO2). (H) Food intake. (I) Change in food intake vs. change in body weight calculated as in (F). (J) Cumulative food intake during treatment (J). (K) Physical activity. Data are mean ± SEM, biological replicates: n = 8/group. Technical replicates: n = 1/group. p values compare the difference between days −12 and 20 by two-way ANOVA with uncorrected Fisher’s least significant difference LSD post hoc testing within Ta or drug treatment. Color scheme: light blue, 22°C vehicle; pink, 30°C vehicle; dark blue, 22°C LA-GLP-1; and red, 30°C LA-GLP-1.
Figure 3.
Figure 3.. Treatment with LA-GLP-1 counteracts the reduction in EE that occurs with weight loss induced by calorie restriction
(A) Body weight during treatment of male DIO mice with vehicle, LA-GLP-1 (final 10 nmol/kg s.c. daily), or vehicle with food restriction to match the weight of the LA-GLP-1-treated mice. (B) Body weight at day of transfer to the indirect calorimetry system (day −5) and at the end of treatment (day 14). (C and D) Fat mass and fat-free mass at days −6 and 16. (E) Daily TEE during treatment. (F) TEE over the 14 days of treatment. (G) Change in TEE vs. change in body weight. Changes were calculated by subtracting the values on the last day of treatment from the day before the start of treatment. (H) RER (VCO2/VO2). (I) Daily food intake. (J) Total food intake during treatment. (K) Change in food intake calculated as in (G). (L) Cumulative food intake during treatment phase. (M) Physical activity. Data are mean ± SEM. Biological replicates: n = 8. Technical replicates: n = 1. p values from one-way ANOVA with Tukey multiplicity correction. Color scheme: light blue, 22°C vehicle; dark blue, 22°C LA-GLP-1; and magenta, 22°C food restricted to match the weight of the LA-GLP-1-treated mice.
Figure 4.
Figure 4.. hFGF21 caused similar weight loss at 22°C and 30°C with a greater increase in TEE at 22°C
(A) Body weight during treatment of male DIO mice with human FGF21 (0.5 nmol/kg s.c. twice daily). (B) Body weight at day of transfer to the indirect calorimetry system (day −12) and at the end of treatment (day 18). (C and D) Fat mass and fat-free mass at days −12 and 18. (E) TEE during treatment. (F) Change in TEE vs. change in body weight. Changes were calculated by subtracting the mean of days 11 and 12 from the mean of days −1 and 0. (G) TEE (mean of days 11 and 12) vs. body weight (mean of days 11 and 12). Regression line and 95% confidence limits of the full experiment vehicle 22°C (light blue, n = 136, R2 = 0.42, TEE = 0.3914•BW-5.824) and 30°C (pink, n = 136, R2 = 0.29, TEE = 0.2407•BW-1.967) data. Days 11 and 12 were chosen due to the loss of TEE data from days 13–16. (H) RER (VCO2/VO2). (I) Food intake. (J) Cumulative food intake (kcal) during treatment phase. (K) Physical activity. (L) Final physical activity level (average of days 15 and 16) vs. change in body weight. (M) Final physical activity EE data in (K) multiplied by body weight. Data are mean ± SEM. Biological replicates: n = 8/group, except n = 4/group for TEE and RER on days 13–16. Technical replicates: n = 1. p values compare the difference between days −12 and 18 by two-way ANOVA with uncorrected Fisher’s LSD post hoc testing within Ta or drug treatment. Color scheme: light blue, 22°C vehicle; pink, 30°C vehicle; dark blue, 22°C hFGF21; and red, 30°C hFGF21.
Figure 5.
Figure 5.. Setmelanotide-induced weight loss is similar at 22°C and 30°C
(A) Body weight during treatment of male DIO mice with setmelanotide (2.7 μmol/kg s.c. daily). (B) Body weight at day of transfer to the indirect calorimetry system (day −12) and at the end of treatment (day 10). (C and D) Fat mass and fat-free mass at days −12 and 10. (E) TEE during treatment. (F) RER (VCO2/VO2). (G) Physical activity. Data are mean ± SEM. Biological replicates: n = 8/group. Technical replicates: n = 1. p values compare the difference between days −12 and 10 by two-way ANOVA with uncorrected Fisher’s LSD post hoc testing within Ta or drug treatment. Color scheme: light blue, 22°C vehicle; pink, 30°C vehicle; dark blue, 22°C setmelanotide; and red, 30°C setmelanotide.
Figure 6.
Figure 6.. LA-GDF15 induces more weight loss at 22°C than at 30°C
Effects on TEE and activity are comparable. (A) Body weight during treatment of male DIO mice with LA-GDF15 (1 nmol/kg s.c. daily). (B) Body weight at day of transfer to the indirect calorimetry system (day −8) and at the end of treatment (day 21). (C and D) Fat mass and fat-free mass at days −8 and 21. (E) TEE during treatment. (F) Change in TEE vs. change in body weight. Changes were calculated by subtracting the values on the last day of treatment from the day before the treatment started. (G) RER (VCO2/VO2). (H) Physical activity. Data are mean ± SEM. Biological replicates: n = 8/group. Technical replicates: n = 1. p values compare the difference between days −8 and 21 by two-way ANOVA with uncorrected Fisher’s LSD post hoc testing within Ta or drug treatment. Color scheme: light blue, 22°C vehicle; pink, 30°C vehicle; dark blue, 22°C LA-GDF15; and red, 30°C LA-GDF15.

Similar articles

Cited by

References

    1. Nilsson C, Raun K, Yan FF, Larsen MO, and Tang-Christensen M (2012). Laboratory animals as surrogate models of human obesity. Acta Pharmacol. Sin. 33, 173–181. 10.1038/aps.2011.203. - DOI - PMC - PubMed
    1. Gordon CJ (1993). Temperature Regulation in Laboratory Rodents (Cambridge University Press; ). 10.1017/CBO9780511565595. - DOI
    1. Reitman ML (2018). Of mice and men - environmental temperature, body temperature, and treatment of obesity. FEBS Lett. 592, 2098–2107. 10.1002/1873-3468.13070. - DOI - PubMed
    1. Fischer AW, Csikasz RI, von Essen G, Cannon B, and Nedergaard J (2016). No insulating effect of obesity. Am. J. Physiol. Endocrinol. Metab 311, E202–E213. 10.1152/ajpendo.00093.2016. - DOI - PubMed
    1. John LM, Petersen N, Gerstenberg MK, Torz L, Pedersen K, Christoffersen B, and Kuhre RE (2022). Housing-temperature reveals energy intake counter-balances energy expenditure in normal-weight, but not diet-induced obese, male mice. Commun. Biol. 5, 946. 10.1038/s42003-022-03895-8. - DOI - PMC - PubMed

Publication types

Substances