. 2024 Aug 20;5(8):101659.
doi: 10.1016/j.xcrm.2024.101659. Epub 2024 Jul 26.

Isogenic patient-derived organoids reveal early neurodevelopmental defects in spinal muscular atrophy initiation

Affiliations

Isogenic patient-derived organoids reveal early neurodevelopmental defects in spinal muscular atrophy initiation

Tobias Grass et al. Cell Rep Med. .

Abstract

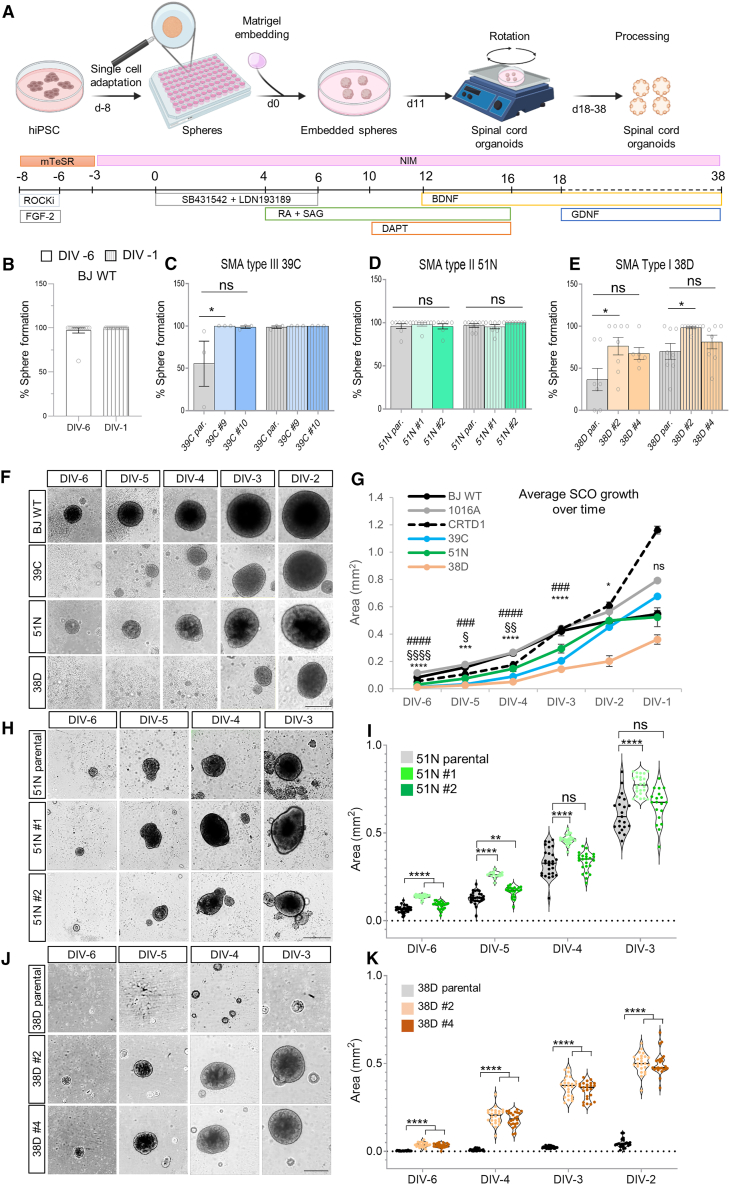
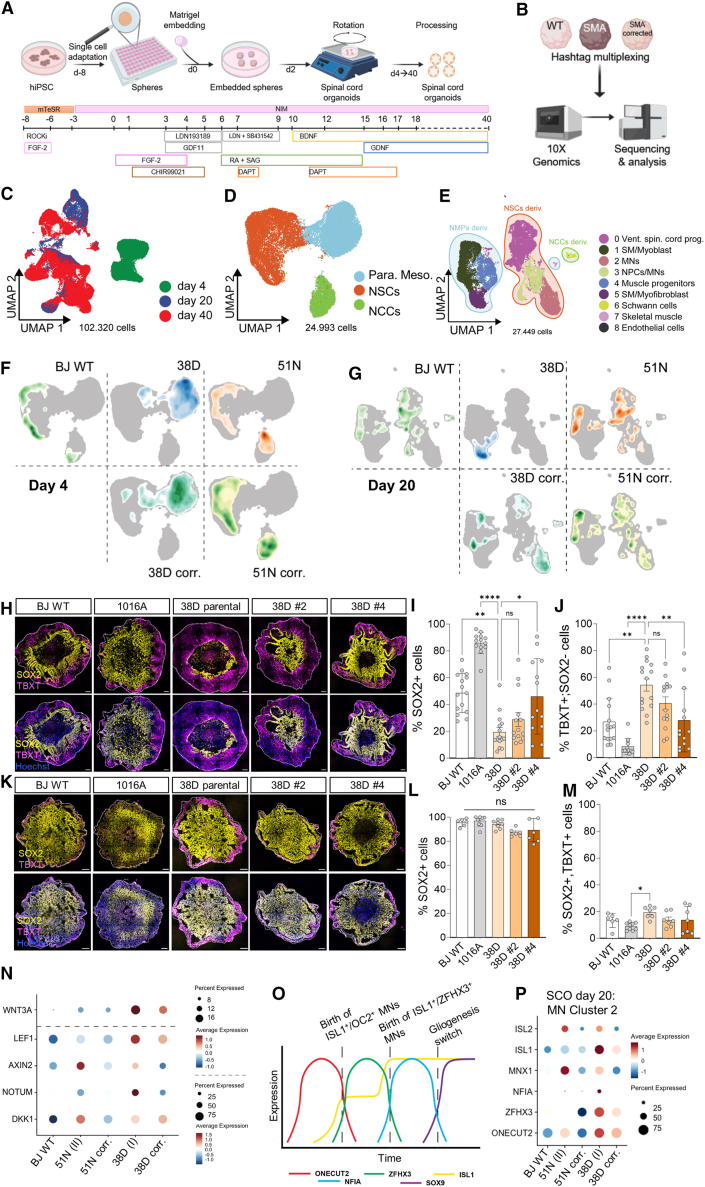
Whether neurodevelopmental defects underlie postnatal neuronal death in neurodegeneration is an intriguing hypothesis only recently explored. Here, we focus on spinal muscular atrophy (SMA), a neuromuscular disorder caused by reduced survival of motor neuron (SMN) protein levels leading to spinal motor neuron (MN) loss and muscle wasting. Using the first isogenic patient-derived induced pluripotent stem cell (iPSC) model and a spinal cord organoid (SCO) system, we show that SMA SCOs exhibit abnormal morphological development, reduced expression of early neural progenitor markers, and accelerated expression of MN progenitor and MN markers. Longitudinal single-cell RNA sequencing reveals marked defects in neural stem cell specification and fewer MNs, favoring mesodermal progenitors and muscle cells, a bias also seen in early SMA mouse embryos. Surprisingly, SMN2-to-SMN1 conversion does not fully reverse these developmental abnormalities. These suggest that early neurodevelopmental defects may underlie later MN degeneration, indicating that postnatal SMN-increasing interventions might not completely amend SMA pathology in all patients.

Keywords: isogenic SMA model; neurodevelopmental defects; neuromesodermal progenitors; organoids; spinal cord.


Conflict of interest statement

Declaration of interests The authors declare no competing interests.

Figures

None
Graphical abstract
Figure 1
Figure 1
Generation of isogenic control hiPSCs from various severities of SMA hiPSC lines (A) Knockin CRISPR-Cas9-mediated mutagenesis workflow to correct the C-to-T nucleotide change in SMN2 in SMA hiPSC lines. (B) Isogenic corrected hiPSC lines generated and used for the study. (C) Sanger sequencing results from the successfully targeted SMA lines aligned to exon 7 of SMN2 gene. Chromatograms from one clone of each successfully targeted SMA line highlighting the corrected C in position 6 of exon 7. See also Figure S1. (D–F) (D) Representative western blot from hiPSC lysates and respective quantifications (E and F) (N = 4). (G–I) (G) Quantification of the number of nuclear gems immunostained with anti-SMN antibody or SMN:Clover endogenously labeled (H) in BJ WT and BJ SMN:Clover (#16 and #23) derived MN cultures 4 and 8 days after plating (N = 3). Representative SMN immunostained (empty arrows) and SMN:Clover+ (filled arrows) nuclear gems in MNs. Scale bar, 10 μm (I). See also Figures S2A–S2D. (J) Representative immunoprecipitation from BJ WT and BJ SMN:Clover #23 hiPSC lysates. (K–M) (K) Representative SMN-immunostained isogenic SMA type II hiPSC trio treated with CHX. Scale bar, 50 μm. Total SMN protein level quantification upon CHX treatment in the SMA 51N-II (L) and 38D-I (M) hiPSC trios (N = 4). See also Figures S2E–S2Y. (N) qPCR analysis of snRNAs from EBs derived from BJ WT and the SMA type I isogenic trio differentiated as in (G)–(I). RNA levels are expressed relative to BJ WT levels for each individual experiment (color-coded; N = 5). The dotted line indicates the average values for all experiments. See also Figure S3. One-way ANOVA with Tukey’s (E–H) and Fischer’s LSD (N) multiple comparison test used for statistical analysis.
Figure 2
Figure 2
SMA hiPSC-derived spinal MN death is rescued in the isogenic corrected lines (A–D) Quantification of SiR-DNA-stained SMA hiPSC-derived MNs that survive 10 days after plating (A), 39C-III parental and its isogenic corrected MNs (B), 51N-II parental and its isogenic corrected MNs (C), and 38D-I parental and its isogenic corrected MNs (D). Each dot represents individually analyzed wells of all conducted experiments (N = 3–7, n = 3 wells per line per experiment. One-way ANOVA/Tukey’s analysis). (E) Representative SiR-DNA (red) stained MN cultures 2 and 12 days after plating. Scale bar, 20 μm. See also Figures S6A–S6F. (F) Representative immunostained MNs after 2 and 12 days in culture (ISL1, green; MAP2, cyan; SMN, red; nuclei blue). Scale bar, 50 μm. (G) Fraction of SMA 38D-I and isogenic ISL1+ MNs that survived after 12 days relative to the number quantified after 2 days in culture (one-way ANOVA/Fisher’s LSD analysis, N = 7). See also Figures S6G–S6H.
Figure 3
Figure 3
SMA hiPSCs present a defective sphere formation and growth when subjected to a spinal cord organoid protocol, which is improved in the isogenic corrected lines (A–E) (A) Schematic representation of the protocol followed to generate ventral spinal cord organoids. Percentage of hiPSC-seeded wells that formed a sphere two days after plating and after 7 days in culture for control BJ WT line (B), SMA 39C-III and isogenic corrected clones (C), 51N-II and corrected clones (D), and 38D-I and corrected clones (E) (N = 3–13). See also Figures S7A–S7D. (F) Representative self-assembled BJ WT and SMA spheres at the indicated developmental times. Scale bar, 400 μm. (G) Quantification of WT and SMA sphere area (mm2) over time. The graph represents the average of at least 30 spheres quantified per line and per experiment (# represents comparisons between BJ WT and 39C-III; § between BJ WT and 51N-II; and ∗ between BJ WT and 38D-I, N = 4–8). (H and I) (H) Representative SMA parental 51N-II and isogenic corrected self-assembled spheres at the indicated times (scale bar, 400 μm) and violin plot showing the size distribution of the individual spheres quantified for one representative experiment (I) (n = 30 spheres). (J and K) (J) Representative SMA parental 38D-I and isogenic corrected self-assembled spheres at the indicated times (scale bar, 400 μm) and sphere area quantification for one representative experiment (K) (n = 30 spheres). See also Figures S7E–S7L. Kruskal-Wallis analysis with Dunn’s test (B–E) and two-way ANOVA with Tukey’s multiple comparison test (G, I, and K) used for statistical analysis.
Figure 4
Figure 4
SMA spinal cord organoids show signs of altered neural development, a phenotype that is partially corrected in the isogenic controls (A–C) mRNA expression qPCR quantification of SOX2 (A), NESTIN (B), and NGN2 (C) in SCOs derived from BJ WT, SMA 38D-I, and isogenic corrected clones 8 days into the differentiation protocol (D8). Gene expression is indicated as fold change of 2-ΔΔCt with respect to 18 s, relative to BJ WT (N = 4, n = 4–8 pooled SCOs per experiment). (D) Representative D8 SCOs immunostained against NESTIN (magenta; nuclei stained with Hoechst, blue). Scale bar, 100 μm. White squares represent magnified areas displayed in (D′). Dotted line indicates a NESTIN+; SOX2− (yellow) SCO region. Scale bar, 100 μm. (E–K) (E) Representative SOX2 (yellow) immunostained D8 SCOs. Nuclei stained with Hoechst (blue). Scale bar, 100 μm. See also Figure S8 qPCR quantification of DCX (F), SMI-32 (G), NKX6.1 (H), HB9 (I), ISL1 (J), and CHAT (K) mRNA expression in SCOs derived from BJ WT, SMA 38D-I, and both isogenic corrected clones 8, 18, 28, and 38 days into the differentiation protocol (N = 4, n = 4–8 pooled SCOs per experiment. ∗ represents difference between BJ WT and 38D-I; # between 38D and 38D clone #2; and § between 38D and clone #4). (L–P) (L) Representative ISL1 (white) immunostained D28 SCOs (scale bar, 100 μm) and quantification of ISL1+ cells relative to total number of cells (Hoechst+) from D18-D28 38D-I isogenic trio vs. BJ WT (M), three healthy control lines (N), 39C-III isogenic trio (O), and 51N-II isogenic trio (P) vs. BJ WT (N = 3–6, n = 3–4 SCOs per experiment). See also Figure S9. One-way (A–C) or two-way (F–K and M–P) ANOVA with Fischer’s LSD multiple comparison test used for statistical analysis.
Figure 5
Figure 5
Longitudinal single-cell transcriptomic analysis reveals an NMP misspecification in SMA type I SCOs favoring a mesodermal lineage commitment (A) Schematic representation of the protocol followed for the generation of NMP-derived SCOs. (B) Schematic workflow of the single-cell transcriptomic analysis. (C–H) (C) Uniform manifold approximation and projection (UMAP) dimensionality reduction of the entire dataset (all control and disease samples at three developmental time points). UMAP representation of sequencing data obtained from all organoids at days 4 (D) and 20 (E). Density plot overlaid on the UMAP embedding of the main cell types at days 4 (F) and 20 (G) for BJ WT, SMA 38D-I, SMA 51N-II, and their combined two isogenic control SCOs. (H) Representative SOX2 (yellow) and TBXT (magenta) immunostained day 4 SCOs. Nuclei stained with Hoechst (blue). Scale bar, 100 μm. (I and J) (I) Quantification of the percentage of SOX2+ cells (NSCs and NMPs) and (J) TBXT+; SOX2− cells (NMPs committed to mesodermal lineage) (N = 3–4, 3–4 SCOs per experiment). (K–M) (K) Representative SOX2/TBXT immunostained day 2 SCOs and quantification of the percentage of SOX2+ cells (L) and SOX2+; TBXT+ double-positive cells (NMPs) (M) (N = 3–4, 3–4 SCOs per experiment). (N) Dot plot showing expression levels of key genes of the canonical WNT pathway from all cells of day 4 SCOs. (O) Schematic representation of the temporal expression of key transcription factors in the neural patterning of the spinal cord. (P) Dot plot showing expression levels of key genes for MN specification in “MN cluster 2” of day 20 SCOs. See also Figures S10 and S11. One-way ANOVA with Fischer’s LSD multiple comparison test used for statistical analysis.
Figure 6
Figure 6
SMA NMP mesodermal bias in early SCOs results in a reduced number of MN/neural cell clusters in favor of muscle cells in the mature organoids (A) UMAP representation of sequencing data obtained from control and disease organoids at day 40 of the differentiation protocol. (B) Heatmap of cell frequencies of each cluster for day 40 SCOs. (C) Density plot overlaid on the UMAP embedding of the main cell types in day 40 SCOs. (D) Representative immunostained day 40 SCOs showing CHAT (cyan), ISL1 (white) (MN markers), and MAP2 (red) (neuronal marker). Nuclei stained with Hoechst (blue). Scale bar, 100 μm. Squared regions in the BJ WT panels are shown in magnified images. Scale bar, 100 μm (N = 3–4, 3–4 SCOs per experiment). (E) Representative immunostained day 40 SCOs showing myofibroblast marker ACTA2 (alpha-smooth muscle actin) (red). (F) Representative Picrosirius red collagen stained day 40 SCOs (dotted lines indicate Picrosirius red+ areas). Scale bar, 100 μm. (G) Quantification of the area positively stained over total SCO area (one-way ANOVA/Fisher’s LSD multiple comparison test, N = 4–5, 3–4 SCOs per experiment).
Figure 7
Figure 7
Early neuromesodermal fate commitment defects in SMNΔ7 mouse embryos (A–C) (A) Whole-mount image of an E10.5 mouse embryo. Scale bar, 1 mm. The white boxed area indicates the region sectioned coronally to determine neural and mesodermal regions, schematically represented in (B). The blue boxed area corresponds to the caudal progenitor zone, sectioned laterally to identify NMPs, schematically represented in (C). (D) Representative SOX2 (yellow) immunostained coronal sections of E10.5 spinal cord caudal segments. Nuclei stained with Hoechst. Scale bar, 100 μm. (E–H) (E) Quantification of the total spinal cord section (N = 10:5 heterozygote:SMA embryos, 4 quantified sections per embryo are shown). Quantification of the percentage of area occupied by neural tube (SOX2+) (left, relative to total spinal cord area; right, “SMA” relative to “Healthy”) (F) and by mesodermal tissue (SOX2−; Hoechst+) (G) in caudal spinal cord coronal sections and the ratio of neural vs. mesodermal regions (shown as in F) (H) (N = 10:5 heterozygote:SMA embryos). (I) Representative SOX2 (yellow), TBXT (magenta) immunostained lateral sections of E10.5 embryo tail bud regions. Nuclei stained with Hoechst. Scale bar, 100 μm. (J) Quantification of the percentage of NMPs (SOX2+; TBXT+) over the total number of cells (Hoechst+) localized at the tail bud (N = 10:5 heterozygote:SMA embryos). Unpaired two-tailed t test used for statistical analysis. A, anterior; D, dorsal; DA, dorsal aorta; G, gut; MP, mesonephros; NC, notochord; NT, neural tube; P, posterior; S, somite; TBM, tail bud mesoderm; V, ventral.

References

    1. Lefebvre S., Burglen L., Reboullet S., Clermont O., Burlet P., Viollet L., Benichou B., Cruaud C., Millasseau P., Zeviani M., et al. Identification and characterization of a spinal muscular atrophy-determining gene. Cell. 1995;80:155–165. - PubMed
    1. Lefebvre S., Burlet P., Liu Q., Bertrandy S., Clermont O., Munnich A., Dreyfuss G., Melki J. Correlation between severity and SMN protein level in spinal muscular atrophy. Nat. Genet. 1997;16:265–269. doi: 10.1038/ng0797-265. - DOI - PubMed
    1. Lorson C.L., Hahnen E., Androphy E.J., Wirth B. A single nucleotide in the SMN gene regulates splicing and is responsible for spinal muscular atrophy. Proc. Natl. Acad. Sci. USA. 1999;96:6307–6311. - PMC - PubMed
    1. Cho S., Dreyfuss G. A degron created by SMN2 exon 7 skipping is a principal contributor to spinal muscular atrophy severity. Genes Dev. 2010;24:438–442. doi: 10.1101/gad.1884910. - DOI - PMC - PubMed
    1. Lorson C.L., Strasswimmer J., Yao J.M., Baleja J.D., Hahnen E., Wirth B., Le T., Burghes A.H., Androphy E.J. SMN oligomerization defect correlates with spinal muscular atrophy severity. Nat. Genet. 1998;19:63–66. doi: 10.1038/ng0598-63. - DOI - PubMed

MeSH terms

Substances