. 2024 Sep;65(9):100607.
doi: 10.1016/j.jlr.2024.100607. Epub 2024 Jul 25.

Automated preparation of plasma lipids, metabolites, and proteins for LC/MS-based analysis of a high-fat diet in mice

Affiliations

Automated preparation of plasma lipids, metabolites, and proteins for LC/MS-based analysis of a high-fat diet in mice

Ngoc Vu et al. J Lipid Res. 2024 Sep.

Abstract

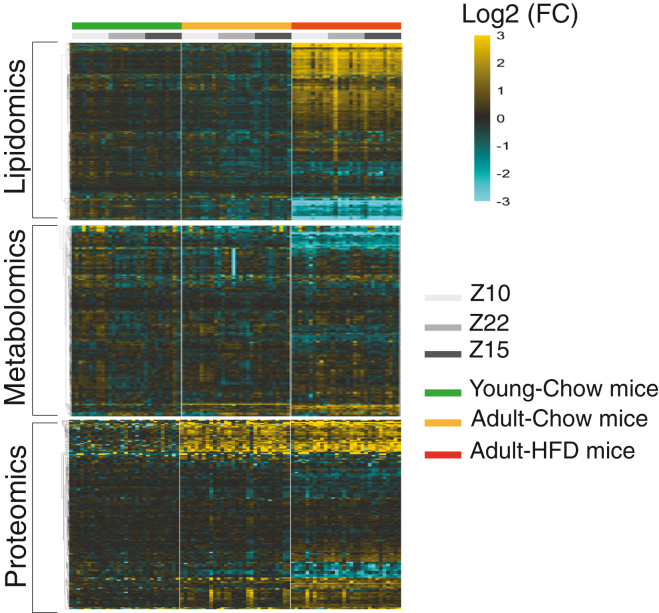
Blood plasma is one of the most commonly analyzed and easily accessible biological samples. Here, we describe an automated liquid-liquid extraction platform that generates accurate, precise, and reproducible samples for metabolomic, lipidomic, and proteomic analyses from a single aliquot of plasma while minimizing hands-on time and avoiding contamination from plasticware. We applied mass spectrometry to examine the metabolome, lipidome, and proteome of 90 plasma samples to determine the effects of age, time of day, and a high-fat diet in mice. From 25 μl of mouse plasma, we identified 907 lipid species from 16 different lipid classes and subclasses, 233 polar metabolites, and 344 proteins. We found that the high-fat diet induced only mild changes in the polar metabolome, upregulated apolipoproteins, and induced substantial shifts in the lipidome, including a significant increase in arachidonic acid and a decrease in eicosapentaenoic acid content across all lipid classes.

Keywords: MTBE-LLE; apolipoprotein; cholesterol/trafficking; dyslipidemias; lipidomics; multiomics; omega-3 fatty acid; phospholipids/metabolism.


Conflict of interest statement

Conflict of interest The authors declare that they have no conflicts of interest with the contents of this article.

Figures

Fig. 1
Fig. 1
PAL-DHR diagram and description of customized parts. Plasma aliquots were stored in the 4°C cabinet (#4). PAL-DHR used its two arms (#1, #2) for liquid transferring and relocating glass vials with magnet caps. Briefly, PAL added the extraction buffers to samples, then vortexed (#3), and centrifuged (#5) to collect lipid and metabolite fractions, which were subsequently stored in the second and third level of the refrigerated vial cabinet. Details of the automated protocol can be found in the Materials and Methods section. DHR, Dual Head Rail.
Fig. 2
Fig. 2
Accuracy and precision of extraction recovery from the automated MTBE-LLE-PAL system. A: Extraction efficiency reported by MTBE-LLE performed by PAL system. Log2 ratios reflect PAL-LLE prepared isotopically labeled internal standards relative to equimolar unlabeled standards added post-LLE (PAL, n = 4). Lipid recovery in the organic layer (brown); Metabolite recovery in the aqueous layer (blue). B: Accuracy and precision of the automated MTBE-PAL. Standard mixtures containing isotopically labeled standards (heavy) and their associated C12 standards (light) were prepared at the ratio (1:0.25, 1:1, 1:4, v/v, (n = 3), followed by LLE separation. Ratios were normalized to controls that did not undergo the LLE. LLE, liquid-liquid extraction; MTBE, methyl tert-butyl ether.
Fig. 3
Fig. 3
Heatmaps of metabolites, lipids, and proteins. Data were row-normalized to the mean value of the young chow-fed mice. Data displayed with hierarchical clustering by row for each data modality separately.
Fig. 4
Fig. 4
Selected changes observed between repeated blood draws with significance from two-way ANOVA analysis within each group of mice. (∗∗∗P ≤ 0.001, ∗∗P ≤ 0.01, ∗P ≤ 0.05). A: Total concentration of TGs and CEs (n = 10). Ammoniated adducts of TG and CE were normalized to their respective labeled standards from Splash Lipidomix. The sum of concentration for all species per animal was calculated and presented here. Data shown are mean ± standard deviation. B: Relative concentrations of APOC3 and APOE at different blood draw time points (q < 0.01). Protein concentrations were normalized to the bridge within each plex. Data shown are mean ± standard deviation. C: Glucose and cortisol levels change with time point in mice (q < 0.01). The intensity of each sample was normalized to the mean signal of adult-chow mice at Z10 (n = 10). Data shown are mean ± standard deviation. APO, apolipoprotein; CE, cholesterol ester; TG, triglyceride.
Fig. 5
Fig. 5
Heatmap of the average of log2 (HFD/Chow) total concentration of PUFA acyl chains for every quantified lipid class at each time point. P-values were calculated using a two-tailed Student’s t test to differentiate adult-HFD-fed mice from adult-chow-fed mice. (∗∗∗P ≤ 0.001, ∗∗P ≤ 0.01, ∗P ≤ 0.05). Missing values are shown as white boxes. HFD, high-fat diet; PUFA, polyunsaturated fatty acid.
Fig. 6
Fig. 6
Significant differences in plasma metabolites and proteins of high fat diet fed mice. A: Polar metabolites associated with lipid metabolism. B: Polar metabolites associated with nitrogen metabolism. C: Lipoproteins. Proteins were normalized to the bridge included in every plex. HFD, high-fat diet (all shown differences q < 0.01; ∗P < 0.05, ∗∗P < 0.01, ∗∗∗P < 0.001).

References

    1. Ignjatovic V., Geyer P.E., Palaniappan K.K., Chaaban J.E., Omenn G.S., Baker M.S., et al. Mass spectrometry-based plasma proteomics: considerations from sample collection to achieving translational data. J. Proteome Res. 2019;18:4085–4097. - PMC - PubMed
    1. Geyer P.E., Voytik E., Treit P.V., Doll S., Kleinhempel A., Niu L., et al. Plasma Proteome Profiling to detect and avoid sample-related biases in biomarker studies. EMBO Mol. Med. 2019;11 - PMC - PubMed
    1. Sun B.B., Maranville J.C., Peters J.E., Stacey D., Staley J.R., Blackshaw J., et al. Genomic atlas of the human plasma proteome. Nature. 2018;558:73–79. - PMC - PubMed
    1. Psychogios N., Hau D.D., Peng J., Guo A.C., Mandal R., Bouatra S., et al. The human serum metabolome. PLoS One. 2011;6 - PMC - PubMed
    1. Mapstone M., Cheema A.K., Fiandaca M.S., Zhong X., Mhyre T.R., MacArthur L.H., et al. Plasma phospholipids identify antecedent memory impairment in older adults. Nat. Med. 2014;20:415–418. - PMC - PubMed

LinkOut - more resources