. 2024 Jul 27;15(1):6332.
doi: 10.1038/s41467-024-50591-8.

A bacteriocin expression platform for targeting pathogenic bacterial species

Affiliations

A bacteriocin expression platform for targeting pathogenic bacterial species

Jack W Rutter et al. Nat Commun. .

Abstract

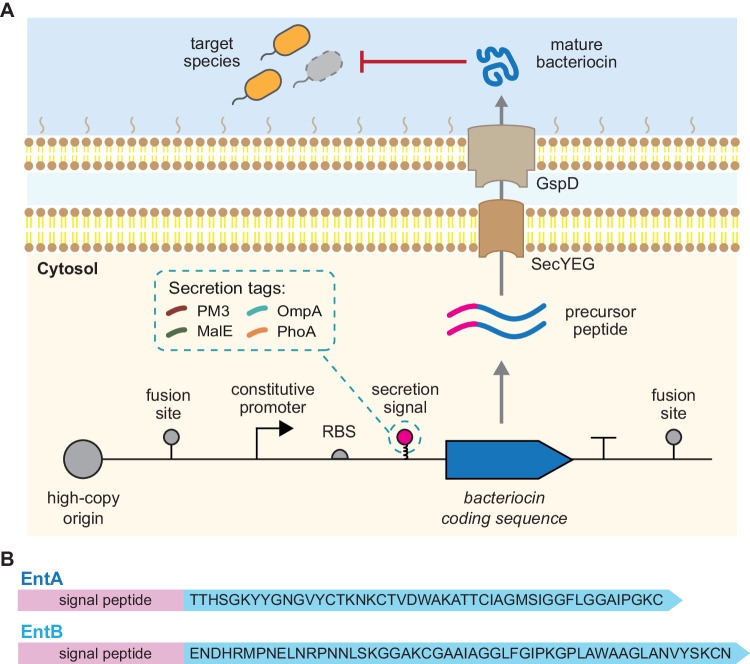
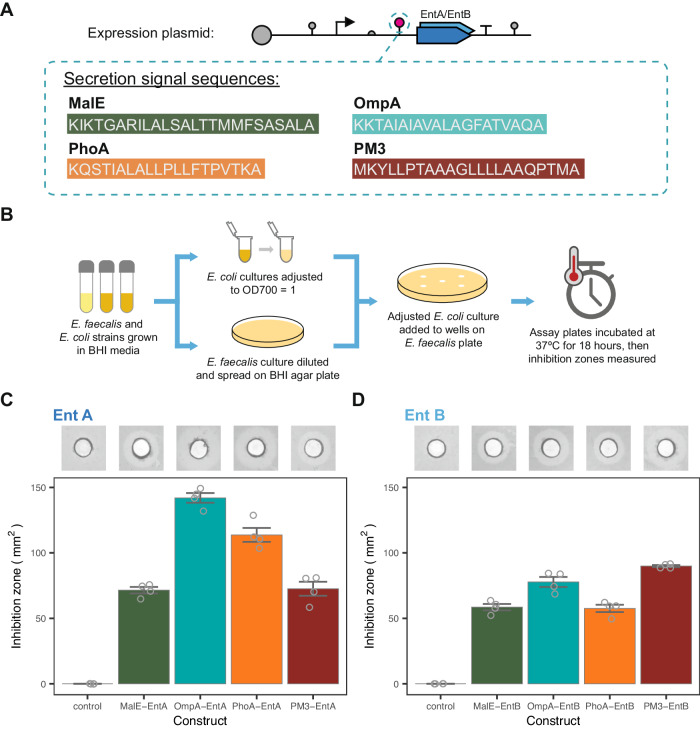
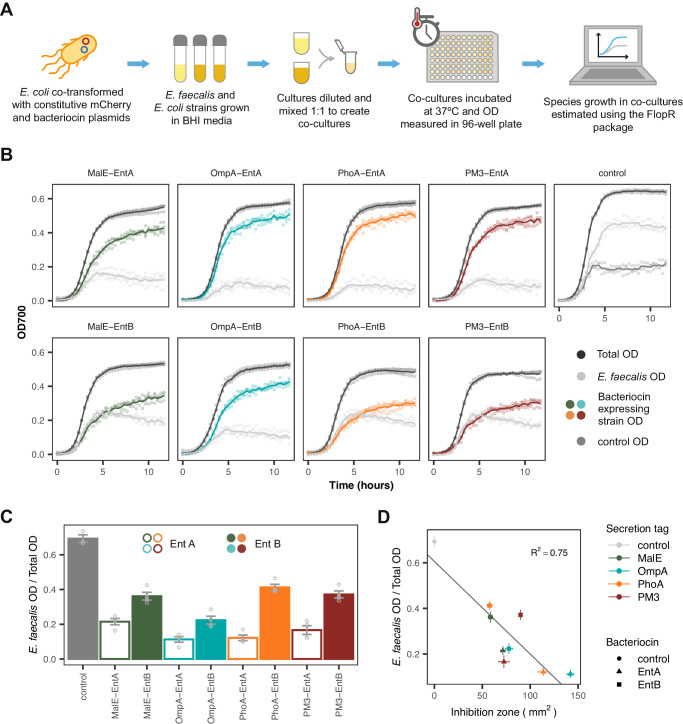
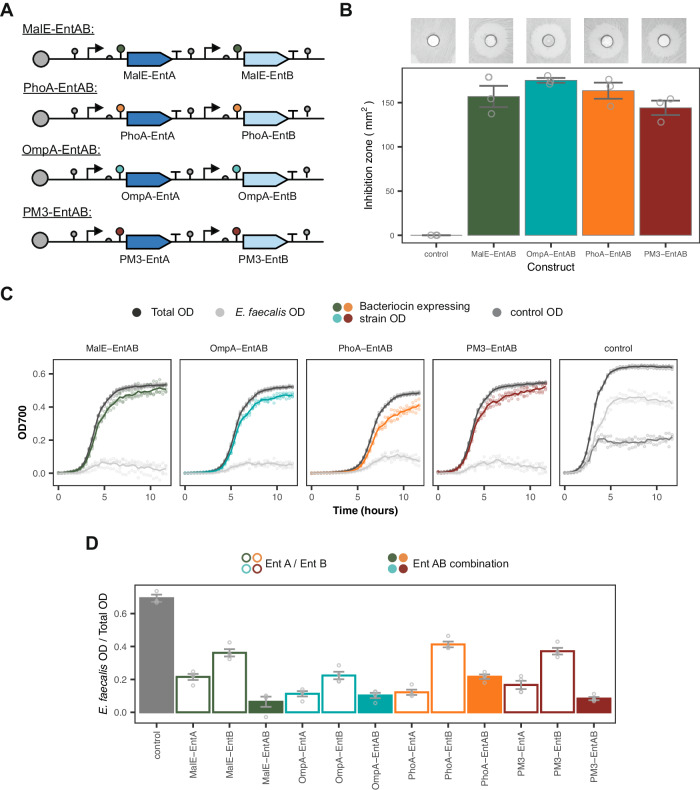
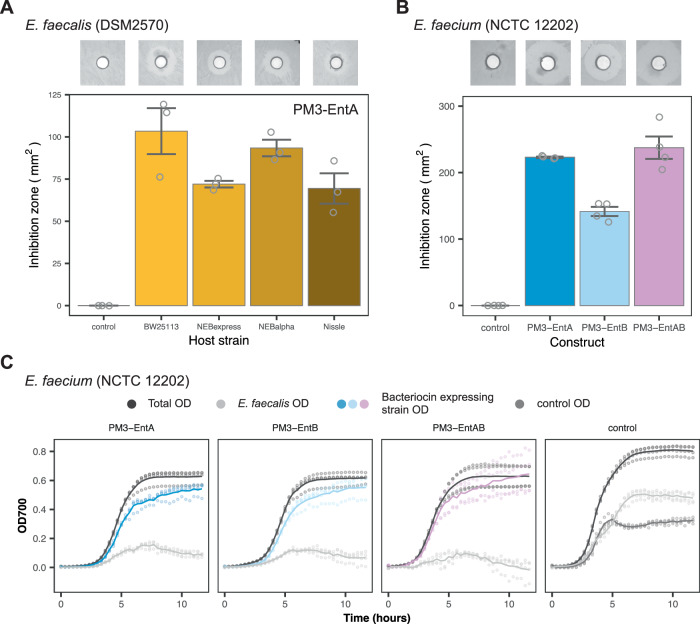
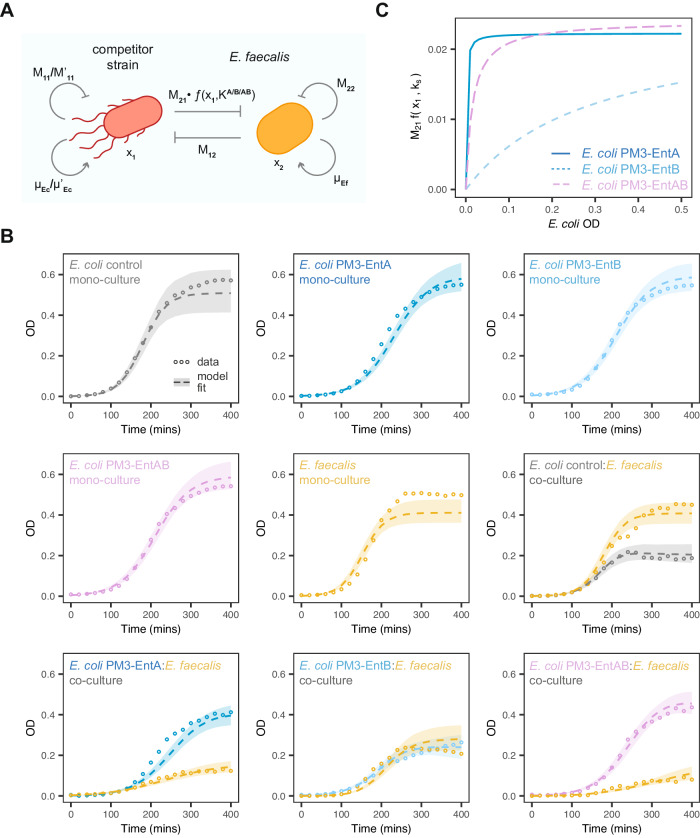
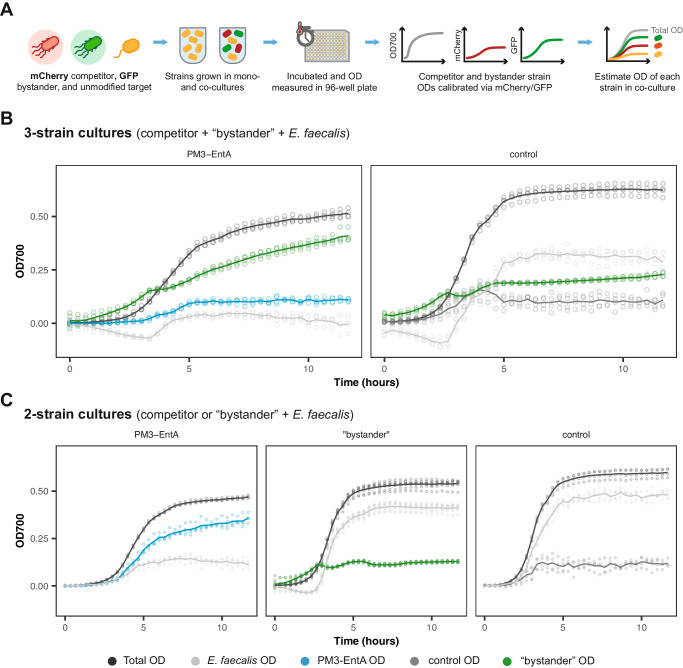
Bacteriocins are antimicrobial peptides that are naturally produced by many bacteria. They hold great potential in the fight against antibiotic resistant bacteria, including ESKAPE pathogens. Engineered live biotherapeutic products (eLBPs) that secrete bacteriocins can be created to deliver targeted bacteriocin production. Here we develop a modular bacteriocin secretion platform that can be used to express and secrete multiple bacteriocins from non-pathogenic Escherichia coli host strains. As a proof of concept we create Enterocin A (EntA) and Enterocin B (EntB) secreting strains that show strong antimicrobial activity against Enterococcus faecalis and Enterococcus faecium in vitro, and characterise this activity in both solid culture and liquid co-culture. We then develop a Lotka-Volterra model that can be used to capture the interactions of these competitor strains. We show that simultaneous exposure to EntA and EntB can delay Enterococcus growth. Our system has the potential to be used as an eLBP to secrete additional bacteriocins for the targeted killing of pathogenic bacteria.


Conflict of interest statement

The authors declare no competing interests.

Figures

Fig. 1
Fig. 1. Overview of the bacteriocin expression platform.
A A high-copy plasmid codes for constitutive expression of a specific bacteriocin fused with one of four different secretion signals. The expressed bacteriocins are secreted from the host cells and can target susceptible species in the extracellular environment. The secretion signals used in this study have previously been reported to exit the cell via the SecYEG inner-membrane and the GspD outer-membrane pore. B The amino acid sequences of the EntA and EntB bacteriocins used in this study.
Fig. 2
Fig. 2. Inhibition zone characterisation of the individual bacteriocin-expressing strains.
A The amino acid sequences of the four secretion signals screened in this study. B The experimental protocol used for solid culture inhibition assays. The measured inhibition zones for EntA C and EntB D secreting strains with all four secretion tags. The control indicates the host strain with no bacteriocin expression plasmid. Insets show representative images of the inhibition zones (central area indicates loading well). Bars indicate mean values ± SE (n = 4 biological repeats). Source data are provided as a source data file.
Fig. 3
Fig. 3. Liquid co-culture characterisation of the individual bacteriocin expressing strains.
A The experimental protocol used for co-culture growth assays. B Growth curves of the competitor strains in co-culture. The labels indicate the bacteriocin construct produced by the engineered competitor strain. Lines indicate mean and points show individual measurements (n = 4 biological repeats). C The estimated ratio of E. faecalis OD over total OD at 10 hours, when grown in co-culture with the indicated strain. Bars indicate mean values ± SE (n = 4 biological repeats). D Comparison of the solid culture inhibition zone vs the 10 hour ratio for each of the co-culture conditions. Solid line shows linear regression fit, with the R2 value labelled. Points give mean value ± SE (n = 4 biological repeats). Source data are provided as a source data file.
Fig. 4
Fig. 4. Full characterisation of the dual-bacteriocin expressing strains.
A Plasmid layout of the co-expressing strains. B Inhibition zones of the dual-secreting strains. Insets show representative images of the inhibition zones. Bars indicate mean values ± SE (n = 3 biological repeats). C Growth curves of strains in co-culture. Labels give bacteriocin construct produced by competitor strain. Lines indicate mean and points show individual measurements (n = 4 biological repeats). D Estimated ratio of E. faecalis OD over total OD at 10 h for the dual-bacteriocin strains compared to the ratios given in Figure 3C, when grown in co-culture. Bars give mean values ± SE (n = 4 biological repeats). Source data are provided as a source data file.
Fig. 5
Fig. 5. Wider application of the expression system, in alternative hosts and targeting vancomycin-resistant E. faecium.
A Inhibition zone assay of the PM3-EntA construct in multiple E. coli host strains against E. faecalis. Insets show representative images of the inhibition zones observed. Bars give mean values ± SE (n = 3 biological repeats). B Inhibition zone assays for the given constructs against a Vancomycin-resistant E. faecium isolate. Bars give mean values ± SE (n = 4 biological repeats). C The growth curves of E. faecium grown in co-culture with the labelled competitor strain. Lines indicate mean and points show individual measurements (n = 4 biological repeats). Source data are provided as a source data file.
Fig. 6
Fig. 6. Lotka–Volterra model fitting of co-culture growth dynamics.
A Schematic of the major model parameters, xi refers to species, μi to species growth rate and Mij to species interactions. B Fitted growth curves for the labelled mono- and co-cultures (circles give mean experimental value, dashed lines give the median simulated timecourse and shaded regions the 95% credible region). C The fitted interaction term (M21 ⋅ f(x1, ks)) against the estimated OD for the given strains, using the median of the posterior distribution. Source data are provided as a source data file.
Fig. 7
Fig. 7. Three-strain community culture dynamics.
A Overview of the experimental process for measuring growth in the three-strain communities. GFP and mCherry fluorescent signals are used to estimate the OD of the bystander and competitor strains, respectively. B Growth curves of the PM3-EntA competitor, bystander and E. faecalis (left panel) and the control competitor, bystander and E. faecalis (right panel) strains in co-culture. C Growth curves of the PM3-EntA, bystander or control strain in co-culture with the E. faecalis target strain in a two-strain co-culture. Lines indicate mean and points show individual measurements (n = 4 biological repeats). Source data are provided as a source data file.

References

    1. Bai, X. et al. Engineering the gut microbiome. Nat. Rev. Bioeng.1, 665–679 (2023).10.1038/s44222-023-00072-2 - DOI
    1. Riglar, D. T. & Silver, P. A. Engineering bacteria for diagnostic and therapeutic applications. Nat. Rev. Microbiol.16, 214–225 (2018). 10.1038/nrmicro.2017.172 - DOI - PubMed
    1. Zhou, Z. et al. Engineering probiotics as living diagnostics and therapeutics for improving human health. Microb. Cell Factories19, 56 (2020).10.1186/s12934-020-01318-z - DOI - PMC - PubMed
    1. Charbonneau, M. R., Isabella, V. M., Li, N. & Kurtz, C. B. Developing a new class of engineered live bacterial therapeutics to treat human diseases. Nat. Commun.11, 1738 (2020). 10.1038/s41467-020-15508-1 - DOI - PMC - PubMed
    1. Ozdemir, T., Fedorec, A. J., Danino, T. & Barnes, C. P. Synthetic biology and engineered live biotherapeutics: Toward increasing system complexity. Cell Syst.7, 5–16 (2018). 10.1016/j.cels.2018.06.008 - DOI - PubMed

MeSH terms