. 2024 Jul 27;15(1):6331.
doi: 10.1038/s41467-024-50537-0.

Increased AID results in mutations at the CRLF2 locus implicated in Latin American ALL health disparities

Affiliations

Increased AID results in mutations at the CRLF2 locus implicated in Latin American ALL health disparities

Valeria Rangel et al. Nat Commun. .

Abstract

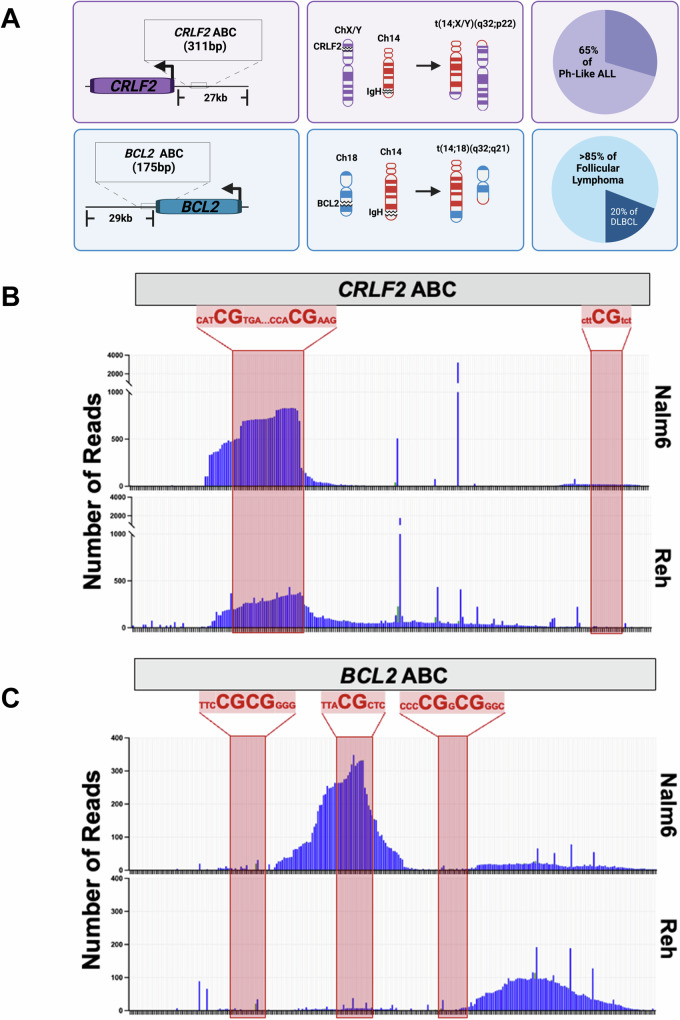
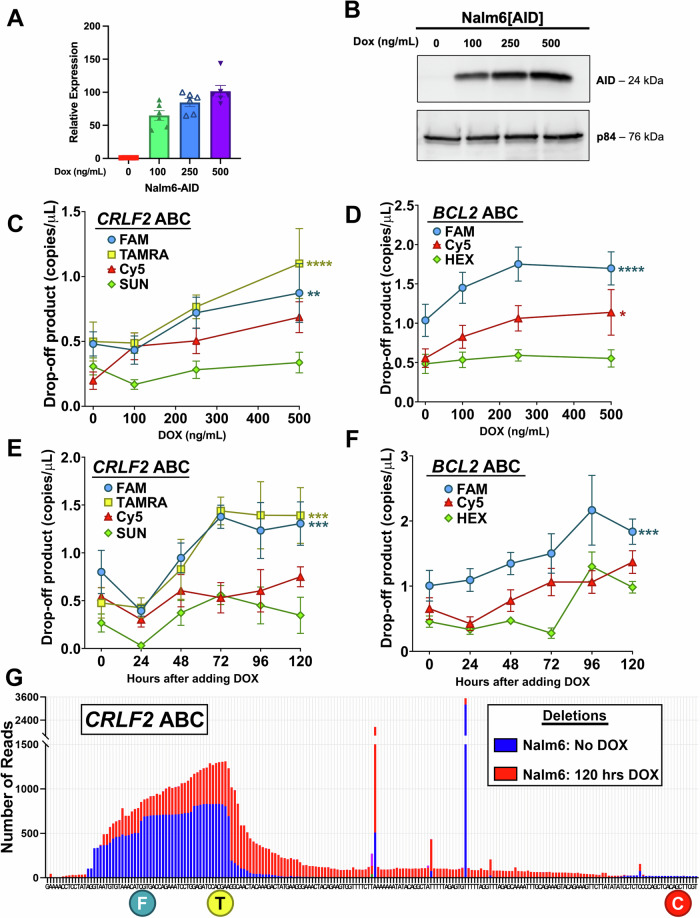
Activation-induced cytidine deaminase (AID) is a B cell-specific mutator required for antibody diversification. However, it is also implicated in the etiology of several B cell malignancies. Evaluating the AID-induced mutation load in patients at-risk for certain blood cancers is critical in assessing disease severity and treatment options. We have developed a digital PCR (dPCR) assay that allows us to quantify mutations resulting from AID modification or DNA double-strand break (DSB) formation and repair at sites known to be prone to DSBs. Implementation of this assay shows that increased AID levels in immature B cells increase genome instability at loci linked to chromosomal translocation formation. This includes the CRLF2 locus that is often involved in translocations associated with a subtype of acute lymphoblastic leukemia (ALL) that disproportionately affects Hispanics, particularly those with Latin American ancestry. Using dPCR, we characterize the CRLF2 locus in B cell-derived genomic DNA from both Hispanic ALL patients and healthy Hispanic donors and found increased mutations in both, suggesting that vulnerability to DNA damage at CRLF2 may be driving this health disparity. Our ability to detect and quantify these mutations will potentiate future risk identification, early detection of cancers, and reduction of associated cancer health disparities.


Conflict of interest statement

The authors declare no competing interests.

Figures

Fig. 1
Fig. 1. AID Break Clusters (ABCs) associated with recurrent translocations in B cell cancers show evidence of genome instability.
A Diagram of CRLF2 and BCL2 ABC sites and their locations relative to their corresponding gene. The oncogenic translocations formed between each of the two ABC sites and IGH are represented in the middle column, where pathological (AID) and physiological (RAG) double-stranded breaks are portrayed by open gaps in the chromosomes. The percentage of the B cell cancer subtypes associated with the oncogenic translocations are shown in the last column with data taken from,,. Insertion and deletion (indel) events detected by AmpSeq at B CRLF2 and C BCL2 ABC sites in Nalm6 (top panel) and Reh (bottom panel) cells. CpG sites spanning each of the three ABC sites are represented by the partial nucleotide sequence shown above the red highlighted regions overlaying the amplicon sequencing data (see Supplementary Fig. 1 for detailed sequence information). Each bar represents changes at a single base pair with deletions (blue) more dominant than insertions (green). Based on the December 2013 GRch38/gh38 build of the human genome, the coordinates for the CRLF2 ABC are ChrX:1,228,310-1,228,969 (same for the Y chromosome) and the coordinates for the BCL2 MBR ABC are Chr18:63,126,040-63,126,870. Figure 1A created with BioRender.com released under a Creative Commons Attribution-NonCommercial-NoDerivs 4.0 International license. Source data are provided as a Source Data file.
Fig. 2
Fig. 2. Digital PCR (dPCR) can detect and quantify indels following DSB formation and repair at the CRLF2 ABC.
A Workflow for dPCR assay using the Applied Biosystems Absolute-Q. Prepared gDNA is combined with amplicon primers, TaqMan probes, and master mix then loaded onto a MAP16 plate where the reaction is partitioned into over 20,000 microchambers. A representative experiment showing quantification of fluorescent signal from 4 channels indicates the detected signal from each microchamber. B Schematic of FAM, TAMRA, Cy5 and SUN drop-off probe binding sites within the CRLF2 ABC region. C dPCR results in cells with no Cas9 cutting. Results are shown as a 2D scatterplot with the fluorescent signal from each of 20,000 individual microchambers indicated. Colors represent SUN alone (green) TAMRA alone (yellow/green), SUN + TAMRA (blue), or microchambers with no signal (black). While only TAMRA and SUN are shown here, fluorescent signals from all four probes are gathered simultaneously. D dPCR results as a 2D scatter plot following Cas9 cutting after transfection of a vector expressing sgCRLF2-1 in a Nalm6 cell line with an integrated Cas9 expression cassette (Nalm6-Cas9). The increase in SUN alone signal indicates a significant drop-off of the TAMRA probe binding the Cas9 cut site (Supplementary Fig. 1A). E Quantification of drop-off product in copies/μL as determined by detection of amplicons that are bound by the FAM, TAMRA, Cy5 and/or SUN probes in Nalm6-Cas9 cells following transfection of a vector expressing either sgCRLF2-1 or sgCRLF2-3. Drop-off product of sgCRLF2-1 and sgCRLF2-3 is plotted as mean values ± SEM from 3 biological replicates. Statistical significance was determined by unpaired student’s t test, with **p < 0.01 (p = 0.0014 for sgCRLF2-1, p = 0.0093 for sgCRLF2-3) (n = 3 for sgCRLF2-1, n = 3 for sgCRLF2-3). Figures 2A and 2B created with BioRender.com released under a Creative Commons Attribution-NonCommercial-NoDerivs 4.0 International license. Source data are provided as a Source Data file.
Fig. 3
Fig. 3. dPCR detects increased indels in response to increased AID expression in human pre-B cell lines.
A Relative expression of the AICDA gene encoding AID in Nalm6 cells with a lentivirally-integrated dox-inducible AID cassette determined by qPCR in cells cultured with indicated amounts of doxycycline. Relative expression data is plotted as mean values ± SEM from 6 biological replicates (n = 6). B Western blot showing protein abundance of AID in dox-induced Nalm6-AID cells relative to p84. C Quantification of dPCR drop-off products for the FAM, TAMRA, Cy5 and SUN probes associated with the CRLF2 ABC site using gDNA harvested from Nalm6-AID cells induced with indicated concentrations of doxycycline. Drop-off product data is plotted as mean values ± SEM from 3 biological replicates. Statistical significance was determined by two-way ANOVA with Dunnett’s multiple comparisons test to compare to the SUN drop-off values.**p < 0.01 and ****p < 0.0001 (p = 0.0012 for FAM, p < 0.0001 for TAMRA)(n = 9 for FAM, TAMRA, Cy5 and SUN). D Quantification of dPCR drop-off products for the FAM, Cy5 and HEX probes associated with the BCL2 ABC using gDNA harvested from Nalm6-AID cells induced with the indicated concentrations of doxycycline. Drop-off product data is plotted as mean values ± SEM from 3 biological replicates. Statistical significance was determined by two-way ANOVA with Dunnett’s multiple comparisons test to compare to the HEX drop-off values. *p < 0.05 and ****p < 0.0001 (p < 0.0001 for FAM, p = 0.0369 for Cy5)(n = 8 for FAM, Cy5 and HEX). E Quantification of dPCR drop-off products for the FAM, TAMRA, Cy5 and SUN probes associated with the CRLF2 ABC site using gDNA harvested every 24 hours from Nalm6-AID cells induced with 1 μg/mL of doxycycline over a 120-hour time period. Drop-off product data is plotted as mean values ± SEM from 4 biological replicates. Statistical significance was determined by two-way ANOVA with Dunnett’s multiple comparisons test to compare to the SUN drop-off values. ***p < 0.001 (p = 0.0003 for FAM, p = 0.0003 for TAMRA) (n = 4 for FAM, TAMRA, Cy5 and SUN). F Quantification of dPCR drop-off products for the FAM, Cy5 and HEX probes associated with the BCL2 ABC site using gDNA harvested every 24 hours from Nalm6-AID cells induced with 1 μg/mL of doxycycline over a 120-hour time period. Drop-off product data is plotted as mean values ± SEM from 4 biological replicates. Statistical significance was determined by two-way ANOVA with Dunnett’s multiple comparisons test to compare to the HEX drop-off values. ***p < 0.001 (p = 0.0006) (n = 4 for FAM, Cy5 and HEX). G Comparison of AmpSeq indel events in Nalm6 cells vs. Nalm6-AID cells induced with 1 µg/mL of doxycycline for 120 hours. The two stand-alone peaks in this region are by-products of amplicon generation as they map to a run of A’s and a run T’s and are not due to AID. Source data are provided as a Source Data file.
Fig. 4
Fig. 4. Expression analysis on Ph-like, Ph-, and Ph+ ALL cohorts shows detection of variable CRLF2 and AID expression levels in LA patients.
(A) Relative expression of CRLF2 from the indicated patient samples. Blue are Hispanic patients diagnosed with the indicated ALL subtype and red are Asian patients diagnosed with the indicated ALL subtype. Relative expression is plotted as mean values ± SEM from technical replicates of each individual patients (n = 5 for Ph + : P3) (n = 3 for Ph-Like: P1, P2, Ph+: P1, P2, P4, ALL: P1, P2) (n = 2 for Ph-Like: P3, P4, P6, P9.) B Relative expression of AICDA (gene encoding AID) from the indicated patient samples. Blue are Hispanic patients diagnosed with the indicated ALL subtype and red are Asian patients diagnosed with the indicated ALL subtype. Relative expression is plotted as mean values ± SEM from technical replicates of each individual patient (n = 7 for Ph+: P3) (n = 3 for Ph-Like: P1, P2, Ph+: P1, P2, ALL: P1, P2) (n = 2 for Ph-Like: P3, P4, P6, P8, Ph+: P4.) C Volcano plot depicting differently expressed genes (DEGs) between Ph-like-1 and Ph-like-2 (blue) versus Ph+1 and Ph+2 (red). A complete list of DEGs are shown in Supplementary Data 2. Significance is calculated using a Wald t-test. Gene Set Enrichment Analysis (GSEA) was performed using the GO Biological Process pathway database showing pathway enrichment from the D Ph-like −1 and Ph-like-2 and E patients Ph + −1 and Ph+2. Source data are provided as a Source Data file.
Fig. 5
Fig. 5. dPCR of Hispanic Ph-like ALL patients and healthy donors shows increased mutation at CRLF2.
A Comparison of quantified drop-off product for the FAM, TAMRA, Cy5 and SUN probes associated with the CRLF2 ABC between Hispanic Ph-Like ALL patients with CRLF2::IGH or P2RY8::CRLF2 rearrangements. Each data point represents the mean from at least 6 technical replicates using gDNA from an individual patient. Drop-off product for CRLF2::IgH is plotted as mean values ± SEM from 3 individual diagnosed patients. Drop-off product for P2RY8::CRLF2 is plotted as mean values ± SEM from 4 individual diagnosed patients. Statistical significance was determined by unpaired student’s t test, with *p < 0.05 (p = 0.0354 for FAM, p = 0.0185 for Cy5) (n = 3 for CRLF2::IgH, n = 4 for P2RY8::CRLF2). B Individual drop-off product for the FAM, TAMRA, Cy5 and SUN probes associated with the CRLF2 ABC in Ph-Like-4 and Ph + −2 patients. Drop-off product for Ph-Like-4 is plotted as mean values ± SEM from 8 technical replicates. Drop-off product for Ph + −2 is plotted as mean values ± SEM from 6 technical replicates. Statistical significance was determined by unpaired student’s t test, with ****p < 0.0001 (p < 0.0001 for Ph-Like−4, p < 0.0001 for Ph + −2) (n = 8 for Ph-Like-4, n = 6 for Ph + −2). C Circular view plot generated from long read whole genome sequencing of patient Ph-Like−4 and D patient Ph + −2 using the web-based Integrated Genomics Viewer (IGV) program. Connected lines show rearrangements involving two chromosomes and vertical lines show instability at the locus of one chromosome. Quantified drop-off product comparison between CD19- peripheral blood mononuclear cells (PBMC’s) and isolated CD19+ cells in healthy Hispanics donors versus healthy non-Hispanic donors in the E CRLF2 ABC and the F BCL2 ABC. Each data point represents the mean from at least 6 technical replicates using gDNA from an individual patient. Drop-off product for CRLF2 ABC (E) is plotted as mean values ± SEM from individual healthy Hispanic and non-Hispanic donors. Statistical significance was determined by unpaired student’s t test, with *p < 0.05 and ***p < 0.001 (p = 0.0492 for FAM, p = 0.0001 for SUN) (n = 5 for Healthy Hispanic, n = 6 for Healthy Non-Hispanic). Drop-off product for BCL2 ABC (F) is plotted as mean values ± SEM from individual healthy Hispanic and non-Hispanic donors. Statistical significance was determined by unpaired student’s t test, with **p < 0.01 (p = 0.0061 for Cy5) (n = 4 for CD19- from Healthy Hispanic, n = 3 for CD19+ from Healthy Hispanics, n = 4 for CD19- from Healthy Non-Hispanic, n = 5 for CD19+ from Healthy Non-Hispanics). Source data are provided as a Source Data file.
Fig. 6
Fig. 6. Model of chromosomal translocation formation between the IGH and CRLF2 loci in B cell Ph-like ALL.
Healthy pro-B/pre-B cells express high levels of the Recombination Activating Gene (RAG) complex to carry out V(D)J recombination to maintain functional adaptive immunity. First D and J regions are combined as shown in the top panel. In subsequent steps, RAG induced DSBs join V to DJ regions (not shown). High levels of IGH transcription in B cells are maintained by the presence of the mu enhancer (Emu) located between the VDJ and constant region gene cassettes of IGH (for simplicity, the constant region cassettes are not shown). The bottom panel shows that cells are transformed into a cancer state when RAG and AID are expressed simultaneously to generate RAG-induced DSBs at IGH and AID-induced DSBs at ABC sites such as CRLF2. Aberrant repair of these DSBs results in a chromosomal translocation placing Emu upstream of CRLF2 leading to overexpression that puts the cells into a hyperproliferative state. Figure 6 created with BioRender.com released under a Creative Commons Attribution-NonCommercial-NoDerivs 4.0 International license.

Update of

References

    1. Liu, C., Zhang, Y., Liu, C. C. & Schatz, D. G. Structural insights into the evolution of the RAG recombinase. Nat. Rev. Immunol.22, 353–370 (2022). 10.1038/s41577-021-00628-6 - DOI - PubMed
    1. Boehm, T. et al. Evolution of Alternative Adaptive Immune Systems in Vertebrates. Annu. Rev. Immunol.36, 19–42 (2018). 10.1146/annurev-immunol-042617-053028 - DOI - PubMed
    1. Lieber, M. R. Mechanisms of human lymphoid chromosomal translocations. Nat. Rev. Cancer16, 387–398 (2016). 10.1038/nrc.2016.40 - DOI - PMC - PubMed
    1. Bednarski, J. J. et al. RAG-mediated DNA double-strand breaks activate a cell type-specific checkpoint to inhibit pre-B cell receptor signals. J. Exp. Med.213, 209–223 (2016). 10.1084/jem.20151048 - DOI - PMC - PubMed
    1. Muramatsu, M. et al. Class switch recombination and somatic hypermutation require activation-induced cytidine deaminase (AID), a member of the RNA editing cytidine deaminase family. Cell102, 541–544 (2000). 10.1016/S0092-8674(00)00078-7 - DOI - PubMed

Substances