. 2024 Jul 27;15(1):6340.
doi: 10.1038/s41467-024-50466-y.

Adenosine triggers early astrocyte reactivity that provokes microglial responses and drives the pathogenesis of sepsis-associated encephalopathy in mice

Affiliations

Adenosine triggers early astrocyte reactivity that provokes microglial responses and drives the pathogenesis of sepsis-associated encephalopathy in mice

Qilin Guo et al. Nat Commun. .

Erratum in

Abstract

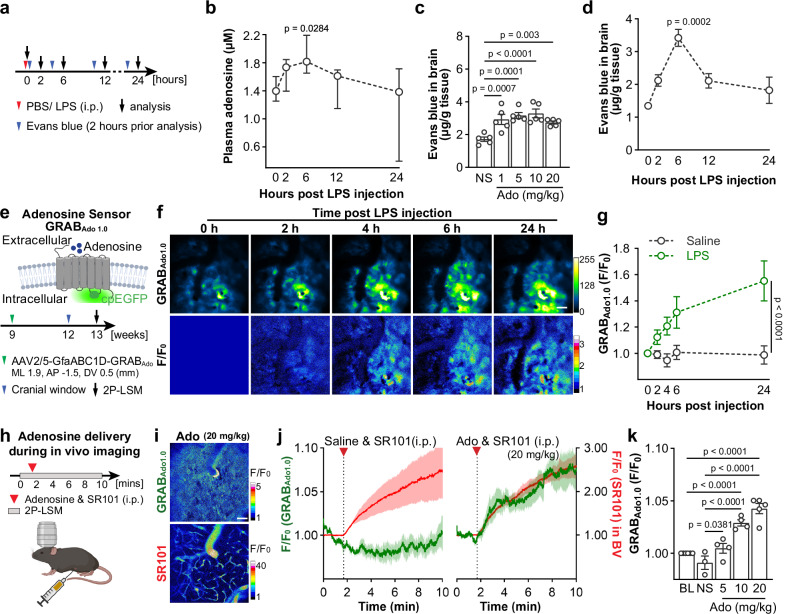
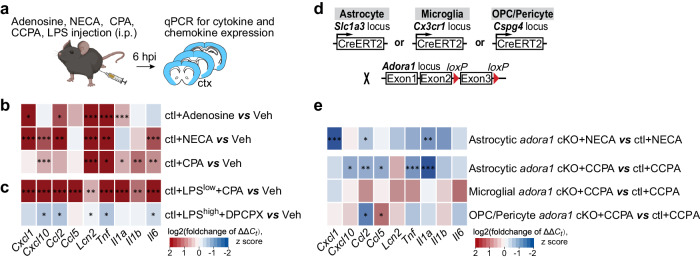
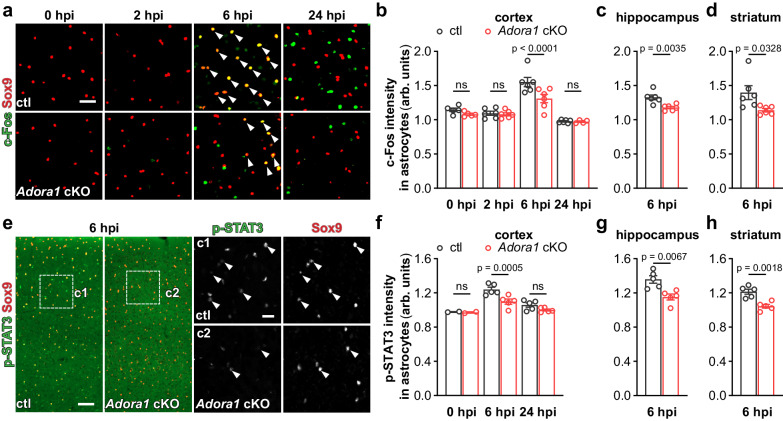
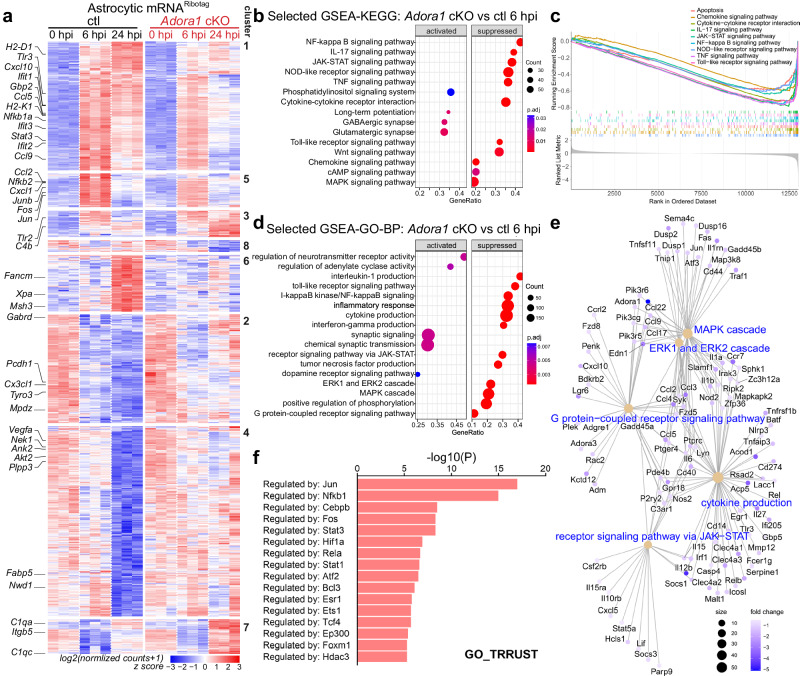
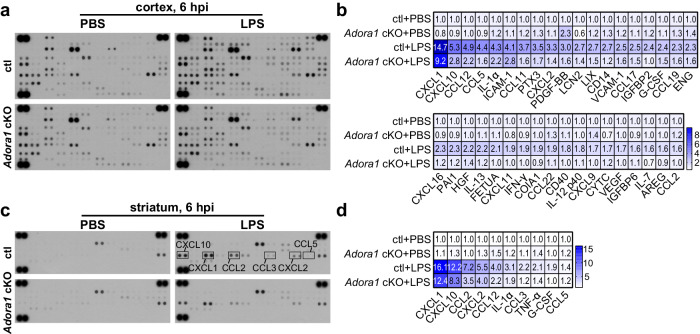
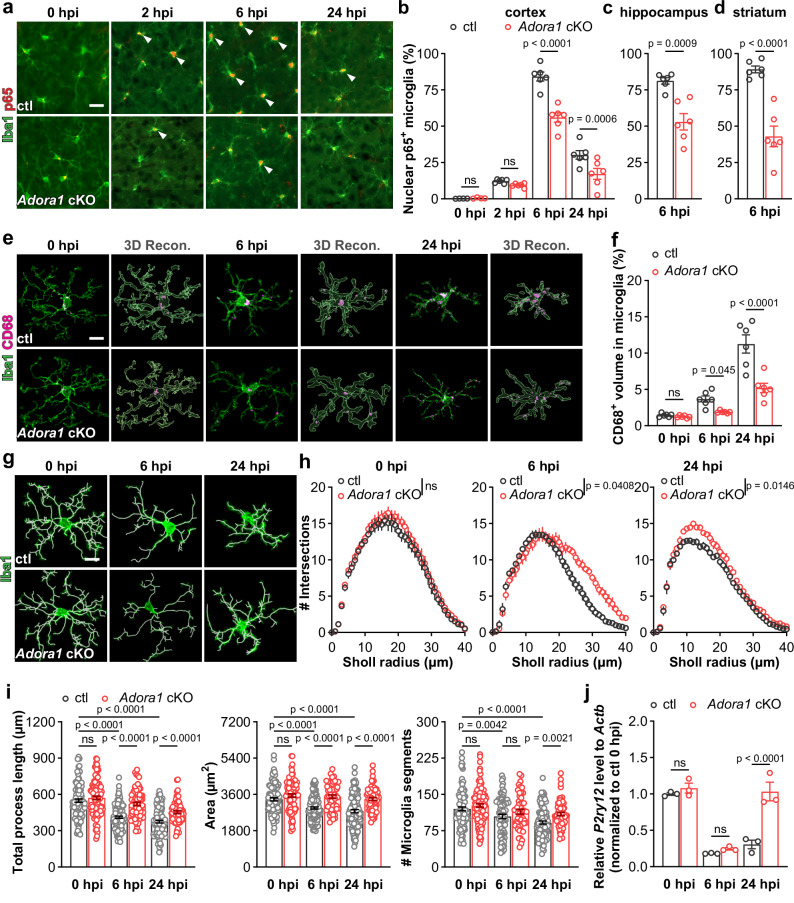
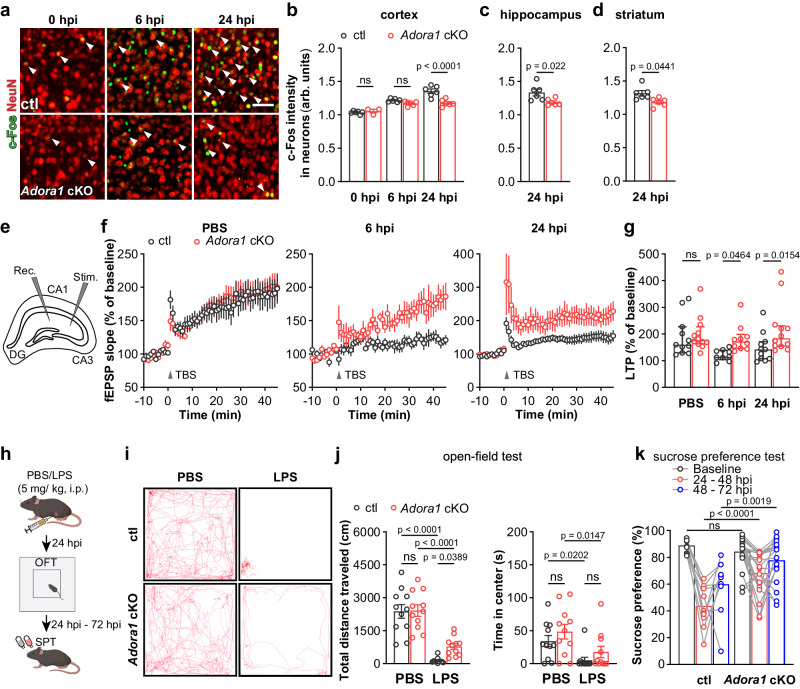
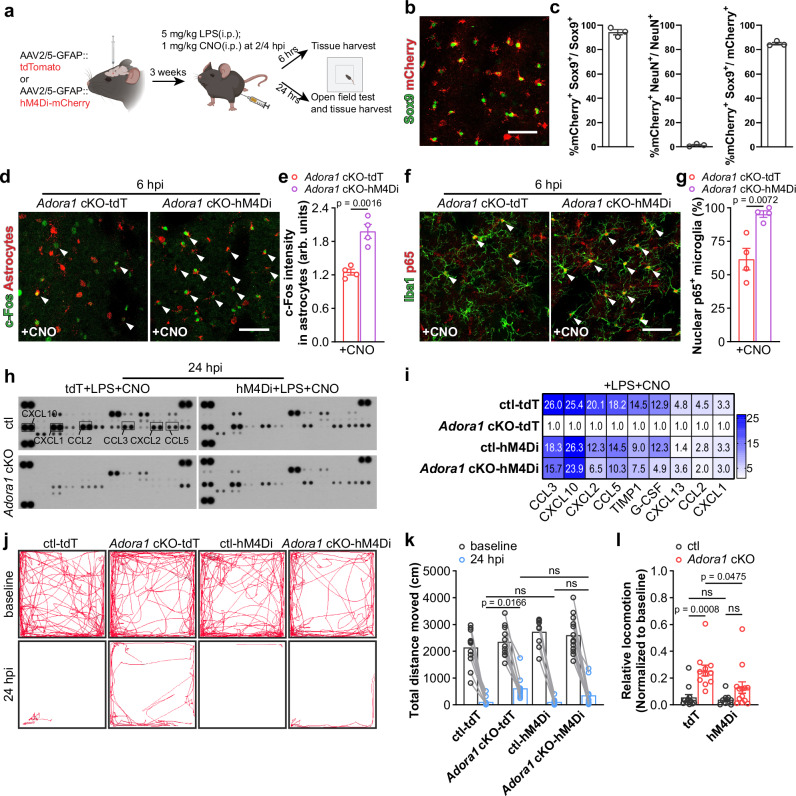
Molecular pathways mediating systemic inflammation entering the brain parenchyma to induce sepsis-associated encephalopathy (SAE) remain elusive. Here, we report that in mice during the first 6 hours of peripheral lipopolysaccharide (LPS)-evoked systemic inflammation (6 hpi), the plasma level of adenosine quickly increased and enhanced the tone of central extracellular adenosine which then provoked neuroinflammation by triggering early astrocyte reactivity. Specific ablation of astrocytic Gi protein-coupled A1 adenosine receptors (A1ARs) prevented this early reactivity and reduced the levels of inflammatory factors (e.g., CCL2, CCL5, and CXCL1) in astrocytes, thereby alleviating microglial reaction, ameliorating blood-brain barrier disruption, peripheral immune cell infiltration, neuronal dysfunction, and depression-like behaviour in the mice. Chemogenetic stimulation of Gi signaling in A1AR-deficent astrocytes at 2 and 4 hpi of LPS injection could restore neuroinflammation and depression-like behaviour, highlighting astrocytes rather than microglia as early drivers of neuroinflammation. Our results identify early astrocyte reactivity towards peripheral and central levels of adenosine as an important pathway driving SAE and highlight the potential of targeting A1ARs for therapeutic intervention.


Conflict of interest statement

The authors declare no competing interests

Figures

Fig. 1
Fig. 1. Peripheral LPS challenges increase adenosine levels in the blood and brain.
a Schematic illustration of the experimental setup and time course for analysis of plasma adenosine levels and Evans blue (EB) injection. b Plasma adenosine concentration rapidly increased post peripheral LPS injection (n = 5 mice for each time point). c EB extravasations increased in the brain after peripheral adenosine injection. (n = 5 mice for each time point). NS: saline; Ado: adenosine. d Peripheral LPS injection increased EB extravasations in the mouse brain (n = 3 mice for each time point). e Schematic illustration of the principle of the GRABAdo1.0 sensors (up) and cortical extracellular adenosine level measurement post LPS injection by using GRABAdo1.0 in vivo 2P-LSM live imaging (down). GfaABC1D-GRABAdo1.0 plasmids were delivered to cortical astrocytes via AAV2/5 injection according to the coordinates indicated in the scheme. f Representative fluorescence images (up) and pseudocolor images (down) of GRABAdo1.0 signals post peripheral LPS injection. Scale bar = 50 μm. g Comparison of relative fluorescence intensities (F.I.) of GRABAdo1.0 acquired in the LPS/Saline injection model. The recording of 0 h after LPS/Saline injection was used as F0. (n = 3 mice per group). h Schematic illustration of injection of adenosine supplemented with SR101 (i.p.) during the in vivo imaging of GRABAdo1.0. i Representative pseudocolor images of GRABAdo1.0 signal and SR101 signal after a peripheral adenosine and SR101 injection. Scale bar = 50 μm. (n = 5 mice). j Increase of GRABAdo1.0 signal (green) after the injection of adenosine (20 mg/kg, i.p.) was concomitant with the increase of SR101 signal (red) in blood vessels (BV), while GRABado1.0 signal is not altered after saline injection. k Relative fluorescence intensities (F.I.) of GRABAdo1.0 upon applications of various dosages of adenosine. The baseline was used as F0. (baseline n = 6 mice, saline n = 3 mice, ado 5 mg/kg n = 4 mice, ado 10 mg/kg n = 4 mice, ado 20 mg/kg n = 5 mice). BL: baseline; NS: saline; Ado: adenosine. Summary data are presented as mean ± SEM in c, d, g, j, k, and as median ± IQR in b. Statistical significance in b was assessed using Kruskal–Wallis test uncorrected Dunn’s test; statistical significance in c, k were assessed by one-way ANOVA, Fisher’s LSD test; statistical significance in g was assessed by two-way ANOVA, Fisher’s LSD test. Source data are provided as a Source Data file. Panels e, h was created with BioRender.com released under a Creative Commons Attribution-NonCommercial-NoDerivs 4.0 International license.
Fig. 2
Fig. 2. Peripheral adenosine administration evokes upregulation of inflammation-related genes in the brain.
a Schematic illustration of adenosine, adenosine analogue (NECA), A1 adenosine receptor (A1AR) agonists (CPA, CCPA), and A1AR antagonist (DPCPX) administration experiments. b Expression of inflammation-related genes was enhanced in the mouse cortex six hours post adenosine, NECA, and CPA injections (n = 3 mice per group). c CPA further upregulated the inflammation-related genes in the cortex induced by a peripheral LPSlow (1 mg/kg, i.p.) injection. (n = 3 mice per group). However, DPCPX administration reduced the inflammation-related genes in the cortex induced by a peripheral LPShigh (5 mg/kg, i.p.) injection. (n = 3 mice per group). d Schematic illustration of mouse breeding. e Inflammation-related gene expressions were reduced in the cortex of astrocytic Adora1 cKO mice at 6 hours post NECA (n = 3 mice per group) and CCPA (n = 6 mice per group) injection compared to ctl mice, which was not observed in mice with specific ablation of Adora1 in microglia (using Cx3CR1-CreERT2 mice) and oligodendrocyte precursor cells/pericytes (using NG2-CreERT2 mice, only Ccl2 was reduced while Ccl5 increased). Summary data are presented as the log2(foldchange of ΔΔCt). Statistical significance of each gene expression in b, c, e was assessed to ctl+veh using two tailed unpaired Student’s t test. Bar graphs of b, c, e was presented in Supplementary Fig. 2a–i. Source data and exact P values are provided in the Source Data file. Panel a was created with BioRender.com released under a Creative Commons Attribution-NonCommercial-NoDerivs 4.0 International license.
Fig. 3
Fig. 3. A1AR-deficient astrocytes are less reactive to the peripheral LPS challenge.
a Representative images of c-Fos expression in cortical Sox9+ astrocytes (arrowheads) post LPS injection. Scale bar = 20 μm. bd Astrocytic c-Fos immunofluorescence intensity (arbitrary unit, arb. units) was enhanced at 6 hpi in the cortex, hippocampus, and stratum of ctl mice which was inhibited in Adora1 cKO mice (n = 5 mice in ctl and Adora1 cKO at 0 hpi, n = 6 mice in ctl and Adora1 cKO at 2 hpi and 6 hpi, n = 6 mice in ctl at 24 hpi, n = 4 mice in Adora1 cKO at 24 hpi). e Representative images of p-STAT3 expression in cortical Sox9+ astrocytes (arrowheads) post LPS injection. Scale bar = 50 μm in e and 20 μm in c1, c2. fh Astrocytic p-STAT3 immunofluorescence intensity (arb. units) was enhanced at 6 hpi in the cortex, hippocampus, and stratum of ctl mice which was inhibited in Adora1 cKO mice (n = 2 mice in ctl and Adora1 cKO at 0 hpi, n = 5 mice in ctl and Adora1 cKO at 6 hpi and 24 hpi). Summary data of bd, fh are presented as the mean ± SEM. Statistical significance in b, f was assessed by two-way ANOVA, Fisher’s LSD test; statistical significance in (c, d, g, h) were assessed by two tailed unpaired Student’s t test, ns: p > 0.05. Source data are provided as a Source Data file.
Fig. 4
Fig. 4. A1AR activation contributes to the altered transcriptional profile of astrocytes upon peripheral LPS challenge.
a Heatmap of altered gene expression (Padj <0.05) from astrocytic mRNARiboTag of male Adora1 cKO and ctl mice in any of the three time points (n = 3 mice per group). Clustering was done with 8 K-means. b Selected GSEA-KEGG pathway analysis of the astrocytic RNA-seq dataset between the Adora1 cKO and ctl groups at 6 hpi. c Selected GSEA plot of the enriched KEGG pathways related to inflammation between the Adora1 cKO and ctl groups at 6 hpi. d Selected GSEA-GO pathway analysis of the astrocytic RNA-seq dataset between the Adora1 cKO and ctl groups at 6 hpi. e Category net plot of selected enriched GO pathways relative to G protein-coupled receptor signaling pathway. The color gradient indicates the fold changes between the Adora1 cKO and ctl groups. f Prediction of transcription regulators following expression pattern of sub-clusters (cluster 1 and 5) by Metascape analysis,. Statistical significance in a was assessed by wald test using Benjamini and Hochberg method, in b, d, f was assessed by hypergeometric test with Benjamini and Hochberg method. Source data are provided as a Source Data file.
Fig. 5
Fig. 5. Astrocytic A1AR deficiency reduces global neuroinflammation induced by an LPS challenge.
a Expression of 111 cytokines in the cortex of ctl and Adora1 cKO mice was measured by a proteomic profiling assay at 6 h after PBS or LPS i.p. injection (samples from 3 mice were pooled for each group). b Cytokines with significant changes compared to ctl (PBS) group were shown in the heatmap. Color bar range is between 0.5 and 9.5, out range value was labelled with dark blue. c Expression of 40 cytokines in the striatum of ctl and Adora1 cKO mice was measured by a proteomic profiling assay at 6 h after PBS or LPS i.p. injection (samples from 3 mice were pooled for each group). d Cytokines with significant changes compared to ctl (PBS) group were shown in the heatmap. Color bar range is between 1 and 16.1. Source data are provided as a Source Data file.
Fig. 6
Fig. 6. Astrocytic A1AR deficiency inhibits microglial reaction upon LPS challenge.
a Representative images of p65 immunoreactivity in Iba1+ microglia post LPS injection. Arrowheads indicated Iba1+ microglia with nuclear P65. Scale bar = 20 μm. bd Proportions of nuclear p65+ microglia in the cortex, hippocampus, and striatum of Adora1 cKO mice were reduced post LPS injection compared to ctl mice. (n = 4 mice in ctl and Adora1 cKO at 0 hpi, n = 6 mice in ctl and Adora1 cKO at 2 hpi, 6 hpi, and 24 hpi). e Representative images and 3D reconstructions of CD68+ and Iba1+ volume post the LPS injection by IMARIS. Scale bar = 10 μm. f Percentage of CD68+ volume in microglia in the cortex of Adora1 cKO mice were reduced post LPS injection compared to ctl mice (n = 6 in ctl and Adora1 cKO at 0 hpi, 6 hpi, and 24 hpi). g Morphology and 3D reconstruction of Iba1+ microglia post the LPS injection. Scale bar = 10 μm. h Sholl analysis of Iba1+ microglia at 0 hpi, 6 hpi, 24 hpi (n = 3 mice per group). i Total process length, area, and segments number of Iba1+ microglia in Adora1 cKO and ctl mice post LPS injection obtained from the IMARIS-based morphological analysis (n = 3 mice per group). j Relative expression of P2ry12 was elevated in the cortex of Adora1 cKO mice at 24 hpi (n = 3 mice per group). Summary data are presented as the mean ± SEM. Statistical significance in b, f, h, i, j were assessed using a two-way ANOVA, Fisher’s LSD test. Statistical significance in c, d is assessed using two tailed unpaired Student’s t test; ns: p > 0.05. Source data are provided as a Source Data file.
Fig. 7
Fig. 7. Astrocytic A1AR deficiency prevents neuronal dysfunction and ameliorates depression-like behaviour of the mice after LPS treatment.
a Representative images of c-Fos immunoreactivity in cortical NeuN+ neurons after LPS injection. Scale bar = 20 μm. bd c-Fos immunofluorescence intensities (arb. units) in NeuN+ neurons in the cortex, hippocampus, and striatum of Adora1 cKO mice were reduced compared to ctl mice at 6 and 24 hpi (n = 6 mice in ctl and Adora1 cKO at 0 hpi, n = 6 mice in ctl and Adora1 cKO at 6 hpi, 24 hpi). e Graphical description of LTP measurement protocol. f Scatter plots showing LTP induced by stimulation of Schaffer collateral (SC) — cornu ammonis (CA) 1 synapses with TBS in acute hippocampal slices from ctl and Adora1 cKO at 0 hpi, 6 hpi, 24 hpi. Averaged fEPSP are plotted versus time (n = 11 slices in ctl at 0 hpi, n = 12 slices in Adora1 cKO at 0 hpi, n = 9 slices in ctl at 6 hpi, n = 10 slices in Adora1 cKO at 6 hpi, n = 11 slices in ctl at 24 hpi, n = 12 slices in Adora1 cKO at 24 hpi). g LTP evoked in hippocampi of Adora1 cKO and ctl mice. (n = 11 slices in ctl at 0 hpi, n = 12 slices in Adora1 cKO at 0 hpi, n = 9 slices in ctl at 6 hpi, n = 10 slices in Adora1 cKO at 6 hpi, n = 11 slices in ctl at 24 hpi, n = 12 slices in Adora1 cKO at 24 hpi). h Schematic illustration of open-field test and sucrose preference test post PBS/LPS injection. i Representative trajectory analysis of ctl and Adora1 cKO mice in 10 min in the open-field test at 24 hpi. j Adora1 cKO mice displayed protected locomotion compared to ctl mice at 24 hpi (n = 11 mice in each group). k Adora1 cKO mice displayed less LPS-induced decreased in sucrose preference than ctl after LPS injection (n = 11 mice in ctl group, n = 20 mice in Adora1 cKO group). Summary data are presented as the mean ± SEM in bd, j, k and median ± IQR in g. Statistical significance in b, g, j, k were assessed using a two-way ANOVA, Fisher’s LSD test; statistical significance in c, d was assessed using a two tailed unpaired Student’s t test. ns: p > 0.05,. Source data are provided as a Source Data file. Panel h was created with BioRender.com released under a Creative Commons Attribution-NonCommercial-NoDerivs 4.0 International license.
Fig. 8
Fig. 8. Activation of Gi signaling in A1AR deficit astrocytes restores the inflammatory response to peripheral LPS challenge.
a Schematic illustration of activation of Gi signaling in A1AR deficit astrocytes experiment employing DREADD hM4Di and experimental plan. b Representative image of hM4Di expression indicated by mCherry in the Sox9+ astrocytes. Scale bar = 50 μm. c hM4Di was expressed in 94% of striatal astrocytes, with >84% specificity (n = 3 mice). d Representative images of immunolabeled reactive A1AR-deficient astrocytes by c-Fos immunostaining after LPS and CNO injection. Scale bar = 50 μm. e Activation of hM4Di increased c-Fos expression in hM4Di-mCherry+ A1AR-deficient astrocytes after LPS injection (n = 4 mice per group). f Representative images of immunoreactivity of p65 in Iba1+ microglia in Adora1 cKO mice with astrocytic tdT or hM4Di expression after LPS and CNO injection. Scale bars = 50 μm. Arrowheads indicates Iba1+ microglia with nuclear p65 expression. g Nuclear p65+ microglia was increased in hM4Di-expressing Adora1 cKO mice after LPS and CNO injection compared to ctl mice (n = 4 mice per group). h The expression of 40 cytokines in the striatum of AAV-infected ctl and Adora1 cKO mice was measured by a proteomic profiling assay after LPS and CNO injection. i Enhancing Gi signaling in Adora1 cKO mice increased cytokine expression after LPS and CNO injection (samples from 3 mice were pooled for each group). j Representative trajectory analysis digitally tracked movement of ctl and Adora1 cKO mice injected with LPS and CNO in the open-field test at 24 hpi. k, l Enhancing Gi signaling in A1AR-deficit astrocyte reduced locomotion in the open-field test (n = 12 mice in ctl-tdT+CNO group, n = 11 mice in Adora1 cKO-tdT+CNO group, n = 9 mice in ctl-hM4Di+CNO group, n = 13 mice in Adora1 cKO-hM4Di+CNO group). Summary data are presented as the mean ± SEM. Statistical significance in e, g was assessed using two tailed unpaired Student’s t test; statistical significance in k, l was assessed using a two-way ANOVA, Fisher’s LSD test, ns: p > 0.05. Source data are provided as a Source Data file. Panel a was created with BioRender.com released under a Creative Commons Attribution-NonCommercial-NoDerivs 4.0 International license.

References

    1. van der Poll, T., van de Veerdonk, F. L., Scicluna, B. P. & Netea, M. G. The immunopathology of sepsis and potential therapeutic targets. Nat. Rev. Immunol.17, 407–420 (2017). - PubMed
    1. Mazeraud, A. et al. Septic-associated encephalopathy: a comprehensive review. Neurotherapeutics17, 392–403 (2020). - PMC - PubMed
    1. Dantzer, R., O’Connor, J. C., Freund, G. G., Johnson, R. W. & Kelley, K. W. From inflammation to sickness and depression: when the immune system subjugates the brain. Nat. Rev. Neurosci.9, 46–56 (2008). - PMC - PubMed
    1. Manabe, T. & Heneka, M. T. Cerebral dysfunctions caused by sepsis during ageing. Nat. Rev. Immunol.22, 444–458 (2022). - PMC - PubMed
    1. Duan, L. et al. PDGFRβ cells rapidly relay inflammatory signal from the circulatory system to neurons via chemokine CCL2. Neuron100, 183–200.e188 (2018). - PubMed

MeSH terms