. 2024 Jul 27;13(1):29.
doi: 10.1038/s41389-024-00529-y.

Combined Inhibition of PI3K and STAT3 signaling effectively inhibits bladder cancer growth

Affiliations

Combined Inhibition of PI3K and STAT3 signaling effectively inhibits bladder cancer growth

Weidong Peng et al. Oncogenesis. .

Abstract

Bladder cancer is characterized by aberrant activation of the phosphatidylinositol-3-OH kinase (PI3K) signaling, underscoring the significance of directing therapeutic efforts toward the PI3K pathway as a promising strategy. In this study, we discovered that PI3K serves as a potent therapeutic target for bladder cancer through a high-throughput screening of inhibitory molecules. The PI3K inhibitor demonstrated a robust anti-tumor efficacy, validated both in vitro and in vivo settings. Nevertheless, the feedback activation of JAK1-STAT3 signaling reinstated cell and organoid survival, leading to resistance against the PI3K inhibitor. Mechanistically, the PI3K inhibitor suppresses PTPN11 expression, a negative regulator of the JAK-STAT pathway, thereby activating STAT3. Conversely, restoration of PTPN11 enhances the sensitivity of cancer cells to the PI3K inhibitor. Simultaneous inhibition of both PI3K and STAT3 with small-molecule inhibitors resulted in sustained tumor regression in patient-derived bladder cancer xenografts. These findings advocate for a combinational therapeutic approach targeting both PI3K and STAT3 pathways to achieve enduring cancer eradication in vitro and in vivo, underscoring their promising therapeutic efficacy for treating bladder cancer.


Conflict of interest statement

The authors declare that they have no known competing financial interests or personal relationships that could have appeared to influence the work reported in this paper.

Figures

Fig. 1
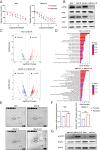
Fig. 1. PI3K signaling is activated in BCa.
A Top 30 compounds that induced growth inhibition of 5637 cell. Blue, PIK3/AKT/mTOR inhibitors; Gray, PKC inhibitors; Orange, NF-KB inhibitors; Pink, WNT inhibitors. B Heatmap showed growth inhibition of six bladder cancer cells (5637, J82, UM-UC-3, T24, SW780 and TCCSUP) and one normal urothelial cell line (SV-HUC-1) by indicated pathway inhibitors. C Western blot analysis of phosphorylated and total protein levels of PI3K and AKT in six bladder cancer cells and one normal urothelial cell line. β-actin served as loading controls. D Representative images of phosphorylated PI3K IHC staining in clinical BCa samples (n = 63); PT, para-tumor tissues. Scale bars: (20 μm). E IHC score of phosphorylated PI3K in tumor and matched para-tumor tissues. F Phosphorylated PI3K expression was analyzed based on the clinical stage. G Phosphorylated PI3K expression was analyzed based on the tumor invasion. H GSEA pathway analysis showed PI3K-ATK-mTOR pathway was significantly enriched in the GEO BCa database with tumor tissue, relative to para-tumor tissues. I GSEA pathway analysis exhibited differential gene pathway enrichment in the TCGA BCa datasets with tumor tissue, compared to para-tumor tissues. J Kaplan-Meier analysis of overall survival and recurrence free survival in BCa patients from TCGA based on the expression of PIK3CA mRNA. Red, high PIK3CA mRNA; Black, low PIK3CA mRNA (n = 405). Data are presented as mean ± SD of independent samples with individual data points shown; P values were assessed by two-tailed Student t test in comparison with para-tumor tissues group (EG).
Fig. 2
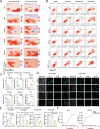
Fig. 2. In vitro effect of PI3K inhibitor in BCa models.
A IC50 assay evaluated the sensitivity of six BCa cells to infigratinib or copanlisib with a range of doses. Each point on the dose–response curves represent three technical replicates. Representative images (B) and quantification (C) of apoptosis assay in six BCa cells treated with infigratinib or copanlisib. D IC50 assay assessed the sensitivity of four organoid models to infigratinib or copanlisib with a range of doses. Each point on the dose–response curves represent three technical replicates. E Representative images of Live/Dead staining assay in organoid models treated with infigratinib or copanlisib. F Bioluminescence images of mice with MB49-fLUC tumors that received DMSO or copanlisib (representative of n = 2 mice). G The luminescence intensity fold change of tumor-bearing mice during DMSO or copanlisib. The stars indicate the best response of each mouse (n = 2 mice). H Population doublings of 5637 and UM-UC-3 cells treated with DMSO or copanlisib. Data are presented as mean ± SD of independent samples with individual data points shown; P values were assessed by two-tailed Student t test in comparison with infigratinib treated group (C); *, P < 0.05; **, P < 0.01; ***, P < 0.001; ****, P < 0.0001.
Fig. 3
Fig. 3. Activation of JAK1-STAT3 has been identified as a key driver of copanlisib resistance.
A IC50 assay of copanlisib-resistant cell lines and parental cell lines with copanlisib treatment at indicated concentrations for 48 h. B Western blot analysis of phosphorylated PI3K and AKT, total PI3K and AKT protein levels in parental and resistant cancer cells. β-actin served as loading controls. C Volcano plot of differential expressed genes between parental and resistant cancer cells. x axis indicates the log2(Fold change), cutoff lines represent fold change > 2, and y axis shows −log10 (qvalues), cutoff line represents P value < 0.05, gray indicates genes with no significant differences. D KEGG pathways enrichment analysis of differentially expressed genes between the parental and resistant cells with a log2 fold change ≥ 1.5 and p adjust < 0.01. Representative images (E) and quantification (F) of phosphorylation signals of JAK1 in parental and copanlisib-resistant BCa cells. Cell lysates were analyzed using the Human Phospho-RTK Array Kit following the manufacturer’s instructions. Quantified phosphorylation signal was derived from two antibody spots of JAK1. G Western blot analysis of phosphorylated STAT3 and total STAT3 protein levels in parental and resistant cancer cells. β-actin served as loading controls. Data are presented as mean ± SD of independent samples with individual data points shown; P values were assessed by two-tailed Student t test in comparison with parental cells group (F); *, P < 0.05; **, P < 0.01; ***, P < 0.001; ****, P < 0.0001.
Fig. 4
Fig. 4. In vitro efficacy of combined PI3K and STAT3 inhibition.
A The synergistic score between copanlisib and napabucasin was determined using Loewe and HSA synergy analysis in six BCa cells. Representative images (B) and quantification (C) of apoptosis assay in six BCa cells treated with DMSO, copanlisib, napabucasin or combination respectively. D Representative images of Live/Dead staining assay in organoid models treated with DMSO, copanlisib, napabucasin or combination respectively. E Organoids were treated with DMSO, copanlisib, napabucasin or combination in a CellTiter-Glo 3D cell viability assay. F Population doublings of 5637 and UM-UC-3 cells treated with DMSO or copanlisib and napabucasin for 20 days. Data are presented as mean ± SD of independent samples with individual data points shown; P values were assessed by two-tailed Student t test in comparison with single-agent cells group (C, E); *, P < 0.05; **, P < 0.01; ***, P < 0.001; ****, P < 0.0001.
Fig. 5
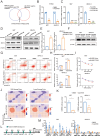
Fig. 5. Feedback activation of JAK1-STAT3 signaling via downregulation of PTPN11 expression.
A Venn diagram showed overlapping of the negative regulators of JAK-STAT pathway and down-regulated genes in resistant cells screened by RNA-seq. B The relative mRNA levels of PTPN11 in 5637 and UM-UC-3 cells with or without copanlisib treatment. C Knockdown of PTPN11 by two different siRNAs in 5637 and UM-UC-3 cells were verified by qPCR. D Western blot analysis of phosphorylated STAT3 and total STAT3 protein levels after transfection with indicated PTPN11 siRNAs in 5637 or UM-UC-3 cells. E Overexpression of PTPN11 by pEnCMV-PTPN11 plasmid in 5637 and UM-UC-3 cells were verified by qPCR. F Western blot analysis of phosphorylated STAT3 and total STAT3 protein levels after transfection with pEnCMV-PTPN11 plasmid in 5637 or UM-UC-3 cells. Representative images (G) and quantification (H) of apoptosis assay in the effect of PTPN11 overexpression in 5637 or UM-UC-3 cells on copanlisib sensitivity. I CCK8 assay explored the effect of PTPN11 overexpression in 5637 or UM-UC-3 cells on copanlisib sensitivity. J The synergistic score between copanlisib and napabucasin was determined using Loewe and HSA synergy analysis in cells overexpression of PTPN11. K Relative luciferase activity of C/EBPβ upon PI3K inhibition in 5637 or UM-UC-3 cells. Firefly luciferase activity was measured and normalized to Renilla luciferase activity. L Putative binding site of C/EBPβ in PTPN11 promoter region. M ChIP assay analyzed the recruitment of C/EBPβ at PTPN11 promoter in 5637 and UM-UC-3 cells treated with copanlisib. Data are presented as mean ± SD of independent samples with individual data points shown; P values were assessed by two-tailed Student t test (B, C, E, H, L, M) or equivalent ANCOVA (I) in comparison with the vehicle (DMSO) group (B, H, L) or the Scramble group (C, E, M); *, P < 0.05; **, P < 0.01; ***, P < 0.001; ****, P < 0.0001.
Fig. 6
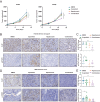
Fig. 6. Combination PI3K and STAT3 inhibitor treatment is effective against BCa models in vivo.
A Patient-derived xenograft tumors implanted into nude mice were randomized to DMSO, 10 mg/kg copanlisib, 4 mg/kg napabucasin, or the combination at the same doses in each cohort. Representative images (B) and quantification (C) of immunostaining for phosphorylated STAT3 and Ki-67 in Patient-derived xenograft was quantitatively measured three sections from every tumor tissue, Scale bar, 20 μm. Representative images (D) and quantification (E) of immunostaining for phosphorylated STAT3 and Ki-67 in BBN-induced tumor was quantitatively measured three sections from every tumor tissue, Scale bar, 20 μm. Data are presented as mean ± SD of independent samples with individual data points shown; P values were assessed by two-tailed Student t test in comparison with vehicle (DMSO) group (C, E, F); *, P < 0.05; **, P < 0.01; ***, P < 0.001; ****, P < 0.0001.

References

    1. Lenis AT, Lec PM, Chamie K, Mshs MD. Bladder cancer: a review. JAMA. 2020;324:1980–91. 10.1001/jama.2020.17598 - DOI - PubMed
    1. Sung H, Ferlay J, Siegel RL, Laversanne M, Soerjomataram I, Jemal A, et al. Global cancer statistics 2020: GLOBOCAN estimates of incidence and mortality worldwide for 36 cancers in 185 countries. CA-Cancer J Clin. 2021;71:209–49. 10.3322/caac.21660 - DOI - PubMed
    1. Chung R, Moran GW, Movassaghi M, Pohl D, Ingram J, Lenis AT, et al. Survival outcomes in patients with muscle invasive bladder cancer undergoing radical vs. partial cystectomy. Urol Oncol. 2023;41:311–56.10.1016/j.urolonc.2023.04.017 - DOI - PubMed
    1. Comperat E, Amin MB, Cathomas R, Choudhury A, De Santis M, Kamat A, et al. Current best practice for bladder cancer: a narrative review of diagnostics and treatments. Lancet. 2022;400:1712–21. 10.1016/S0140-6736(22)01188-6 - DOI - PubMed
    1. Pacheco C, Baiao A, Ding T, Cui W, Sarmento B. Recent advances in long-acting drug delivery systems for anticancer drug. Adv Drug Deliver Rev. 2023;194:114724.10.1016/j.addr.2023.114724 - DOI - PubMed

LinkOut - more resources