. 2024 Jul 27;15(1):6345.
doi: 10.1038/s41467-024-50754-7.

Targeting myeloid-derived suppressor cells promotes antiparasitic T-cell immunity and enhances the efficacy of PD-1 blockade (15 words)

Affiliations

Targeting myeloid-derived suppressor cells promotes antiparasitic T-cell immunity and enhances the efficacy of PD-1 blockade (15 words)

Chuanshan Zhang et al. Nat Commun. .

Erratum in

Abstract

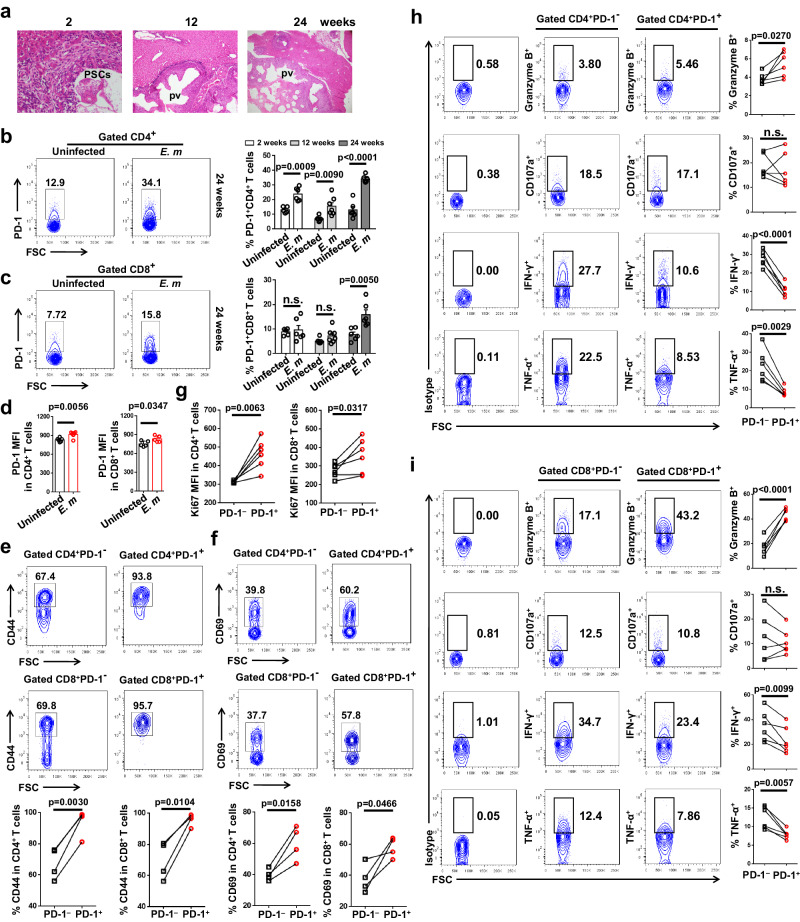
Immune exhaustion corresponds to a loss of effector function of T cells that associates with cancer or chronic infection. Here, our objective was to decipher the mechanisms involved in the immune suppression of myeloid-derived suppressor cells (MDSCs) and to explore the potential to target these cells for immunotherapy to enhance checkpoint blockade efficacy in a chronic parasite infection. We demonstrated that programmed cell-death-1 (PD-1) expression was significantly upregulated and associated with T-cell dysfunction in advanced alveolar echinococcosis (AE) patients and in Echinococcus multilocularis-infected mice. PD-1 blockade ex vivo failed to reverse AE patients' peripheral blood T-cell dysfunction. PD-1/PD-L1 blockade or PD-1 deficiency had no significant effects on metacestode in mouse model. This was due to the inhibitory capacities of immunosuppressive granulocytic MDSCs (G-MDSCs), especially in the liver surrounding the parasite pseudotumor. MDSCs suppressed T-cell function in vitro in an indoleamine 2, 3 dioxygenase 1 (IDO1)-dependent manner. Although depleting MDSCs alone restored T-cell effector functions and led to some limitation of disease progression in E. multilocularis-infected mice, combination with PD-1 blockade was better to induce antiparasitic efficacy. Our findings provide preclinical evidence in support of targeting MDSC or combining such an approach with checkpoint blockade in patients with advanced AE. (200 words).


Conflict of interest statement

The authors declare no competing interests.

Figures

Fig. 1
Fig. 1. Single-cell RNA sequencing analysis of PD-1 expression and distribution in T-cell subsets from the PB, DLT and CLT in AE patients.
a UMAP plot showing the clustering results for 5 major cell types in the high-quality single-cell RNA sequencing data from the PB, DLTs and CLTs of AE patients (n = 4). b Dot plot showing the highly expressed marker genes in each major cell type. The dot size represents the percentage of cells expressing the marker genes in each major cell type, and the dot colour represents the average expression level of the marker genes in each cell type. Blue indicates high expression, while grey indicates low expression. c Stacked histogram showing the percentages of immune cell types among the total immune cells from the PB, DLT and CLT groups. d UMAP plots showing the cellular compositions of PB, DLT and CLT. e Violin plot showing the expression level of PD-1 in the 7 major cell types in the PB, DLT and CLT samples. f UMAP plot showing the distribution of CD4+ T-cell subsets. Each colour represents a CD4+ T-cell subset. The clusters expressing PD-1 are circled. g UMAP plot showing the expression level of PD-1 in 13 subsets of CD4+ T cells. h UMAP plot showing the distribution of CD8+ T-cell subsets. The clusters expressing PD-1 are circled. i UMAP plot showing the expression level of PD-1 in 12 subsets of CD8+ T cells. PB, peripheral blood; DLT, ‘distant’ liver tissue; CLT, ‘close’ liver tissue. Source data are provided as a Source Data file.
Fig. 2
Fig. 2. PD-1 expression and dysfunction of liver T cells in AE patients.
a Representative flow cytometry plots, percentage, MFI (n = 30) and absolute number (n = 16) of liver CD4+ T cells expressing PD-1 in paired CLTs versus DLTs from AE patients. b Representative flow cytometry plots, percentage, MFI (n = 30) and absolute number (n = 15) of liver CD8+ T cells expressing PD-1 in paired CLTs versus DLTs from AE patients. c Representative images from immunofluorescence costaining of DAPI (blue), CD4 or CD8 (green), PD-1 (red), IgG control (green or red) and merged images of liver sections from AE patients (n = 10). Boxed areas show × 200 magnification of histological images. Arrows indicate CD4+PD-1+ T cells or CD8+PD-1+ T cells. The lesion is delimited with a white line. d, e Representative flow cytometry plot and percentage (n = 15) of granzyme B, IFN-γ and TNF-α production by liver CD4+ T cells or CD8+ T cells that do or do not express PD-1 after PMA/ionomycin stimulation in the CLT of AE patients. (a, b, d, e) Data were analysed using a two-tailed paired Student’s t tests. All data are presented as the mean ± SD. n.s., P > 0.05. Source data are provided as a Source Data file.
Fig. 3
Fig. 3. PD-1 expression and dysfunction of peripheral blood T cells in AE patients.
a Representative flow cytometry plots, percentage, MFI or absolute number of CD4+ T cells expressing PD-1 among the PBMCs of HDs (n = 33) and AE patients (n = 33 or n = 25). b Representative flow cytometry plots, percentage, MFI and absolute number of CD8+ T cells expressing PD-1 in PBMCs of HD (n = 34) and AE patients (n = 33 or n = 28). c, d Representative flow cytometry plot and percentage of granzyme B, IFN-γ and TNF-α production in CD4+ T cells or CD8+ T cells that do or do not express PD-1 in the PBMCs of AE patients (n = 25). a, b Data were analysed using a two-tailed unpaired Student’s t tests. c, d Data were analysed using two-tailed paired Student’s t tests. All data are presented as the mean ± SD. n.s., P > 0.05. Source data are provided as a Source Data file.
Fig. 4
Fig. 4. High PD-1 expression and dysfunction of liver T cells in a mouse model of E. multilocularis infection.
a Histopathological alterations in the livers of mice infected with PSC inocula during the course of infection. H&E staining of liver sections. The original magnification was at 40 ×; the scale bars indicate 500 μm. b Representative flow cytometry plots and percentages of CD4+ T cells expressing PD-1 [phycoerythrin-labelled (PE)] in the livers of uninfected (2 weeks, n = 5; 12 weeks, n = 6; 24 weeks, n = 6) or infected mice (2 weeks, n = 6; 12 weeks, n = 7; 24 weeks, n = 6) during the course of infection (6–7 mice). c Representative flow cytometry plots and percentages of CD8+ T cells expressing PD-1 in the livers of uninfected (2 weeks, n = 5; 12 weeks, n = 6; 24 weeks, n = 6) or infected mice (2 weeks, n = 6; 12 weeks, n = 7; 24 weeks, n = 6) during the course of infection. d MFI of CD4+ T cells or CD8+ T cells expressing PD-1 in the livers of uninfected (n = 6) or infected mice (n = 6) at week 24 post-infection. e, f, g Percentages of CD44+ (n = 4), CD69+ (n = 4) or Ki67+ cells (n = 6) among CD4+ T cells or CD8+ T cells that do or do not express PD-1 (Brilliant Violet 421TM) in the livers of mice at week 24 post-infection. h, i Representative flow cytometry plot and percentage of granzyme B, CD107α, IFN-γ and TNF-α production in CD4+ T cells or CD8+ T cells that do or do not express PD-1 in the livers of mice at week 24 post-infection (n = 6). PSCs: protoscoleces; pv: parasitic vesicle. b–d Data were analysed using two-tailed unpaired Student’s t tests. ei Data were analysed using a two-tailed paired Student’s t tests. All data are presented as the mean ± SD from each of at least two independent experiments. n.s., P > 0.05. Source data are provided as a Source Data file.
Fig. 5
Fig. 5. PD-1 deficiency does not influence disease progression or T-cell dysfunction in a mouse model of E. multilocularis infection.
a Workflow of the experimental procedure for the PD-1-/- mice and wild type (WT) mice infected with E. multilocularis PSCs. Mice image was drawn by hand with Procreate software. Analysis of liver lesion weight at weeks 2, 12 and 24 post-infection and flow cytometry of T cells in the liver and spleen at week 24 post-infection. b Representative image of metacestode tissue in the livers of wild-type (WT) or PD-1-/- mice at weeks 2, 12, and 24 post-infection. Metacestode tissues are circled in yellow. c Whole liver weight (left) and lesion weight (right) in the livers of WT or PD-1-/- mice at weeks 2 (WT, n = 10; PD-1-/-, n = 12), 12 (WT, n = 10; PD-1-/-, n = 11), and 24 (WT, n = 16; PD-1-/-, n = 10) of persistent infection. d Percentage of CD69+ cells among CD4+ T cells or CD8+ T cells in the livers of WT (n = 5) or PD-1-/- mice (n = 5) at week 24 post-infection. e Percentage of effector memory CD4+ T cells (CD44+CD62L-CD4+ Tem) or CD8+ T cells (CD44+CD62L-CD8+ Tem) in the livers of WT (n = 5) or PD-1-/- mice (n = 5) at week 24 post-infection. f Percentages of CD4+ T cells or CD8+ T cells positively stained for one, two or multiple cytokines (i.e., granzyme B, IFN-γ, TNF-α and IL-2) in the livers of WT (n = 5) or PD-1-/- mice (n = 5) at week 24 post-infection. c–f Data were analysed using two-tailed unpaired Student’s t tests. All data are presented as the mean ± SD from each of at least two independent experiments. n.s., P > 0.05. Source data are provided as a Source Data file.
Fig. 6
Fig. 6. MDSC accumulation in the livers of chronic AE patients, uninfected mice, E. multilocularis-infected wild type and PD-1-deficient mice.
a Flow cytometric gating strategy used to identify and integrate liver-infiltrating MDSCs, G-MDSCs and M-MDSCs from AE patients. b, c Percentage or absolute number of MDSCs, G-MDSCs and M-MDSCs in paired CLTs versus DLTs from AE patients (n = 11). d Representative flow cytometry plot of MDSCs, G-MDSCs and M-MDSCs in the livers of uninfected, wild-type (WT) or PD-1-/- mice at week 24 post-infection. e, f Percentage or absolute number of MDSCs, G-MDSCs and M-MDSCs in the livers of uninfected, WT or PD-1-/- mice at week 24 post-infection (n = 5). The data represent at least two independent experiments. b, c Data were analysed using two-tailed paired Student’s t tests. e, f Data were analysed using a one-way ANOVA with Tukey’s multiple comparisons test. All data are presented as the mean ± SD. n.s., P > 0.05. Source data are provided as a Source Data file.
Fig. 7
Fig. 7. PD-1 blockade in combination with MDSC depletion enhanced the function of T cells and delayed disease progression in mice after persistent E. multilocularis infection.
a Protocol for anti-PD-1 and/or anti-Gr-1 blockade in the late stage of infection. Mice image was drawn by hand with Procreate software. Twelve weeks after E. multilocularis infection, control IgG (2A3), anti-PD-1 mAb (RMP1-14), anti-Gr-1 mAb (RB6-8C5) or a combination of both antibodies were intraperitoneally administered twice a week for an additional 12 weeks. b Representative image of metacestode tissue in the liver of persistently infected mice treated with IgG, anti-PD-1 mAb, anti-Gr-1 mAb or a combination of anti-PD-1 mAb and anti-Gr-1 mAb for 12 weeks starting at week 12 post-infection. Metacestode tissues are circled in yellow. c Whole liver weight and lesion weight in the livers of persistently infected mice treated with non-related IgG (n = 6), anti-PD-1 mAb (n = 5), anti-Gr-1 mAb (n = 5) or a combination of anti-PD-1 mAb and anti-Gr-1 mAb (n = 5) for 12 weeks starting at week 12 post-infection. d Percentage of CD69+ cells among CD4+ T cells or CD8+ T cells in the livers of persistently infected mice treated with non-related IgG (n = 6), anti-PD-1 mAb (n = 5), anti-Gr-1 mAb (n = 5) or a combination of anti-PD-1 mAb and anti-Gr-1 mAb (n = 5). e Percentage of CD4+ Tems or CD8+ Tems in the livers of persistently infected mice treated with non-related IgG (n = 6), anti-PD-1 mAb (n = 5), anti-Gr-1 mAb (n = 5) or a combination of anti-PD-1 mAb and anti-Gr-1 mAb (n = 5). f Percentage of IFN-γ, TNF-α and IL-2 -expressing CD4+ T cells or CD8+ T cells in the livers of persistently infected mice treated with non-related IgG (n = 6), anti-PD-1 mAb (n = 5), anti-Gr-1 mAb (n = 5) or a combination of anti-PD-1 mAb and anti-Gr-1 mAb (n = 5). c–f Data were analysed using a one-way ANOVA with Tukey’s multiple comparisons test. All data are presented as the mean ± SD from each of at least two independent experiments. n.s., P > 0.05. Source data are provided as a Source Data file.
Fig. 8
Fig. 8. MDSC depletion enhanced the function of T cells and delayed disease progression in PD-1-deficient mice after persistent E. multilocularis infection.
a Protocol for anti-Gr-1 blockade in the late stage of infection. Mice image was drawn by hand with Procreate software. Twelve weeks after E. multilocularis infection of PD-1-/- mice, control IgG (LTF-2) or anti-Gr-1 mAb (RB6-8C5) was intraperitoneally administered two times a week for 12 weeks. b Representative image of metacestode tissue in the liver of persistently infected PD-1-/- mice treated with IgG or anti-Gr-1 mAb for 12 weeks starting at week 12 post-infection. c Whole liver weight (left) and lesion weight (right) in the livers of persistently infected PD-1-/- mice treated with IgG (n = 6) or anti-Gr-1 mAb (n = 6) for 12 weeks starting at week 12 post-infection. d Absolute numbers of CD4+ T cells and CD8+ T cells in the livers of persistently infected PD-1-/- mice treated with IgG (n = 5) or anti-Gr-1 mAb (n = 5). e Percentage of CD69+ cells among CD4+ T cells or CD8+ T cells in the livers of persistently infected PD-1-/- mice treated with IgG (n = 5) or anti-Gr-1 mAb (n = 5). f Percentage of CD4+ Tems or CD8+ Tems in the livers of persistently infected PD-1-/- mice treated with IgG (n = 5) or anti-Gr-1 mAb (n = 5). g Percentage of CD4+ T cells or CD8+ T cells positively stained for one, two or multiple cytokines (i.e., granzyme B, IFN-γ, TNF-α and IL-2) in the livers of persistently infected PD-1-/- mice treated with non-related IgG (n = 5) or anti-Gr-1 mAb (n = 5). c–g Data were analysed using two-tailed unpaired Student’s t tests. All data are presented as the mean ± SD from each of at least two independent experiments. n.s., P > 0.05. Source data are provided as a Source Data file.
Fig. 9
Fig. 9. Liver-infiltrating G-MDSCs upregulate IDO1, which inhibits T-cell function.
a Representative immunohistochemical staining for CD33, IDO1 or INOS (upper panel 100 ×, lower panel 400×) in liver sections from AE patients (left). Arrowheads indicate CD33+ cells, IDO1+ cells or INOS1+ cells. b, c, d The percentage of positively stained cells was calculated to assess the expression of CD33 (n = 13), IDO1 (n = 15) or INOS (n = 13). e Example of two patients. Patient No.26 with low metabolic activity (PET-CT, SUV = 1.9, left image a) and corresponding staining for CD33 or IDO1 in periphrastic liver tissue (right image, 400 ×). Patient No.63 with high metabolic activity (PET-CT, SUV = 9.4, left image a) and corresponding staining for CD33 or IDO1 in periphrastic liver tissue (right image, 400 ×). Left image (b): Corresponding CT scan; Left Image (c): Corresponding PET/CT fusion image; Left image (d): Corresponding region with radiopharmaceutical distribution in the hepatic lobe, as detected by maximum intensity projection (MIP). Arrows indicate 18F-FDG uptake (hot spots). f Correlations between the percentages of CD33+ cells, IDO1+ cells or INOS+ cells and the FDG-PET uptake value in the perilesional area (n = 14). g Representative images of the immunofluorescence staining for DAPI (blue), CD33 (green), and IDO1 (green) and merged images of liver sections from AE patients (n = 10). Boxed areas show × 200 magnification of histological images. Arrows indicate CD33+ IDO1+ MDSCs. A white line was drawn around the lesion. h Percentage of IDO1+ MDSCs in the livers of wild-type (WT) or PD-1-/- mice at week 24 post-infection (n = 3). i IFN-γ and TNF-α secretion in the supernatant of CD4+ T cells or CD8+ T cells cocultured with G-MDSCs for 48 h in the presence of the control or IDO1 inhibitor (1-MT) was measured by ELISA. The data represent at least two independent experiments. Standard uptake value, SUV. b–d Data were analysed using two-tailed paired Student’s t tests. f Data were analysed using a two-tailed Pearson’s correlation. h Data were analysed using a one-way ANOVA with Tukey’s multiple comparisons test. All data are presented as the mean ± SD. n.s., P > 0.05. Source data are provided as a Source Data file.

References

    1. Philip, M. & Schietinger, A. Heterogeneity and fate choice: T cell exhaustion in cancer and chronic infections. Curr. Opin. Immunol.58, 98–103 (2019). 10.1016/j.coi.2019.04.014 - DOI - PMC - PubMed
    1. Blank, C. U. et al. Defining ‘T cell exhaustion’. Nat. Rev. Immunol.19, 665–674 (2019). 10.1038/s41577-019-0221-9 - DOI - PMC - PubMed
    1. LaFleur, M. W., Muroyama, Y., Drake, C. G. & Sharpe, A. H. Inhibitors of the PD-1 pathway in tumor therapy. J. Immunol.200, 375–383 (2018). 10.4049/jimmunol.1701044 - DOI - PMC - PubMed
    1. Hopkins, A. M., Kichenadasse, G., McKinnon, R. A., Rowland, A. & Sorich, M. J. Baseline tumor size and survival outcomes in lung cancer patients treated with immune checkpoint inhibitors. Semin. Oncol.46, 380–384 (2019). 10.1053/j.seminoncol.2019.10.002 - DOI - PubMed
    1. Nishino, M., Giobbie-Hurder, A., Ramaiya, N. H. & Hodi, F. S. Response assessment in metastatic melanoma treated with ipilimumab and bevacizumab: CT tumor size and density as markers for response and outcome. J. Immunother. Cancer2, 40 (2014). 10.1186/s40425-014-0040-2 - DOI - PMC - PubMed

MeSH terms

Supplementary concepts