. 2024 Jul 27;15(7):533.
doi: 10.1038/s41419-024-06913-1.

DEPDC1 as a metabolic target regulates glycolysis in renal cell carcinoma through AKT/mTOR/HIF1α pathway

Affiliations

DEPDC1 as a metabolic target regulates glycolysis in renal cell carcinoma through AKT/mTOR/HIF1α pathway

Si-Chen Di et al. Cell Death Dis. .

Abstract

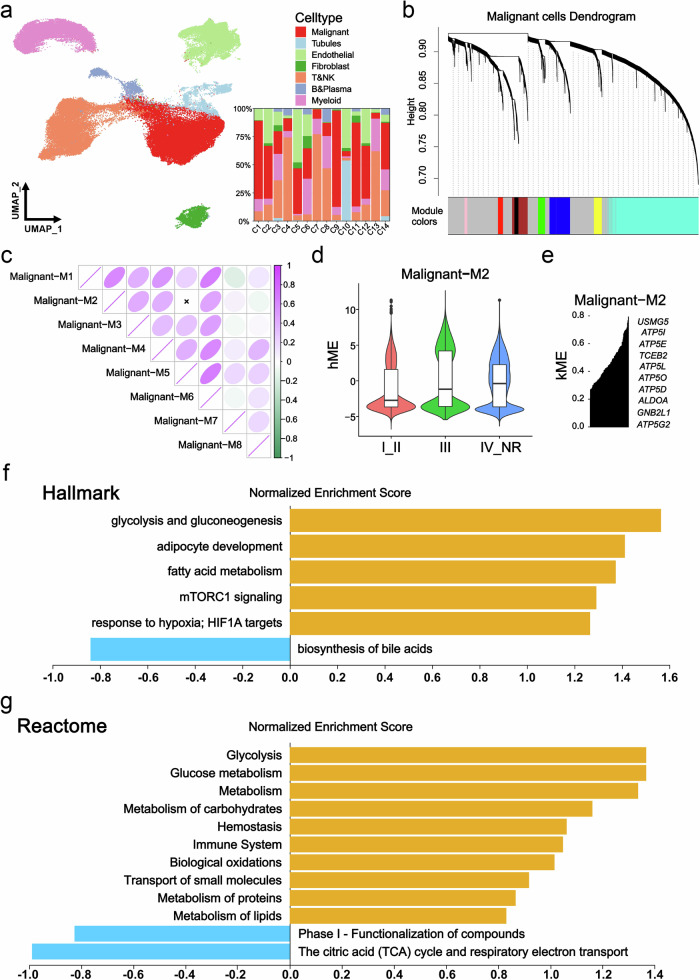
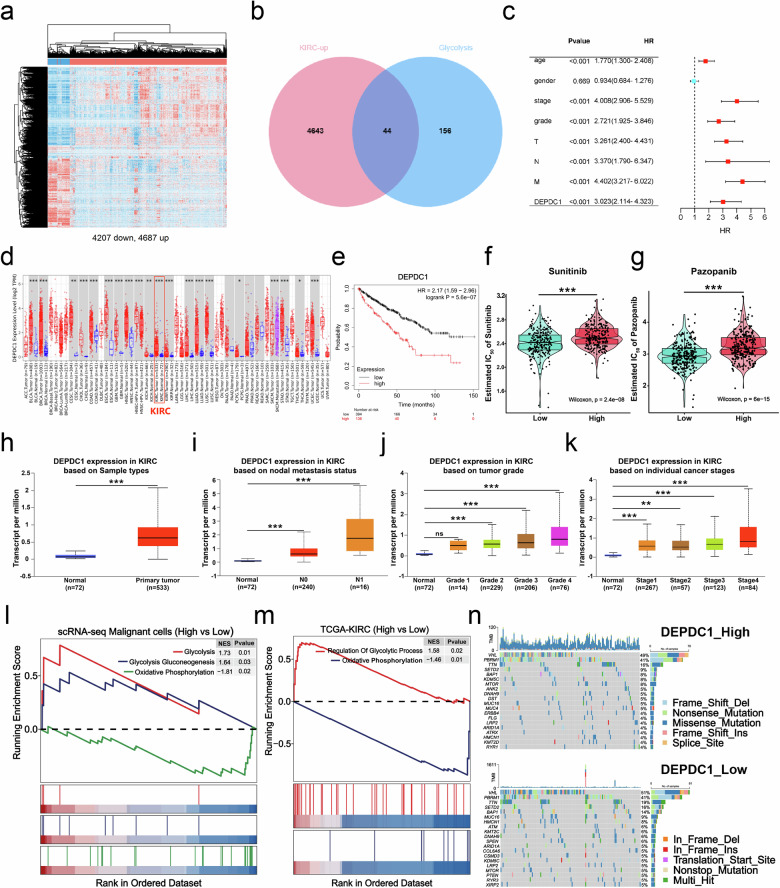
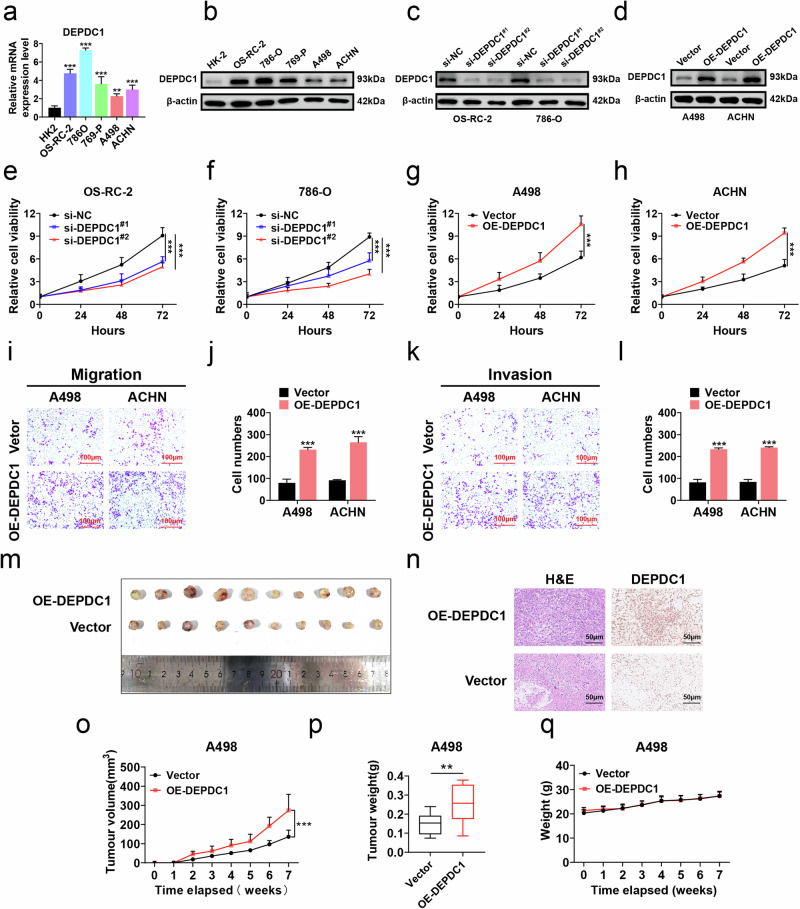
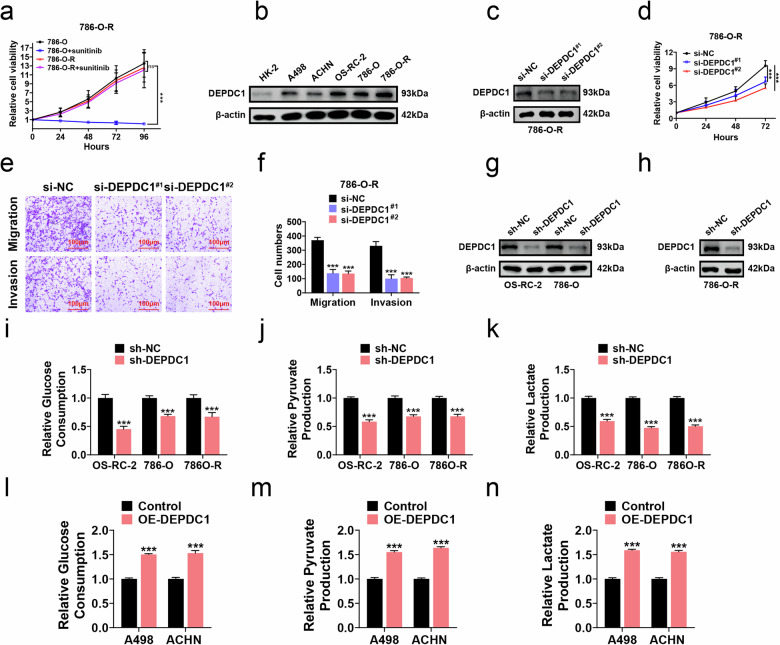
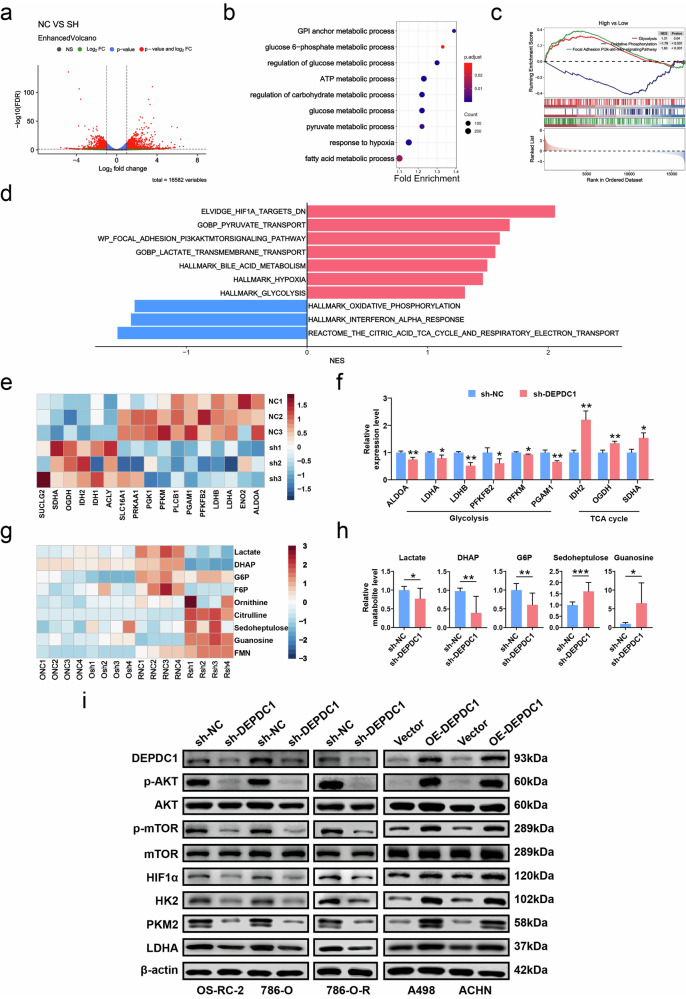
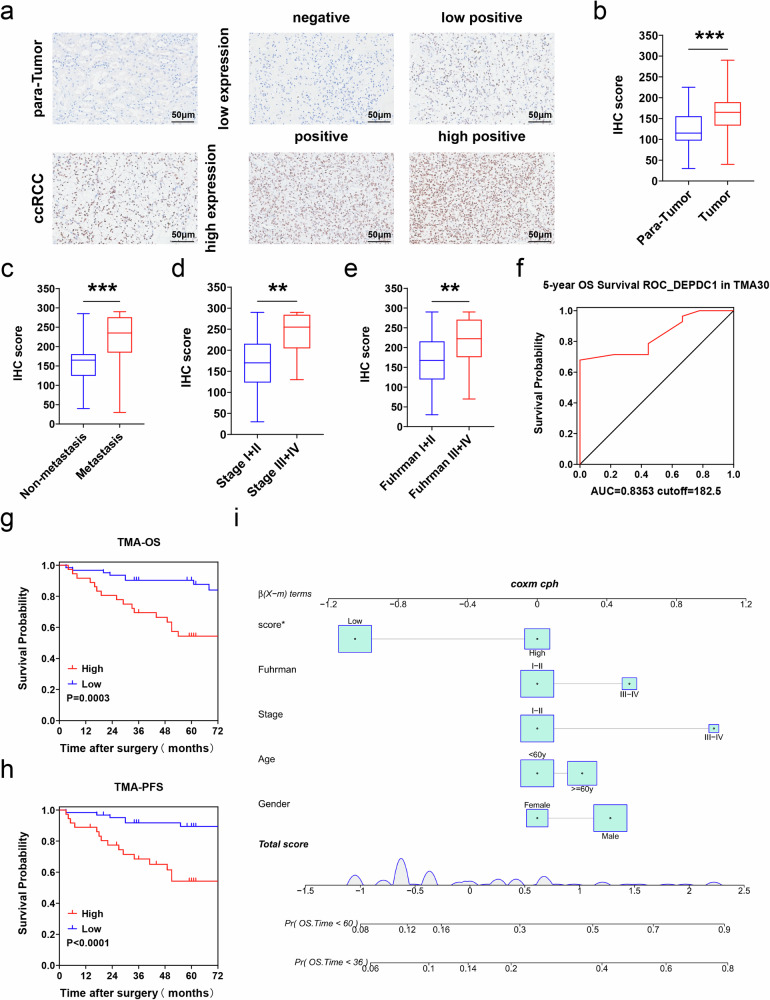
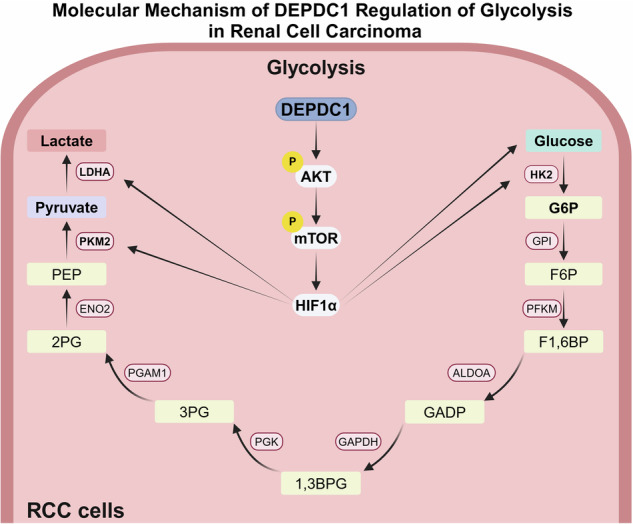
Renal cell carcinoma (RCC) is considered a "metabolic disease" characterized by elevated glycolysis in patients with advanced RCC. Tyrosine kinase inhibitor (TKI) therapy is currently an important treatment option for advanced RCC, but drug resistance may develop in some patients. Combining TKI with targeted metabolic therapy may provide a more effective approach for patients with advanced RCC. An analysis of 14 RCC patients (including three needle biopsy samples with TKI resistance) revealed by sing-cell RNA sequencing (scRNA-seq) that glycolysis played a crucial role in poor prognosis and drug resistance in RCC. TCGA-KIRC and glycolysis gene set analysis identified DEPDC1 as a target associated with malignant progression and drug resistance in KIRC. Subsequent experiments demonstrated that DEPDC1 promoted malignant progression and glycolysis of RCC, and knockdown DEPDC1 could reverse TKI resistance in RCC cell lines. Bulk RNA sequencing (RNA-seq) and non-targeted metabolomics sequencing suggested that DEPDC1 may regulate RCC glycolysis via AKT/mTOR/HIF1α pathway, a finding supported by protein-level analysis. Clinical tissue samples from 98 RCC patients demonstrated that DEPDC1 was associated with poor prognosis and predicted RCC metastasis. In conclusion, this multi-omics analysis suggests that DEPDC1 could serve as a novel target for TKI combined with targeted metabolic therapy in advanced RCC patients with TKI resistance.


Conflict of interest statement

The authors declare no competing interests.

Figures

Fig. 1
Fig. 1. scRNA-seq discovered a key module for poor prognosis and drug resistance in RCC.
a UMAP plot showing all cells and composition proportions of 14 patients, including malignant, tubules, endothelial, fibroblasts, T&NK, B&Plasma, and Myelold cells. b Dendrogram visualizing the hierarchical structure of the co-expression network, where each module color represents a distinct module. c Inter-module correlation analysis, showing the strength of correlation between each module and all other modules. d hME showing the module characteristic values of gene modules in different clinical stages. e kME showing the correlation between core genes and gene modules. f Hallmark enrichment analysis showing a positive correlation of M2 module genes with glycolysis, mTORC1 signaling and other related pathways. g Reactome enrichment analysis showing a positive correlation of M2 module genes with glycolysis, glucose metabolism and other related pathways, and a negative correlation with TCA cycle. *p < 0.05, **p < 0.01, ***p < 0.001.
Fig. 2
Fig. 2. Glycolysis-related gene DEPDC1 is associated with malignant progression and drug resistance in KIRC.
a Heat map demonstrating the results of the differential expression analyses using the TCGA-KIRC dataset, including 4687 upregulated DEGs and 4207 down-regulated DEGs. b Venn diagram illustrating the intersection of 4687 upregulated DEGs and 200 GRGs. c Univariate Cox regression analysis of DEPDC1 and clinical information. d Timer 2.0 database demonstrating the expression level of DEPDC1 in pan-cancer. e Analysis of the K–M survival curve of DEPDC1 high and low groups in TCGA-KIRC (n = 530). f, g The GDSC database provides IC50 predictions for sunitinib and pazopanib in Endo_p high and low risk score groups. h–k UALCAN database offering insights into the expression levels of DEPDC1 in tumors and normal tissues, different nodal metastasis statuses, different tumor grades, and different cancer stages. l, m The GSEA analysis of high DEPDC1 expression vs low DEPDC1 expression in malignant cells by scRNA-seq and TCGA-KIRC. n The oncoprint of conventional marker genes of RCC with alterations in DEPDC1 high and low groups, where tumor mutation burden is represented for individual samples as a bar chart above the oncoprint. *p < 0.05, **p < 0.01, ***p < 0.001. DEPDC1 DEP domain-containing protein 1, KIRC Kidney clear cell carcinoma, TCGA The Cancer Genome Atlas.
Fig. 3
Fig. 3. DEPDC1 promotes malignant progression of RCC.
a, b qRT-PCR and western blot revealing differential expression of DEPDC1 at the mRNA and protein levels in various RCC cell lines (OS-RC-2, 786-O, 769-P, A498, ACHN) compared to HK-2 control group. c Western blot showing the knockdown efficiency of DEPDC1 in OS-RC-2 and 786-O cells. d Western blot showing the overexpression efficiency of DEPDC1 in A498 cells and ACHN cells. e, f Cell proliferation assay indicating the increased growth rate and proliferative activity of OS-RC-2 and 786-O cells in DEPDC1 knockdown group (si-DEPDC1#1 and si-DEPDC1#2) compared with si-NC control group. g, h Cell proliferation assay showing changes in proliferation activity of A498 cells and ACHN cells in DEPDC1 overexpression group (OE-DEPDC1) compared with the Vector control group. il Transwell assay showing changes in the number of migration and invasion cells in A498 and ACHN cells in OE-DEPDC1 group compared with Vector control group, scale bar = 100 μm. m Representative images of xenografts collected from mice receiving Vector or OE-DEPDC1 A498 cells (n = 10). n IHC staining of DEPDC1 in xenograft tumor cell nuclei in Vector and OE-DEPDC1 groups. oq Tumor growth curve, weight comparison, and body weight changes of nude mice were collected from mice receiving Vector or OE-DEPDC1 A498 cells. *p < 0.05, **p < 0.01, ***p < 0.001.
Fig. 4
Fig. 4. DEPDC1 is correlated with drug resistance and enhances glycolysis in RCC.
a Cell proliferation assay detects the cell proliferation activity of 786-O cells and 786-O-R cells as well as 786-O cells and 786-O-R cells treated with sunitinib (10 μM). b Western blot detecting the protein expression levels of DEPDC1 in HK-2 and five types of RCC cells. c Western blot verifying the knockdown efficiency of DEPDC1 in 786-O-R cell. d Cell proliferation assay showing changes in the proliferation activity of 786-O-R cells in si-DEPDC1#1 and si-DEPDC1#2 groups vs si-NC group. e, f Transwell assay showing the number of migrating and invasive cells of 786-O-R cells in si-DEPDC1#1 group and si-DEPDC1#2 groups compared to si-NC group, scale bar = 100 μm. g, h Western blot verifying the knockdown efficiency of DEPDC1 in OS-RC-2 cells, 786-O cells and 786-O-R cells. ik Glycolysis function assay showing changes in glucose consumption, pyruvate production, and lactate production of OS-RC-2, 786-O and 786-O-R cells between sh-DEPDC1 and sh-NC groups. ln Glycolysis function assay showing changes in glucose consumption, pyruvate production, and lactate production of A498 and ACHN cells between OE-DEPDC1 and Vector groups. *p < 0.05, **p < 0.01, ***p < 0.001.
Fig. 5
Fig. 5. RNA-seq and non-targeted metabolomics reveal that DEPDC1 positively regulates glycolysis in RCC.
a Volcano plot showing all DEGs sequenced in the RNA-seq of 786-O cells (sh-NC and sh-DEPDC1 groups, n = 3). b GSEA bubble chart shows the biological processes involved in the DEGs of 786-O cells. c, d GSEA analysis showing that high expression of DEPDC1 was positively correlated with glycolysis and PI3K/AKT/mTOR and other pathways, and negatively correlated with TCA cycle and oxidative phosphorylation. e Heat map showing the expression changes of genes related to the regulation of glycolysis and TCA cycle after knockdown of DEPDC1 in 786-O cells. f Histogram showing significantly changed genes in 786-O cells after knocking down DEPDC1. g Heat map showing changes in glycolytic and TCA cycle metabolites in 786-O and 786-O-R cells after knocking down DEPDC1. h Histogram showing significantly changed glycolytic and TCA cycle metabolites in 786-O and 786-O-R cells after knocking down DEPDC1. i Western blot reveals changes in protein expression of AKT/mTOR/HIF1α pathway and key glycolysis enzymes in RCC cells after knocking down or overexpressing DEPDC1. *p < 0.05, **p < 0.01, ***p < 0.001.
Fig. 6
Fig. 6. DEPDC1 predicts poor prognosis and metastasis in RCC within our clinical cohort.
a Representative IHC staining and H-score of DEPDC1 in RCC tissue and paired para-cancerous tissue (TMA2021, n = 70), scale bar = 50 μm. b IHC scores of RCC tissue and paired para-cancerous tissue (TMA2021, n = 70). c IHC scores of tumor tissues from patients with and without metastasis. d IHC scores of patients with stage I, II and stage III, IV. e IHC scores for patients with Fuhrman grades I, II and III, IV. f ROC curve of DEPDC1 expression in TMA30 cohort with 5-year OS. g K–M survival curve shows OS of DEPDC1 high-expression group and low-expression group. h K-M survival curve shows PFS of the DEPDC1 high-expression and low-expression groups. i Multivariate nomogram analysis of 3 and 5-year OS. *p < 0.05, **p < 0.01, ***p < 0.001. TMA tissue microarray.
Fig. 7
Fig. 7
Molecular mechanism of DEPDC1 in RCC.

References

    1. Siegel RL, Giaquinto AN, Jemal A. Cancer statistics, 2024. CA Cancer J Clin. 2024;74:12–49. 10.3322/caac.21820 - DOI - PubMed
    1. Ljungberg B, Albiges L, Abu-Ghanem Y, Bedke J, Capitanio U, Dabestani S, et al. European Association of Urology Guidelines on Renal Cell Carcinoma: the 2022 update. Eur Urol. 2022;82:399–410. 10.1016/j.eururo.2022.03.006 - DOI - PubMed
    1. Padala SA, Barsouk A, Thandra KC, Saginala K, Mohammed A, Vakiti A, et al. Epidemiology of renal cell carcinoma. World J Oncol. 2020;11:79–87. 10.14740/wjon1279 - DOI - PMC - PubMed
    1. Escudier B, Porta C, Schmidinger M, Rioux-Leclercq N, Bex A, Khoo V, et al. Renal cell carcinoma: ESMO Clinical Practice Guidelines for diagnosis, treatment and follow-up. Ann Oncol. 2019;30:706–20. 10.1093/annonc/mdz056 - DOI - PubMed
    1. Zhan Y, Liu Y, Yang R, Chen Q, Teng F, Huang Y, et al. CircPTEN suppresses human clear cell renal carcinoma progression and resistance to mTOR inhibitors by targeting epigenetic modification. Drug Resist Updat. 2023;71:101003. 10.1016/j.drup.2023.101003 - DOI - PubMed

MeSH terms

Substances

LinkOut - more resources