. 2024 Jul 27;15(1):6343.
doi: 10.1038/s41467-024-50673-7.

Nucleolytic processing of abasic sites underlies PARP inhibitor hypersensitivity in ALC1-deficient BRCA mutant cancer cells

Affiliations

Nucleolytic processing of abasic sites underlies PARP inhibitor hypersensitivity in ALC1-deficient BRCA mutant cancer cells

Natasha Ramakrishnan et al. Nat Commun. .

Abstract

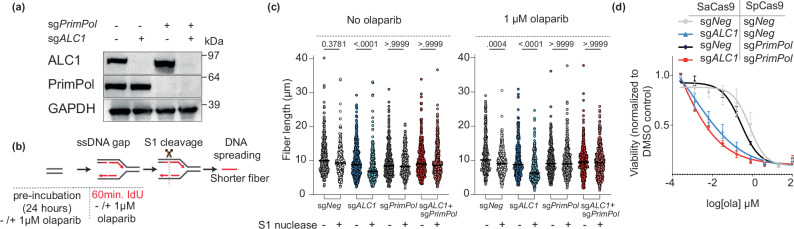
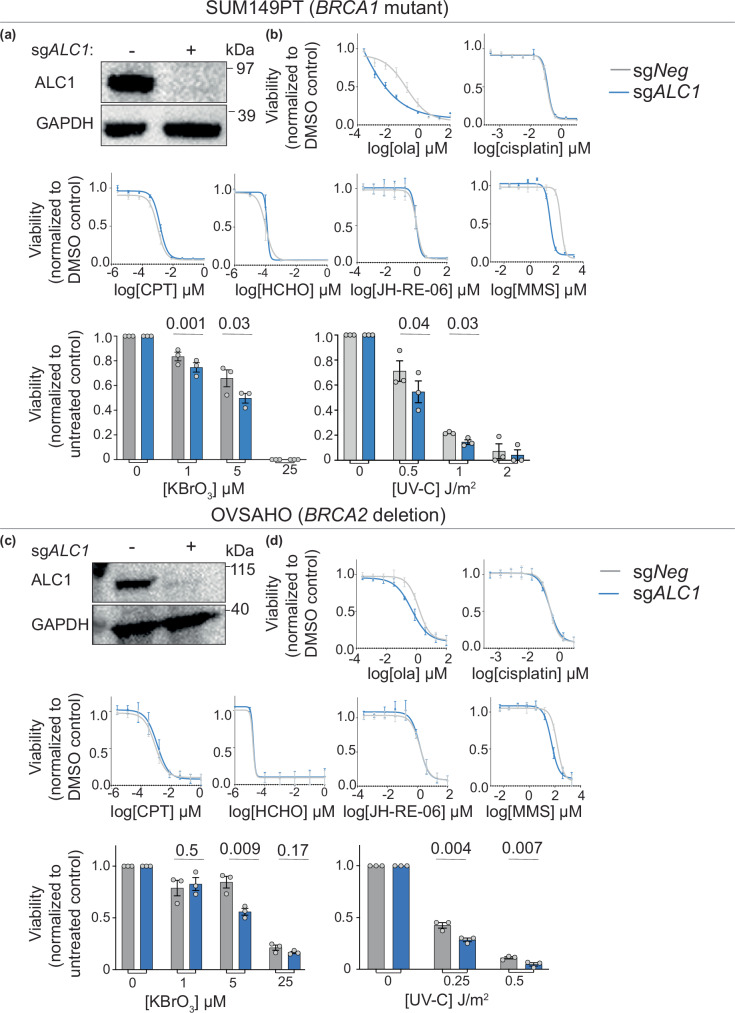
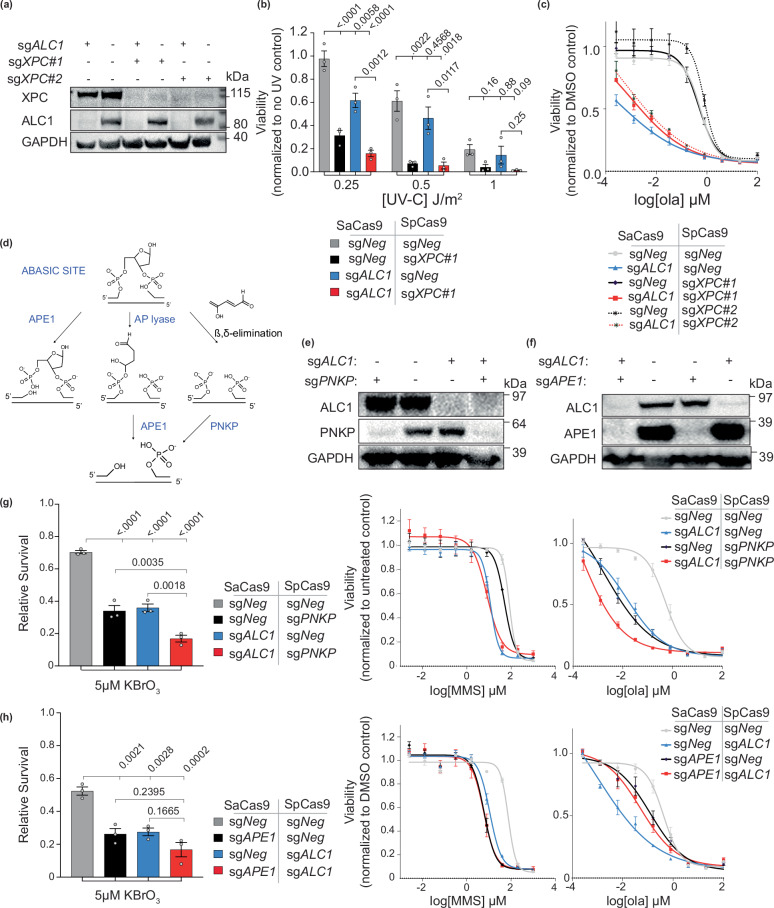
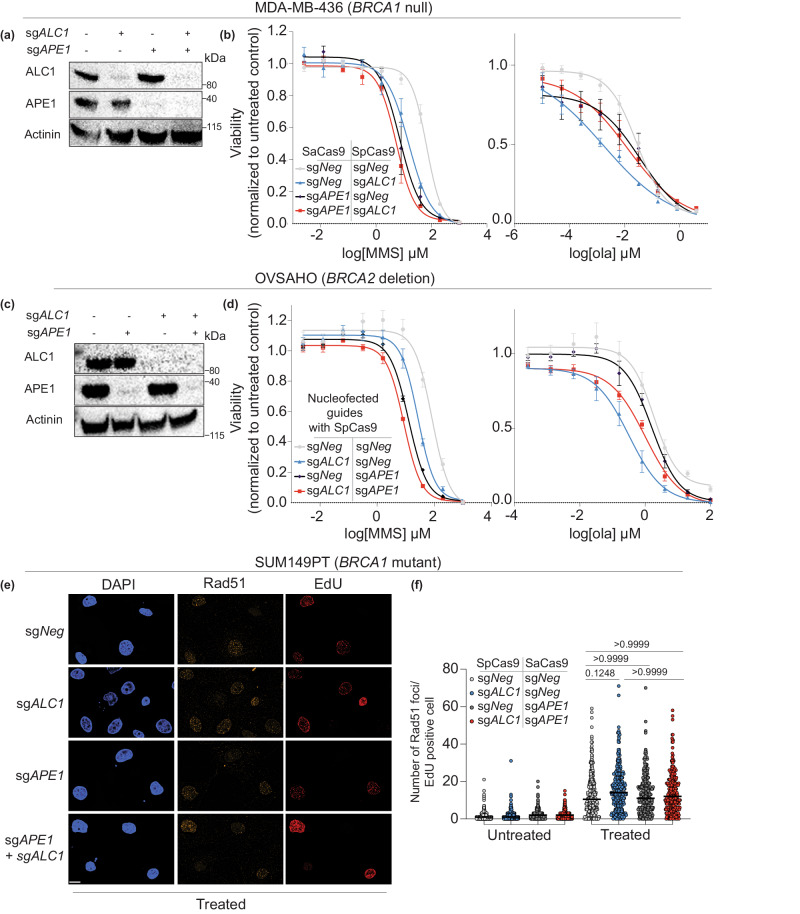
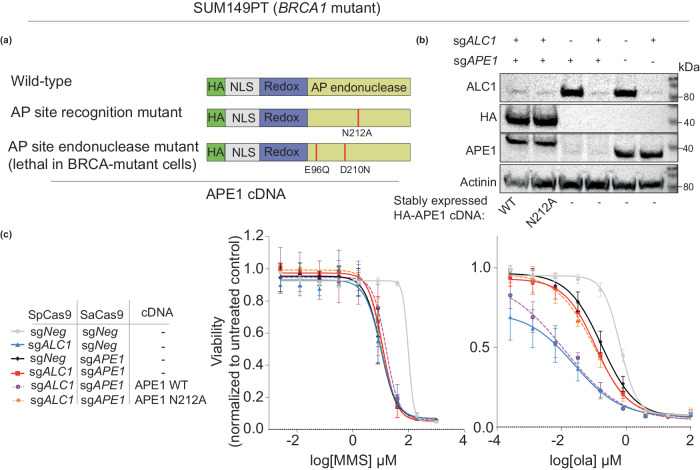
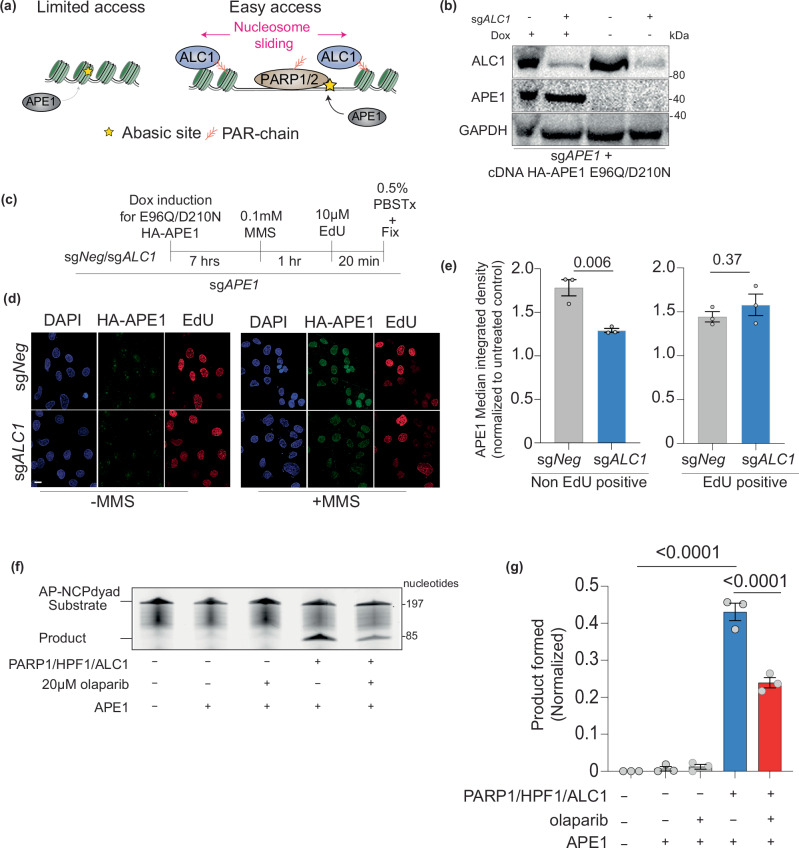
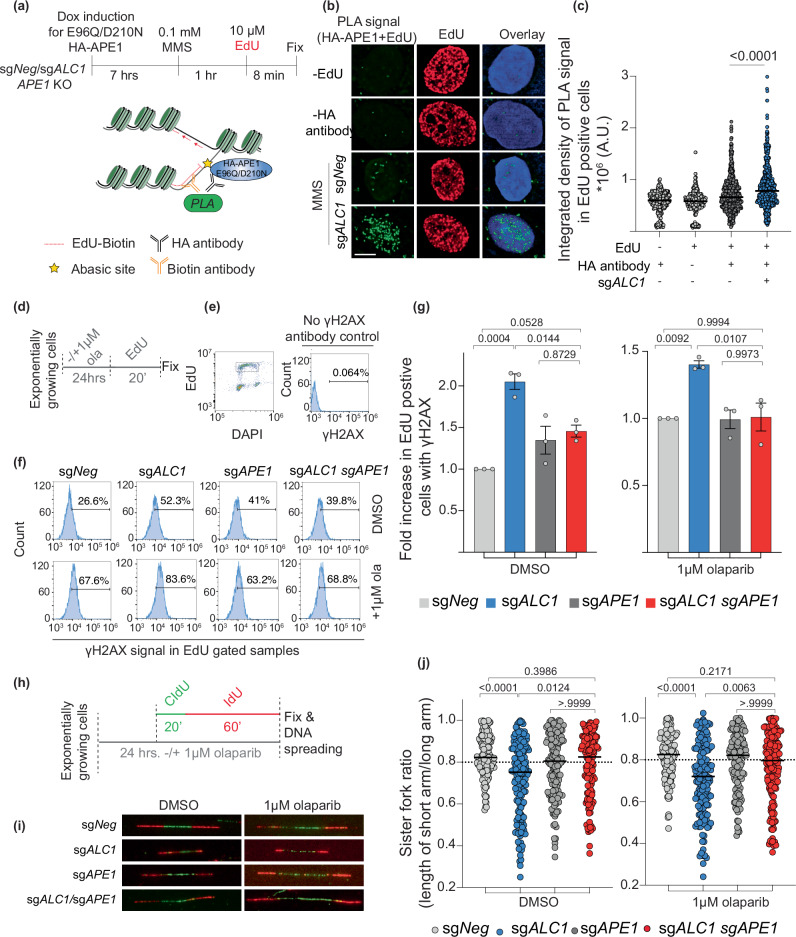
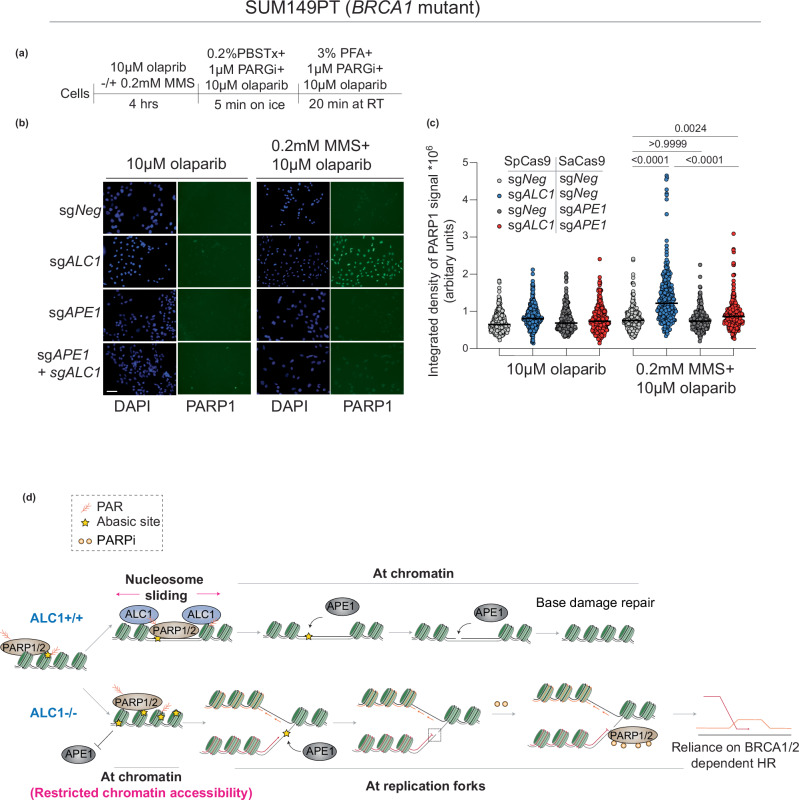
Clinical success with poly (ADP-ribose) polymerase inhibitors (PARPi) is impeded by inevitable resistance and associated cytotoxicity. Depletion of Amplified in Liver Cancer 1 (ALC1), a chromatin-remodeling enzyme, can overcome these limitations by hypersensitizing BReast CAncer genes 1/2 (BRCA1/2) mutant cells to PARPi. Here, we demonstrate that PARPi hypersensitivity upon ALC1 loss is reliant on its role in promoting the repair of chromatin buried abasic sites. We show that ALC1 enhances the ability of the abasic site processing enzyme, Apurinic/Apyrimidinic endonuclease 1 (APE1) to cleave nucleosome-occluded abasic sites. However, unrepaired abasic sites in ALC1-deficient cells are readily accessed by APE1 at the nucleosome-free replication forks. APE1 cleavage leads to fork breakage and trapping of PARP1/2 upon PARPi treatment, resulting in hypersensitivity. Collectively, our studies reveal how cells overcome the chromatin barrier to repair abasic lesions and uncover cleavage of abasic sites as a mechanism to overcome limitations of PARPi.


Conflict of interest statement

The authors declare no competing interests.

Figures

Fig. 1
Fig. 1. Role of PrimPol in replication gaps and olaparib sensitivity in ALC1-deficient BRCA1 mutant SUM149PT cells.
a Immunoblot showing depletion of ALC1 and PrimPol. Representative of three blots. b Schematic of S1-nuclease fiber assay. IdU: 5-iodo-2’-deoxyuridine. c Analysis of IdU tract length in the indicated cell lines in the absence (left) and presence (right) of olaparib. Median values are indicated. P values derived by Kruskal–Wallis test from >300 fibers/sample collected over three biologically independent experiments. d Sensitivities of the indicated cell lines to olaparib. Data are mean ± s.e.m from three biologically independent experiments. Source data are provided as a Source data file.
Fig. 2
Fig. 2. Genotoxic sensitivity of ALC1-deficient cells.
a Immunoblot showing depletion of ALC1 in BRCA1 mutant SUM149PT cells. Representative of three blots. b Sensitivities of the indicated SUM149PT cell lines to various genotoxins. Data are presented as mean ± s.e.m from three biologically independent experiments. P values derived by unpaired two-tailed t-test. c Immunoblot showing depletion of ALC1 in BRCA2 deleted OVSAHO cells. Representative of three blots. d Sensitivities of the indicated OVSAHO cell lines to various genotoxins. Data are presented as mean ± s.e.m from three biologically independent experiments. P values derived by unpaired two-tailed t-test. Source data are provided as a Source data file.
Fig. 3
Fig. 3. Epistasis between ALC1 and GG-NER/BER factors in response to DNA damaging agents in BRCA1 mutant SUM149PT cells.
a Immunoblot showing depletion of ALC1 and XPC. Representative of three blots. b Sensitivities of the indicated cell lines to UV-C. Data presented as mean ± s.e.m from three biologically independent experiments. P values derived by ordinary one-way ANOVA. c Sensitivities of the indicated cell lines to olaparib. Data presented as mean ± s.e.m from three biologically independent experiments. Representative of three blots. d Schematic showing how the abasic site can be processed by either APE1 or PNKP. e Immunoblot showing depletion of ALC1 and PNKP. Representative of three blots. f Immunoblot showing depletion of ALC1 and APE1. Representative of three blots. g, h Sensitivities of the indicated cell lines to KBrO3 (left), MMS (middle), and olaparib (right). Data are presented as mean ± s.e.m from three biologically independent experiments. P value derived by ordinary one-way ANOVA. Source data are provided as a Source data file.
Fig. 4
Fig. 4. Epistasis analysis between ALC1 and APE1 for response to DNA damaging agents.
a Immunoblot showing depletion of ALC1 and APE1 in MDA-MB-436 cells. Representative of three blots. b Sensitivities of the indicated MDA-MB-436 cells to MMS (left) and olaparib (right). Data are presented as mean ± s.e.m from three biologically independent experiments. c Immunoblot showing depletion of ALC1 and APE1 in OVSAHO cells. Representative of three blots. d Sensitivities of the indicated OVSAHO cell lines to MMS (left) and olaparib (right). Data are presented as mean ± s.e.m from three biologically independent experiments. e Representative immunofluorescence image of Rad51 foci in indicated SUM149PT cells. Scale bar 10 microns. Representative from three biologically independent experiments. Source data are provided as a Source data file. f Quantification of the chromatin-bound for Rad51 foci/EdU-positive cells. Each dot represents a single cell. Median is indicated. P value determined by Kruskal–Wallis test derived from 300 cells sampled over three biologically independent experiments. Source data are provided as a Source data file.
Fig. 5
Fig. 5. Processing of abasic sites by APE1 confers PARPi hypersensitivity in BRCA mutant cancer cells.
a Schematics for APE1 constructs. b Immunoblot showing expression levels of exogenous APE1 constructs and depletion of endogenous APE1 and ALC1. Representative of three blots. c Sensitivities of the indicated SUM149PT cell lines to MMS (left) and olaparib (right). Data are presented as mean ± s.e.m from three biologically independent experiments. Source data are provided as a Source data file.
Fig. 6
Fig. 6. ALC1 promotes the repair of abasic sites by APE1 at the chromatin.
a Schematic showing the hypothesis that ALC1 can enhance APE1 accessibility to nucleosome-buried abasic sites. b Immunoblot showing expression levels of Dox-inducible APE1 constructs and levels of ALC1 depletion. Representative of three blots. c Schematic for quantifying MMS-induced APE1 localization to chromatin using E96Q/D210N mutant. 0.5% PBS Tx: PBS + 0.5% Triton X-100. d Representative image of chromatin-bound HA-APE1 E96Q/D210N. Scale: 10 microns. e Quantification of MMS-induced chromatin bound HA-APE1 E96Q/D210N normalized to untreated control. Data are presented as mean ± s.e.m from three biologically independent experiments. P values derived by unpaired student’s t-test. f Representative gel for APE1 cleavage assay with AP-NCP dyad substrate and product bands detected using the 6-FAM label. Representative of three gels. g Quantification of the AP-NCP-6 product formation assays for the indicated reactions. The data shown are the mean ± s.e.m from the three independent experiments. P value derived by one-way ANOVA. Source data are provided as a Source data file.
Fig. 7
Fig. 7. Localization of APE1 at forks in ALC1-deficient cells results in replication-coupled DSBs and fork stalling.
a Schematic of the PLA experiment to quantify APE1 localization to the replication fork. b Representative image of E96Q/D210N HA-APE1/EdU PLA signal. Scale is 5 microns. c Quantification of E96Q/D210N HA-APE1/EdU PLA signal. Median values are indicated. P values derived by Kruskal–Wallis test from >450 cells/condition collected over three biologically independent experiments. AU arbitrary units. d Schematic of the experiment to quantify replication-coupled DSBs. e Gating scheme to examine γH2Ax signal in EdU-positive cells. f Representative histograms showing γH2AX levels in indicated cell lines. g Normalized levels of EdU-positive cells with γH2AX in the absence (left) and presence of olaparib (right). Data are presented as mean ± s.e.m from three biologically independent experiments. P values derived by ordinary one-way ANOVA. h Schematic of the experiment to label nascent DNA for assessing fork symmetry. i Representative images of the nascent bi-directional fork in the indicated cell lines. j Quantification of sister fork ratio in the absence (left) and presence of olaparib (right). Median values are indicated. P values derived by Kruskal–Wallis test from >120 fibers/condition collected over three biologically independent experiments. Source data are provided as a Source data file.
Fig. 8
Fig. 8. APE1 promotes PARPi mediated-PARP1 trapping and hypersensitivity in ALC1-deficient BRCA mutant cells.
a Schematic of the assay. b Representative images of the chromatin-bound PARP1 in indicated conditions. Scale bar 50 microns. c Quantification of the chromatin-bound signal for PARP1. Each dot represents a single cell. Median is indicated. P value determined by Kruskal–Wallis test derived from 300 cells sampled over three biologically independent experiments. d Model proposing the basis of PARPi hypersensitivity upon ALC1 loss in BRCA mutant cells. In WT cells, PAR-dependent nucleosome sliding by ALC1 promotes accessibility of APE1 to the abasic site buried in the chromatin. In contrast, in ALC1-deficient cells, abasic sites accumulate owing to restricted chromatin accessibility. At the replication forks, APE1 can gain access to abasic sites, resulting in replication-coupled DSBs and fork stalling. Trapping of PARP1/2 enzymes at the breaks by PARPi further delay fork re-start resulting in fork collapse and increased reliance on BRCA1/2 protein for repair and survival. Source data are provided as a Source data file.

References

    1. Kim, D.-S., Camacho, C. V. & Kraus, W. L. Alternate therapeutic pathways for PARP inhibitors and potential mechanisms of resistance. Exp. Mol. Med.53, 42–51 (2021). 10.1038/s12276-021-00557-3 - DOI - PMC - PubMed
    1. Slade, D. PARP and PARG inhibitors in cancer treatment. Genes Dev.34, 360–394 (2020). 10.1101/gad.334516.119 - DOI - PMC - PubMed
    1. D’Andrea, A. D. Mechanisms of PARP inhibitor sensitivity and resistance. DNA Repair71, 172–176 (2018). 10.1016/j.dnarep.2018.08.021 - DOI - PubMed
    1. Bunting, S. F. et al. 53BP1 inhibits homologous recombination in Brca1-deficient cells by blocking resection of DNA breaks. Cell141, 243–254 (2010). 10.1016/j.cell.2010.03.012 - DOI - PMC - PubMed
    1. Greenberg, R. A. Assembling a protective shield. Nat. Cell Biol.20, 862–863 (2018). 10.1038/s41556-018-0152-x - DOI - PMC - PubMed

MeSH terms

LinkOut - more resources