. 2024 Jul 27;15(1):6328.
doi: 10.1038/s41467-024-50399-6.

High-throughput sensitive screening of small molecule modulators of microexon alternative splicing using dual Nano and Firefly luciferase reporters

Affiliations

High-throughput sensitive screening of small molecule modulators of microexon alternative splicing using dual Nano and Firefly luciferase reporters

Andrew J Best et al. Nat Commun. .

Abstract

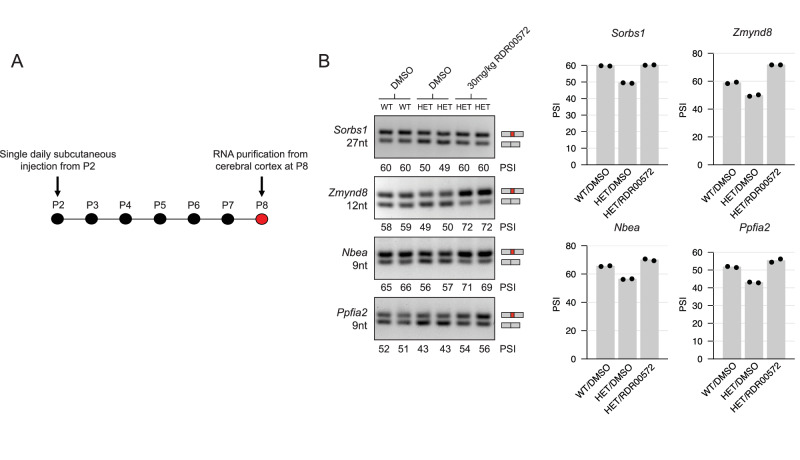
Disruption of alternative splicing frequently causes or contributes to human diseases and disorders. Consequently, there is a need for efficient and sensitive reporter assays capable of screening chemical libraries for compounds with efficacy in modulating important splicing events. Here, we describe a screening workflow employing dual Nano and Firefly luciferase alternative splicing reporters that affords efficient, sensitive, and linear detection of small molecule responses. Applying this system to a screen of ~95,000 small molecules identified compounds that stimulate or repress the splicing of neuronal microexons, a class of alternative exons often disrupted in autism and activated in neuroendocrine cancers. One of these compounds rescues the splicing of several analyzed microexons in the cerebral cortex of an autism mouse model haploinsufficient for Srrm4, a major activator of brain microexons. We thus describe a broadly applicable high-throughput screening system for identifying candidate splicing therapeutics, and a resource of small molecule modulators of microexons with potential for further development in correcting aberrant splicing patterns linked to human disorders and disease.


Conflict of interest statement

The authors declare no competing interests.

Figures

Fig. 1
Fig. 1. Generation of Neuro-2A cell lines expressing doxycycline-inducible, dual-luciferase microexon splicing reporters.
A Schematic diagram of reciprocal, dual luciferase microexon splicing reporters expressed in Neuro-2A (N2A) cells under doxycycline-inducible control. The reporters contain a microexon from the Mef2d gene, engineered to introduce a +1nt (V1) or −1nt (V2) shift in the downstream reading frame (see Fig. S1 for details), such that microexon inclusion or skipping results in expression of Nano or Firefly luciferases tagged with PEST protein degradation sequences. The reporters additionally contain 5′ and 3′ flanking native intron and constitutive exon sequences (C1 and C2) from the Mef2d gene, and coding sequence for three tandem Flag epitopes (3 X FLAG) to facilitate detection of expressed luciferases at the protein level (Fig. S1). B Top: Quantification of Nano and Firefly luminescence from dual luciferase microexon splicing reporter V1 in response to transfection with increasing amounts of an SRRM4 expression vector (n = 4, data are represented as mean values +/− SD). Bottom: RT-PCR assays of reporter Mef2d microexon percent spliced-in (i.e. the percentage of transcripts with the exon spliced in, PSI) in response to transfection with increasing amounts of SRRM4 expression vector. Right: Correlation between percent Firefly luminescence and ∆PSI from RT-PCR assays (r = 0.996). C Quantification of Nano and Firefly luminescence from dual-luciferase microexon splicing reporter V2 (n = 4, data are represented as mean values +/− SD) as in (B) but with the correlation analysis comparing percent Nano luminescence and ∆PSI from RT-PCR assays (r = 0.996). D Schematic diagram of high-throughput screening protocol using the V1 and V2 Mef2d microexon dual-luciferase splicing reporter cell lines in 384-well format. E B-scores of ratios of Firefly and Nano luminescence for the reciprocal Mef2d reporters (V1 and V2) in a pilot screen testing manually curated ‘toolkit’ and Tocris libraries. HDAC inhibitors are highlighted in orange and red. The B-scores are plotted using the following formulae: Mef2d V1 reporter: (B-score of Firefly V1/ Nano V1); Mef2d V2 reporter: (B-score of Nano V2/ B-score of Firefly V2). Hyperbolae were fit to establish hit selection thresholds (see 'Methods' for details). F RT-PCR analysis of reporter Mef2d microexon ∆PSI in response to 24 h treatments with 200 nM Trichostatin A (TSA), 4 μM Scriptaid, or DMSO control. Three replicates are shown for each treatment condition.
Fig. 2
Fig. 2. Identification of small molecule modulators of microexon splicing from a high-throughput screen of ~ 95,000 small molecules.
A Identification of small molecule modulators of microexon splicing from a screen of ~95,000 compounds using the V1 and V2 Mef2d microexon reporters shown in Fig. 1A. The B-scores of luminescence ratios for the reciprocal splicing reporters are plotted as described for Fig. 1E. Hyperbolae were fit to establish hit selection thresholds (see 'Methods' for details). B A two-fold serial dilution series (40 nM–20 μM) was performed for 567 putative hit compounds selected from (A) and assayed using the Mef2d V1 reporter (see 'Methods' for details); example plots are shown for the change in relative luminescence of Nano and Firefly luciferase over the dilution series for the Mef2d microexon repressor AW00693 (top), and the activator SAHA/Vorinostat (bottom). Shaded area and solid line represent range and mean of two biological replicates. C Lower rows: Heatmap showing changes in splicing levels (ΔPSI) of the Mef2d reporter microexon, endogenous microexons (Mef2d, Mast2, Ergic3, Trappc9), and longer cassette neural-differential exons (Zdhhc20, Mgrn1, Asph), following treatment of N2A cells with 91 hit compounds validated by the secondary, serial dilution screen. Upper rows: Luminescence ratio B-scores, based on measurements from the primary screen using the V1 and V2 reporters (A), are shown for comparison. RT-PCR data were collected from single replicate experiments. D Correlation analysis of ΔPSI measured by RT-PCR with mean changes in luminescence ratio B-scores measured using the primary screen V1 and V2 reporter data in (A).
Fig. 3
Fig. 3. Classification and chemical structures of small molecule modulators of microexon splicing.
A Clustering of representative RT-PCR-validated hits using Tanimoto 2D structural similarity score. Right labels: Representative microexon activator and repressor compounds selected for RNA-Seq analysis are indicated in red and blue text, respectively. Top labels: Histone deacetylase (HDAC) inhibitors and protein kinase inhibitors (PKIs) are indicated along with targets if known. B Representative 2D chemical structures representing four categories of small molecule modulators of microexon splicing (HDAC inhibitors, PKIs, and drug-like screening molecule activators and inhibitors). Compounds shown in (B) are highlighted in bold in (A).
Fig. 4
Fig. 4. Transcriptome-wide analysis of alternative splicing and gene expression changes following small molecule treatments in N2A cells.
A Global correlation of RNA-seq-profiled ∆PSI patterns of alternative splicing events (representing all classes) in N2A cells, following treatments with 27 different small molecules highlighted in Fig. 3 that activate (red) or inhibit (blue) microexon splicing. *indicates analysis of two replicate treatments (otherwise analysis of single treatments was performed). B Percentage of detected alternative splicing events belonging to different classes with changing levels (≥10 ∆PSI) following treatments with CI-994, RDR00572, Trametinib, AW00693 or T5985871. CE cassette exons; MIC microexons; Alt5/Alt3 alternative 5′/3′-splice sites; IR intron retention. Absolute numbers of increasing and decreasing events are indicated. See Fig. S4 for analysis of all compounds analyzed by RNA-seq. C Percentage of Srrm4/Srrm3-dependent alternative splicing events with changing levels (≥10 ∆PSI) following treatments with CI-994, RDR00572, Trametinib, AW00693 or T5985871. Absolute numbers of exons with increased and decreased levels are indicated. CE cassette exons; MIC microexons. See Fig. S5B for additional HDAC inhibitors. D Gene Ontology (GO) enrichment analysis for genes containing cassette exons (CE) or microexons (MIC) with increased levels (≥10 ∆PSI) following treatment with CI-994, Trametinib or RDR00572. P-value thresholds from one-tailed, adjusted t-tests as implemented in FuncAssociate are indicated ('Methods'). E Global analysis of gene expression (GE) changes (log fold-change [FC]) following treatments with CI-994, RDR00572, Trametinib, AW00693 or T5985871. FDR < 0.05 (blue), FDR < 0.05, LFC > 1, maxRPKM >5 (red)); numbers at the top and bottom right corner indicate genes with increased and decreased expression, respectively.
Fig. 5
Fig. 5. Drug-like screening molecules inhibit microexon splicing and neuroendocrine biomarker expression in neuroendocrine small cell lung cancer (SCLC) and prostate cancer (NEPC)-derived cell lines.
A RT-PCR validation of REST exon 4 (REST4) and microexon splicing changes in NCI-82 cells treated with the drug-like screening molecule inhibitors AW00693, T5635931, T5963258 and T5985871. RNA from an untreated human neuroblastoma cell line IMR-32 was assayed in parallel as a positive control for detection of microexon splicing. Quantification of ∆PSI, relative to 0.4% DMSO treatment, from four replicates is shown on the right. B RT-qPCR analysis of mRNA expression level changes for the neuroendocrine cell biomarkers REST/REST4, SRRM3, and SRRM4 in NCI-82 cells following treatment with the drug-like screening molecule inhibitors AW00693, T5635931, T5963258 and T5985871, relative to 0.4% DMSO control treatment (n = 3). C RT-qPCR analysis of mRNA expression level changes for the neuroendocrine cell biomarkers SYP, SRRM4 and SRRM3 in the prostate cancer cell lines 22Rv1 (blue), VCaP (orange), and NCI-H660 (green), following single treatments with increasing concentrations (1 μM–10 μM) of the drug-like screening molecule inhibitors AW00693 and T5985871. Expression levels are shown relative to 0.4% DMSO control treatment. Mean mRNA expression levels across all three cell lines are indicated by heights of grey bar plots.
Fig. 6
Fig. 6. Srrm4-dependence for small molecule modulation of microexon splicing.
A RNA-Seq analysis of mRNA expression level changes corresponding to mRNA-binding proteins, following treatments with compounds CI-994, RDR00572, Trametinib, AW00693 or T5985871, using data shown in Fig. 4. Levels are shown relative to 0.4% DMSO control treatments. Genes changing more than 2-fold and with FDR < 0.05 are highlighted, with thresholds indicated with dashed lines. B Western blot analysis of changes in levels of splicing regulators in N2A cells following treatment with compounds BRD6688, CI-994, RDR00572, Trametinib, AW00693, or T5985871, in comparison with levels detected in 0.4% DMSO control treatment. *p < 0.05, one-sided paired samples student’s t test (with three or more independent biological replicates). Data are represented as mean +/− SD. p values: p = 0.025 (SRRM4, Trametinib); 3.1 * 10−7 (SRRM4, AW00693); 2.7 * 10−7 (SRRM4, T5985871); 0.0077 (PTBP1, AW00693); 0.00028 (PTBP1, T5985871); 0.015 (QKI, AW00693); 0.00034 (QKI, T5985871); 0.050 (RBFOX2, AW00693); 0.024 (RBFOX2, T5985871); 0.0015 (RBM38, Trametinib); 0.0019 (RBM38, AW00693). C Percentage of cassette exons (CE) and microexons (MIC) repressed by Rbm38 that change in level (≥10 ∆PSI) following treatment with CI-994, RDR00572, Trametinib, AW00693 or T5985871. Absolute numbers of exons with increased and decreased levels are indicated. D Meta-exon plot of individual-nucleotide resolution UV crosslinking and immunoprecipitation (iCLIP) signal (measured as reads recovered from crosslinked RNA per million reads) of Srrm4 surrounding cassette exons and microexons in cortical neurons, and corresponding to exons that change in splicing level following Trametinib treatment of N2A cells. Lines and shaded areas indicate mean and standard error across the sets of events and three replicate experiments. Lower plots indicate number of aligned sequences at each position.
Fig. 7
Fig. 7. Rescue of splicing of several analyzed brain microexons following treatment of mice haploinsufficient for Srrm4 with the orphan compound RDR00572.
A Protocol for postnatal treatment in which pups received a single daily subcutaneous injection between postnatal day 2 (P2) to postnatal day 8 (P8). RNA was purified from the cerebral cortex of treated mice at P8. B Left, RT-PCR assays monitoring levels of splicing of Srrm4-dependent microexons in mock-treated (DMSO) wild-type (SRRM4+/+) mice, heterozygous (SRRM4+/Δ78) mice, and in SRRM4+/Δ78 mice treated with 30 mg/kg doses of RDR00572 (n = 2). Right, quantification of replicate experiments.

References

    1. Ule, J. & Blencowe, B. J. Alternative splicing regulatory networks: functions, mechanisms, and evolution. Mol. Cell76, 329–345 (2019). 10.1016/j.molcel.2019.09.017 - DOI - PubMed
    1. Baralle, F. E. & Giudice, J. Alternative splicing as a regulator of development and tissue identity. Nat. Rev. Mol. Cell Biol.18, 437–451 (2017). 10.1038/nrm.2017.27 - DOI - PMC - PubMed
    1. Rogalska, M. E., Vivori, C. & Valcarcel, J. Regulation of pre-mRNA splicing: roles in physiology and disease, and therapeutic prospects. Nat. Rev. Genet.24, 251–269 (2022). - PubMed
    1. Marasco, L. E. & Kornblihtt, A. R. The physiology of alternative splicing. Nat. Rev. Mol. Cell Biol.24, 242–254 (2022). - PubMed
    1. Li, Y. I. et al. RNA splicing is a primary link between genetic variation and disease. Science352, 600–604 (2016). 10.1126/science.aad9417 - DOI - PMC - PubMed

Substances