. 2024 Jul 27;15(1):6342.
doi: 10.1038/s41467-024-50594-5.

Deployment expectations of multi-gigatonne scale carbon removal could have adverse impacts on Asia's energy-water-land nexus

Affiliations

Deployment expectations of multi-gigatonne scale carbon removal could have adverse impacts on Asia's energy-water-land nexus

Jeffrey Dankwa Ampah et al. Nat Commun. .

Abstract

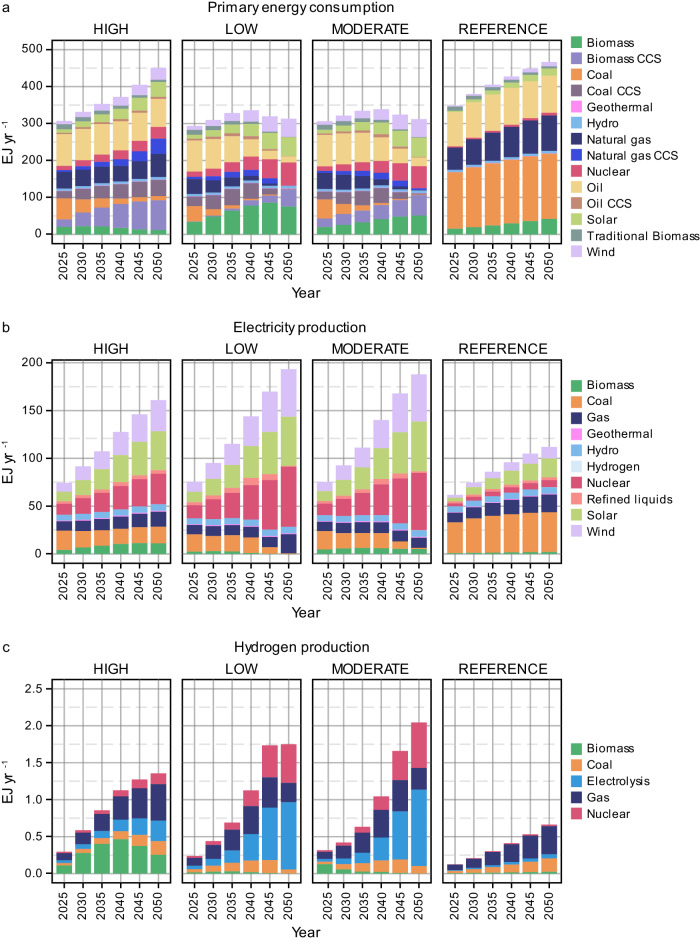
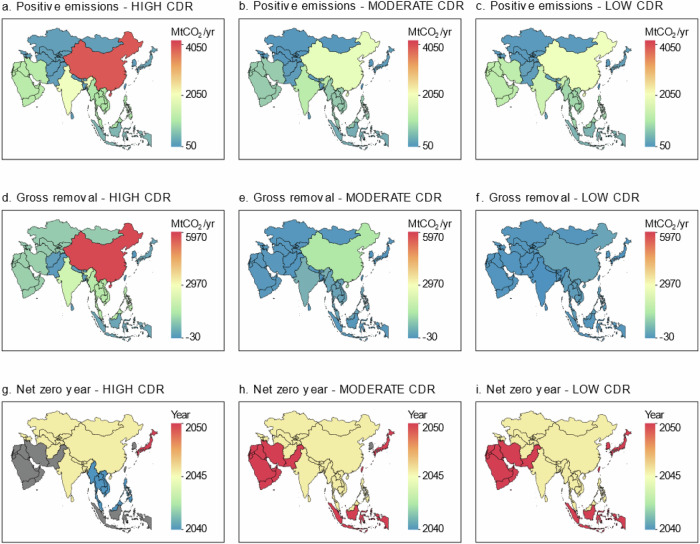
Existing studies indicate that future global carbon dioxide (CO2) removal (CDR) efforts could largely be concentrated in Asia. However, there is limited understanding of how individual Asian countries and regions will respond to varying and uncertain scales of future CDR concerning their energy-land-water system. We address this gap by modeling various levels of CDR-reliant pathways under climate change ambitions in Asia. We find that high CDR reliance leads to residual fossil fuel and industry emissions of about 8 Gigatonnes CO2yr-1 (GtCO2yr-1) by 2050, compared to less than 1 GtCO2yr-1 under moderate-to-low CDR reliance. Moreover, expectations of multi-gigatonne CDR could delay the achievement of domestic net zero CO2 emissions for several Asian countries and regions, and lead to higher land allocation and fertilizer demand for bioenergy crop cultivation. Here, we show that Asian countries and regions should prioritize emission reduction strategies while capitalizing on the advantages of carbon removal when it is most viable.


Conflict of interest statement

The authors declare no competing interests.

Figures

Fig. 1
Fig. 1. Impacts on Asia’s energy system.
Primary energy consumption by source (a). Electricity production by source (b). Hydrogen production by source (c). All results are from 2025 to 2050 for different levels of carbon dioxide removal (CDR) reliance (HIGH, MODERATE, and LOW) in Asia alongside a no-climate-policy scenario (REFERENCE). CCS carbon capture with storage, EJyr−1 exajoule per year.
Fig. 2
Fig. 2. Response of Asian countries and regions to energy sector transition under varying carbon dioxide removal (CDR) reliance.
The results include the share of renewables in total primary energy consumption by 2050 (ac), the share of electrified transport in the transport sector by 2050 (df), and building final energy consumption reduction relative to a reference scenario by 2050 (gi). The findings indicate that under the HIGH CDR scenario, the highest share of electrified transport in any Asian region or country remains below 15%, with Central Asia and Japan having the highest shares at 12.90% and 8.64%, respectively. Countries such as China and India exhibit shares of only 4.50% and 3.75% for electrified transport, respectively. Under the MODERATE and LOW CDR scenarios, the highest share of electrified transport can rapidly increase to 42–47%, with China and India’s shares reaching about 25–30% and 30–35%, respectively. Under the HIGH CDR scenario (in contrast to the REFERENCE case), Central Asia, South Asia, and China would record the highest reductions in building energy consumption by 2050 at 25.39%, 22.6%, and 22.50%, respectively. These reduction rates significantly increase to 38.8%, 50%, and 34% in these regions, respectively, under the MODERATE CDR scenario. Our analysis considered Island countries/regions and Territories in Asia but they are not included in the map.
Fig. 3
Fig. 3. Impacts on emissions and air pollution.
Total positive and negative CO2 emissions by sector and species (a). It should be noted that Asia reaches net zero GHG emissions around mid-century, indicating net zero CO2 and net negative CO2 emissions could occur in earlier years depending on the scenario and the amount of carbon dioxide removal (CDR) available to offset residual emissions. Positive values for LUC in some years represent net positive emissions, where deforestation exceeds the afforestation rate. Total air pollutants in Asia (b). All results are from 2025-2050 for different levels of CDR reliance (HIGH, MODERATE, and LOW) in Asia alongside a no-climate-policy scenario (REFERENCE). “Other” refers to other energy transformation processes such as hydrogen production and refining. LUC land use change, BECCS bioenergy with carbon capture and storage, DACCS direct air capture and carbon storage, DORCS direct ocean removal and carbon storage, ERW enhanced rock weathering, BC black carbon, NH3 ammonia, NMVOC non-methane volatile organic compounds, NOx nitrogen oxides, OC organic compounds, SO2 sulfur dioxide, GtCO2eyr−1 gigatonnes of carbon dioxide equivalent per year, Tgyr−1 teragrams per year.
Fig. 4
Fig. 4. Negative emissions type by country/region.
Carbon dioxide removal (CDR) distribution by technology/practice across Asia under various CDR deployment scenarios (a: LOW; b: MODERATE; c: HIGH) by 2050 alongside a no-climate-policy scenario (d: REFERENCE). Negative values for LUC in some countries or regions represent net positive emissions, where deforestation exceeds the afforestation rate. LUC land use change, BECCS bioenergy with carbon capture and storage, DACCS direct air capture and carbon storage, DORCS direct ocean removal and carbon storage, ERW enhanced rock weathering, MtCO2yr−1 million tonnes of carbon dioxide per year.
Fig. 5
Fig. 5. Impact on positive and negative emissions and net zero timing.
The results include the distribution of total positive CO2 emissions by 2050 (includes both fossil fuel and industry and bio-derived CO2) (ac), the distribution of total gross carbon dioxide removal (CDR) by 2050 (df), and the timing of domestic net zero CO2 emissions (gi). Gray color in panels gi indicates that the country or region does not attain domestic net zero CO2 before 2050. The results show that under the HIGH CDR scenario, the following countries’ (or regions’) annual CO2 emissions would exceed 1 GtCO2 per year by mid-century: China (4.1 GtCO2yr−1), India (2.4 GtCO2yr−1), the Middle East (1.2 GtCO2yr-1), and Southeast Asia (1.2 GtCO2yr−1). The same four countries or regions individually cross the 1 GtCO2 per year threshold by 2050 under the LOW CDR scenario; that is, China (2.3 GtCO2yr−1), India (1.7 GtCO2yr−1), the Middle East (1.4 GtCO2yr−1), and Southeast Asia (1.0 GtCO2yr−1). Under the HIGH CDR scenario, CO2 removal by mid-century would be mainly concentrated in China (6 GtCO2yr−1), India (1.8 GtCO2yr−1), and the Middle East (0.9 GtCO2yr−1). Under the MODERATE CDR scenario, these removal capacities in the three countries/regions significantly reduce to 1.2, 0.5, and 0.08 GtCO2yr−1, respectively. Also, under the HIGH CDR scenario, the assumption is that countries or regions such as Indonesia, the Middle East, Pakistan, South Korea, and Taiwan (China) may choose to pursue cheaper mitigation routes by purchasing foreign CDR instead of achieving domestic net zero before the end of 2050, which is relatively more expensive. However, under the MODERATE and LOW CDR scenarios, Asian countries or regions could advance or maintain the year of attaining domestic net-zero CO2 emissions compared to the case of the HIGH CDR scenario. Our analysis considered Island countries/regions and Territories in Asia but they are not included in the map. MtCO2yr−1: million tonnes of carbon dioxide per year.
Fig. 6
Fig. 6. Impact on land, water, and fertilizer use.
Asia’s aggregated land use allocation (a). Water consumption by sector in Asia (b). Fertilizer demand by crop source in Asia (c). All results are from 2025-2050 for different levels of carbon dioxide removal (CDR) reliance (HIGH, MODERATE, and LOW) in Asia alongside a no-climate-policy scenario (REFERENCE). CCS carbon capture and storage, DACCS direct air capture and carbon storage, Mkm2 million square kilometers, km3 cubic kilometers, MtN million tonnes of nitrogen.
Fig. 7
Fig. 7. Impact on land allocation towards bioenergy crops and other agro-land allocation.
The results include the percent change in land allocation to bioenergy crops between 2025–2050 (ac) and the percent change in other agro-land allocation (crops, grass, other arable, pasture, and shrubs) between 2025-2050 (df). CDR carbon dioxide removal. Our analysis considered Island countries/regions and Territories in Asia but they are not included in the map.

References

    1. Lamboll, R. D. et al. Assessing the size and uncertainty of remaining carbon budgets. Nat. Clim. Change. 10.1038/s41558-023-01848-5 (2023).
    1. IPCC. Climate Change 2022: Mitigation of Climate Change. Contribution of Working Group III to the Sixth Assessment Report of the Intergovernmental Panel on Climate Change. (eds. P. R. Shukla, et al.) (Cambridge University Press, 2022).
    1. Smith, S. M. et al. The State of Carbon Dioxide Removal. 1st edn. (2023).
    1. Iyer, G. et al. Taking stock of nationally determined contributions: Continued ratcheting of ambition is critical to limit global warming to 1.5 °C. One Earth6, 1089–1092 (2023). 10.1016/j.oneear.2023.08.019 - DOI - PMC - PubMed
    1. Ho, D. T. Carbon dioxide removal is not a current climate solution — we need to change the narrative. Nature616, 9–9 (2023). 10.1038/d41586-023-00953-x - DOI - PubMed

LinkOut - more resources