Diet at birth is critical for healthy growth, independent of effects on the gut microbiota
- PMID: 39068488
- PMCID: PMC11282663
- DOI: 10.1186/s40168-024-01852-7
Diet at birth is critical for healthy growth, independent of effects on the gut microbiota
Abstract
Background: Colostrum is the first milk for a newborn. Its high content in microbiota shaping compounds and its intake at the time of gut microbiota seeding suggests colostrum may be critical in the establishment of a healthy microbiota. There is also accumulating evidence on the importance of the gut microbiota for healthy growth. Here, we aimed to investigate the contribution of colostrum, and colostrum-induced microbiota to growth promotion. Addressing this question is highly significant because (1) globally, less than half of the newborns are fully colostrum fed (2) the evidence for the importance of the microbiota for the prevention of undernutrition has only been demonstrated in juvenile or adult pre-clinical models while stunting already starts before weaning.
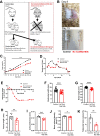
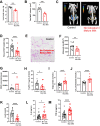
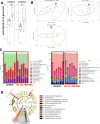
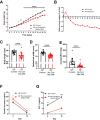
Results: To address the importance of diet at birth in growth failure, we developed a unique mouse model in which neonates are breastfed by mothers at an advanced stage of lactation who no longer provide colostrum. Feeding newborn mice with mature milk instead of colostrum resulted in significant growth retardation associated with the biological features of chronic undernutrition, such as low leptin levels, dyslipidemia, systemic inflammation, and growth hormone resistance. We next investigated the role of colostrum in microbiota shaping. At the end of the lactation period, we found a major difference in gut microbiota alpha diversity, beta diversity, and taxa distribution in control and colostrum-deprived mice. To determine the causal relationship between changes in microbiota and growth trajectories, we repeated our experiment in germ-free mice. The beneficial effect of colostrum on growth remained in the absence of microbiota.
Conclusion: Our data suggest that colostrum may play an important role in the prevention of growth failure. They highlight that the interplay between neonatal gut microbiome assembly and diet may not be as crucial for growth control in the developing newborn as described in young adults. This opens a paradigm shift that will foster research for colostrum's bioactives that may exert a similar effect to microbiota-derived ligands in promoting growth and lead to new avenues of translational research for newborn-tailored prevention of stunting. Video Abstract.
Keywords: Breast milk; Colostrum; Growth failure; Growth hormone resistance; Neonatal microbiota.
© 2024. The Author(s).
Conflict of interest statement
Author FS is employed by Vaiomer. All other authors declare that they have no competing interests.
Figures


Similar articles
-
Microbiota regulated by Shenling Baizhu powder maintains intestinal homeostasis via the gut-breast axis.Phytomedicine. 2025 Apr;139:156528. doi: 10.1016/j.phymed.2025.156528. Epub 2025 Feb 21. Phytomedicine. 2025. PMID: 40024112
-
Maternal high-fat diet during lactation reduces sialylated milk oligosaccharides and shapes early-life microbiota in rat offspring.Food Funct. 2025 Jun 16;16(12):5123-5132. doi: 10.1039/d5fo00559k. Food Funct. 2025. PMID: 40468776
-
Analysis of the developing gut microbiota in young dairy calves-impact of colostrum microbiota and gut disturbances.Trop Anim Health Prod. 2020 Dec 28;53(1):50. doi: 10.1007/s11250-020-02535-9. Trop Anim Health Prod. 2020. PMID: 33369699 Free PMC article.
-
Can we modulate the breastfed infant gut microbiota through maternal diet?FEMS Microbiol Rev. 2021 Sep 8;45(5):fuab011. doi: 10.1093/femsre/fuab011. FEMS Microbiol Rev. 2021. PMID: 33571360 Review.
-
Anti-Inflammatory and Anti-Allergic Properties of Colostrum from Mothers of Full-Term and Preterm Babies: The Importance of Maternal Lactation in the First Days.Nutrients. 2023 Oct 2;15(19):4249. doi: 10.3390/nu15194249. Nutrients. 2023. PMID: 37836533 Free PMC article. Review.
Cited by
-
Intestinal Microbiota in Early Life: Latest Findings Regarding the Role of Probiotics as a Treatment Approach for Dysbiosis.Nutrients. 2025 Jun 21;17(13):2071. doi: 10.3390/nu17132071. Nutrients. 2025. PMID: 40647176 Free PMC article. Review.
References
-
- WHO. Malnutrition. https://www.who.int/news-room/fact-sheets/detail/malnutrition (2023).
MeSH terms
LinkOut - more resources
Full Text Sources

