Observational Study
. 2024 Oct 15;332(15):1245-1257.
doi: 10.1001/jama.2024.13855.

Blood Biomarkers to Detect Alzheimer Disease in Primary Care and Secondary Care

Affiliations
Observational Study

Blood Biomarkers to Detect Alzheimer Disease in Primary Care and Secondary Care

Sebastian Palmqvist et al. JAMA. .

Abstract

Importance: An accurate blood test for Alzheimer disease (AD) could streamline the diagnostic workup and treatment of AD.

Objective: To prospectively evaluate a clinically available AD blood test in primary care and secondary care using predefined biomarker cutoff values.

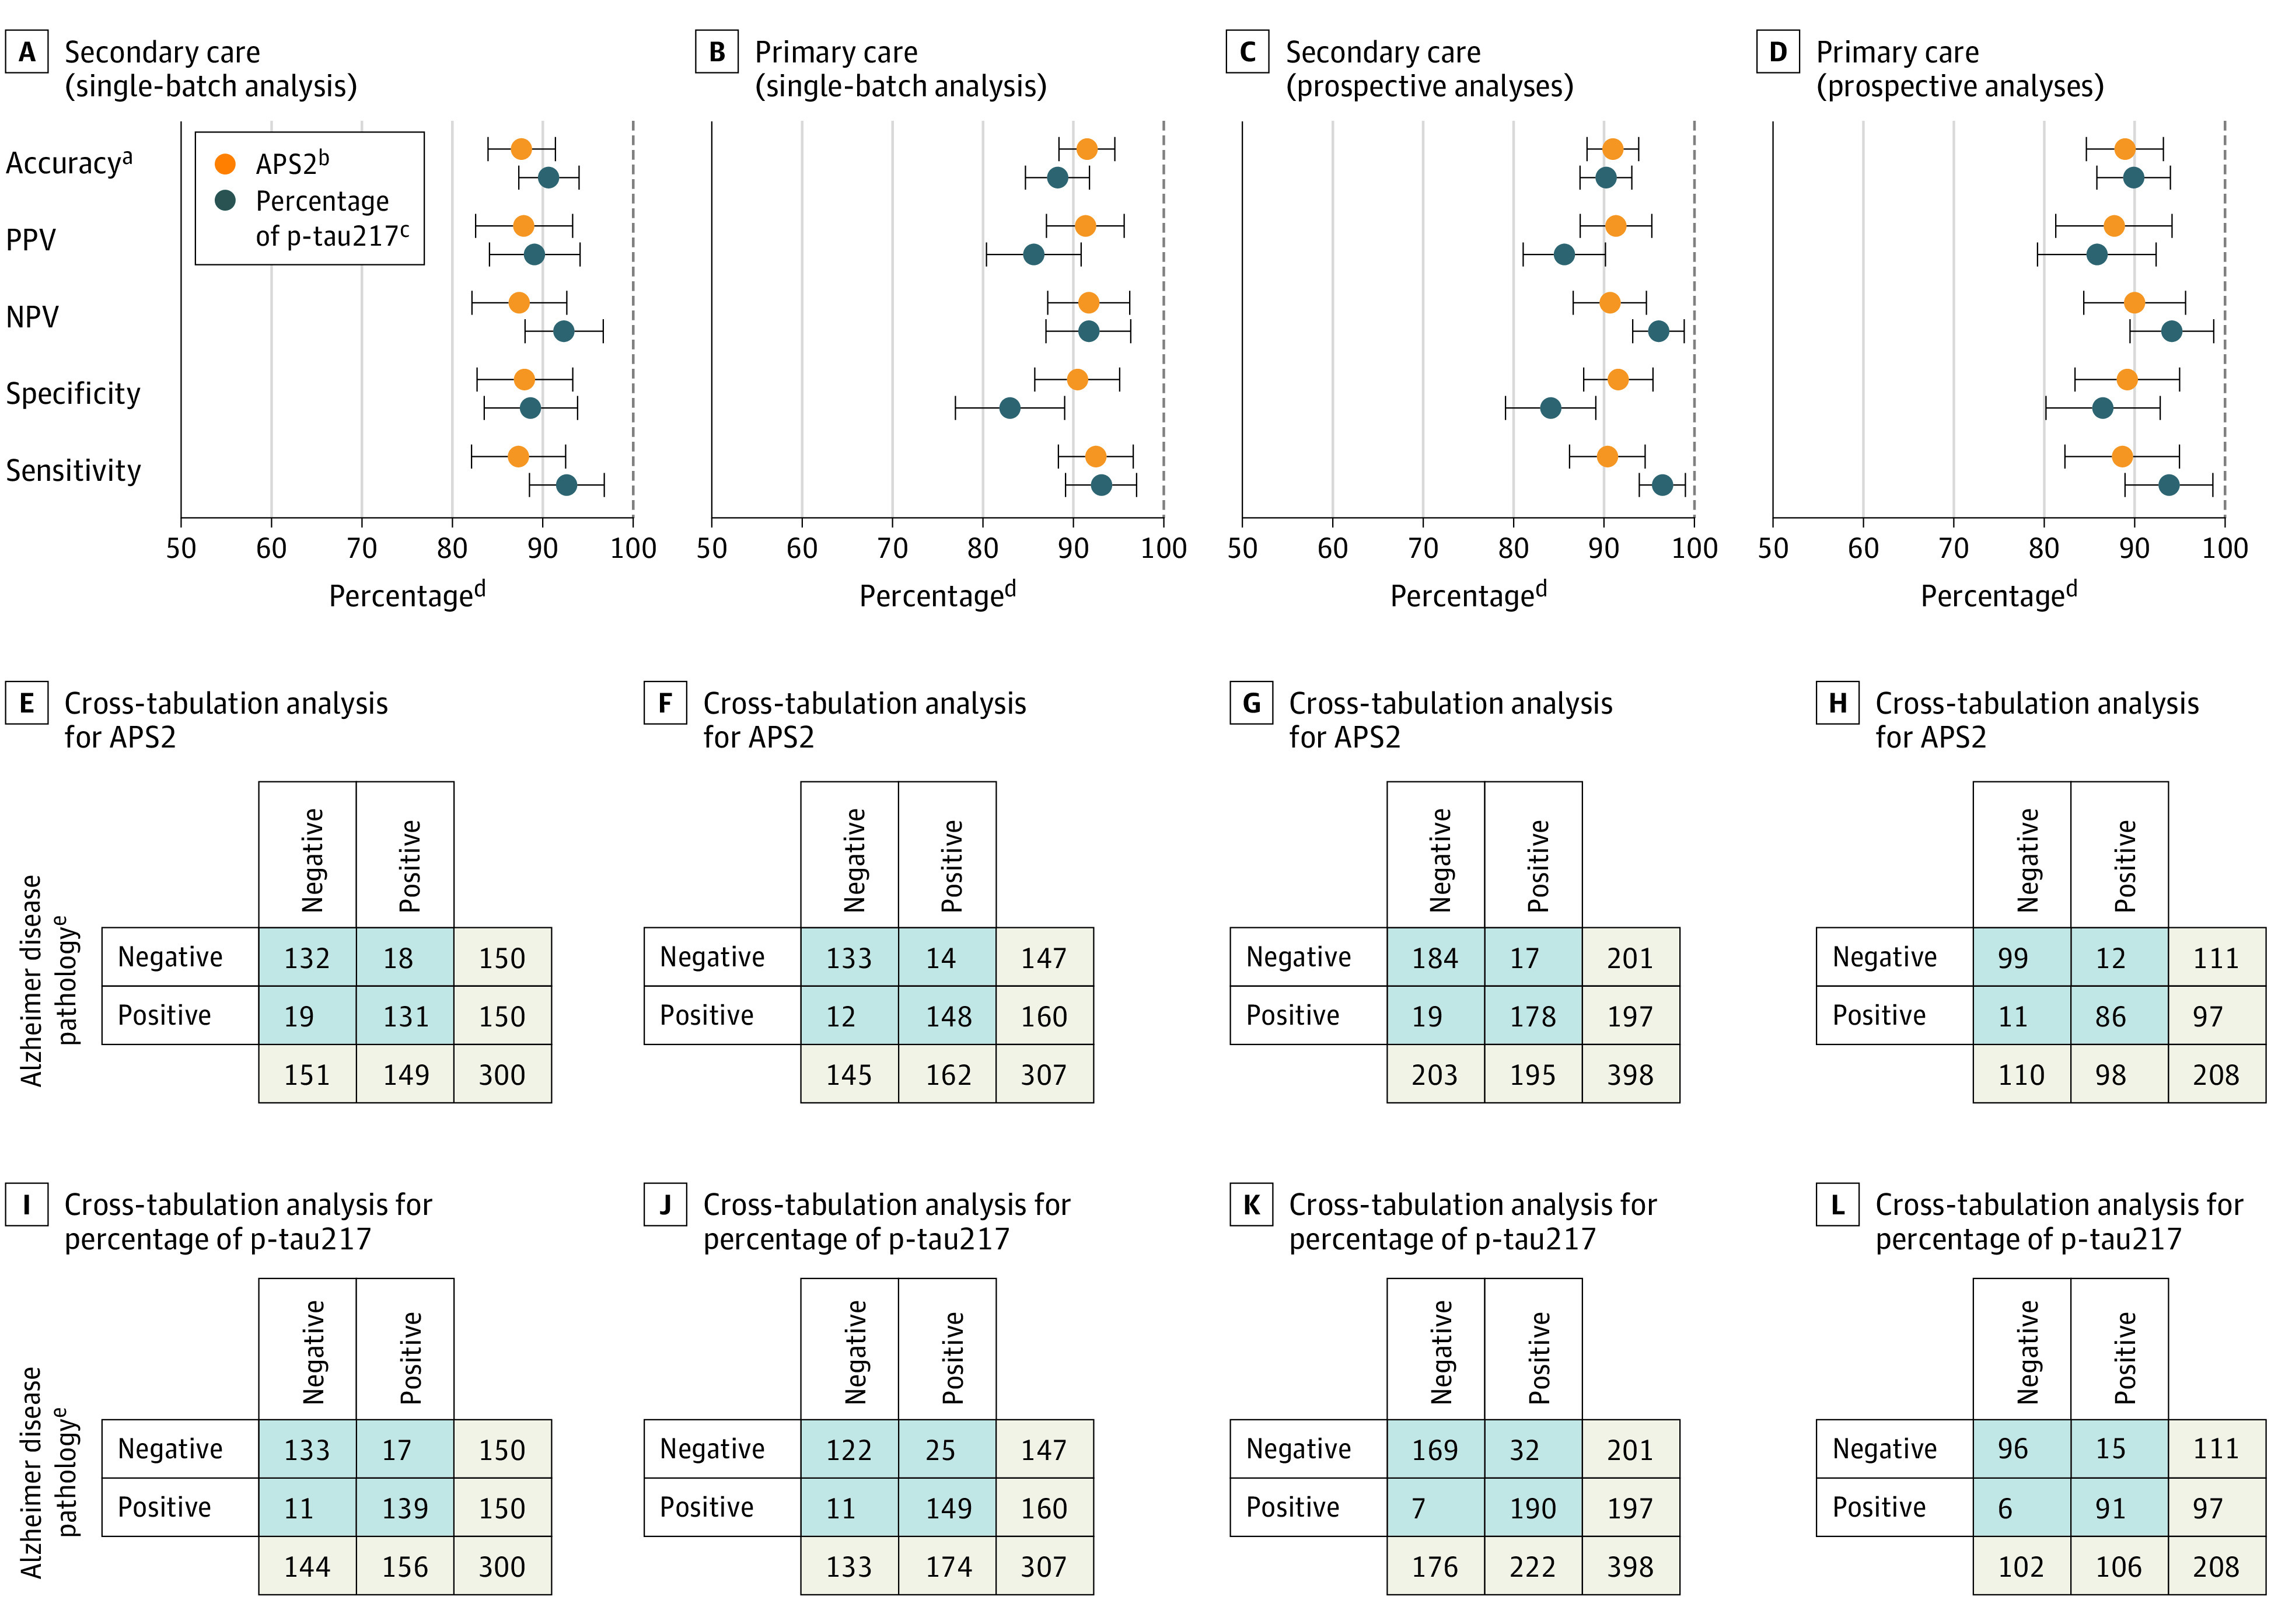
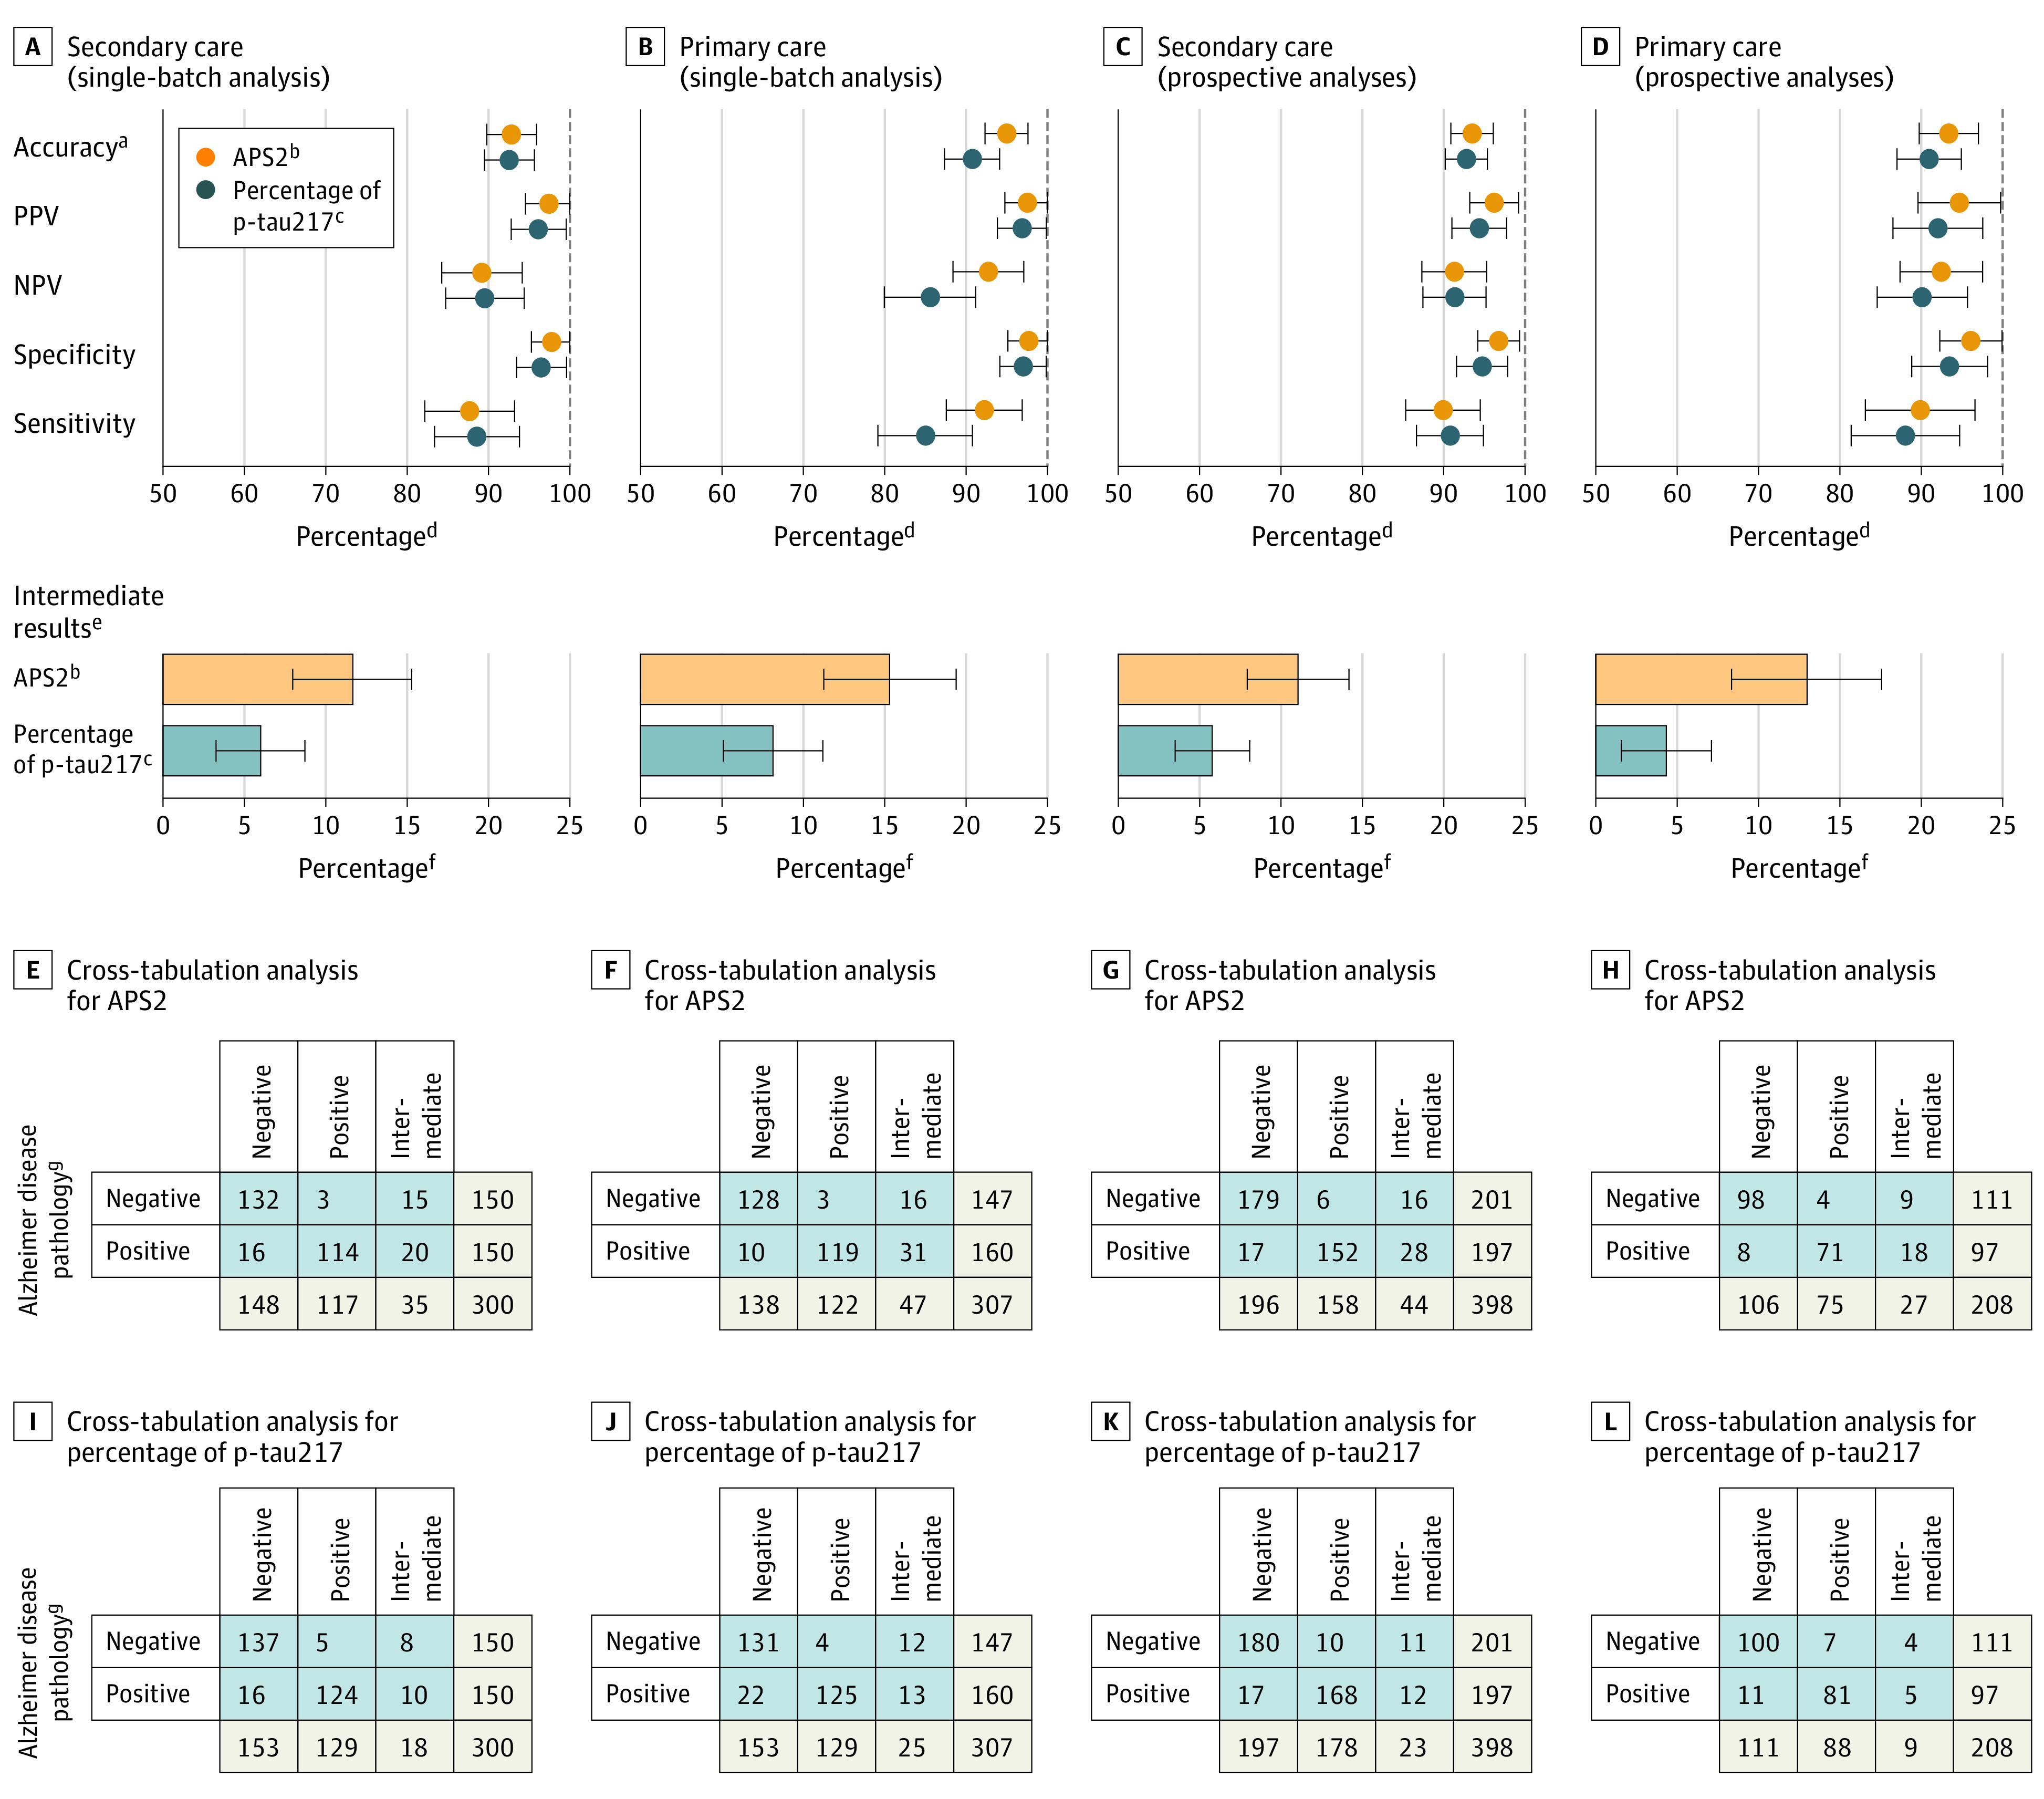
Design, setting, and participants: There were 1213 patients undergoing clinical evaluation due to cognitive symptoms who were examined between February 2020 and January 2024 in Sweden. The biomarker cutoff values had been established in an independent cohort and were applied to a primary care cohort (n = 307) and a secondary care cohort (n = 300); 1 plasma sample per patient was analyzed as part of a single batch for each cohort. The blood test was then evaluated prospectively in the primary care cohort (n = 208) and in the secondary care cohort (n = 398); 1 plasma sample per patient was sent for analysis within 2 weeks of collection.

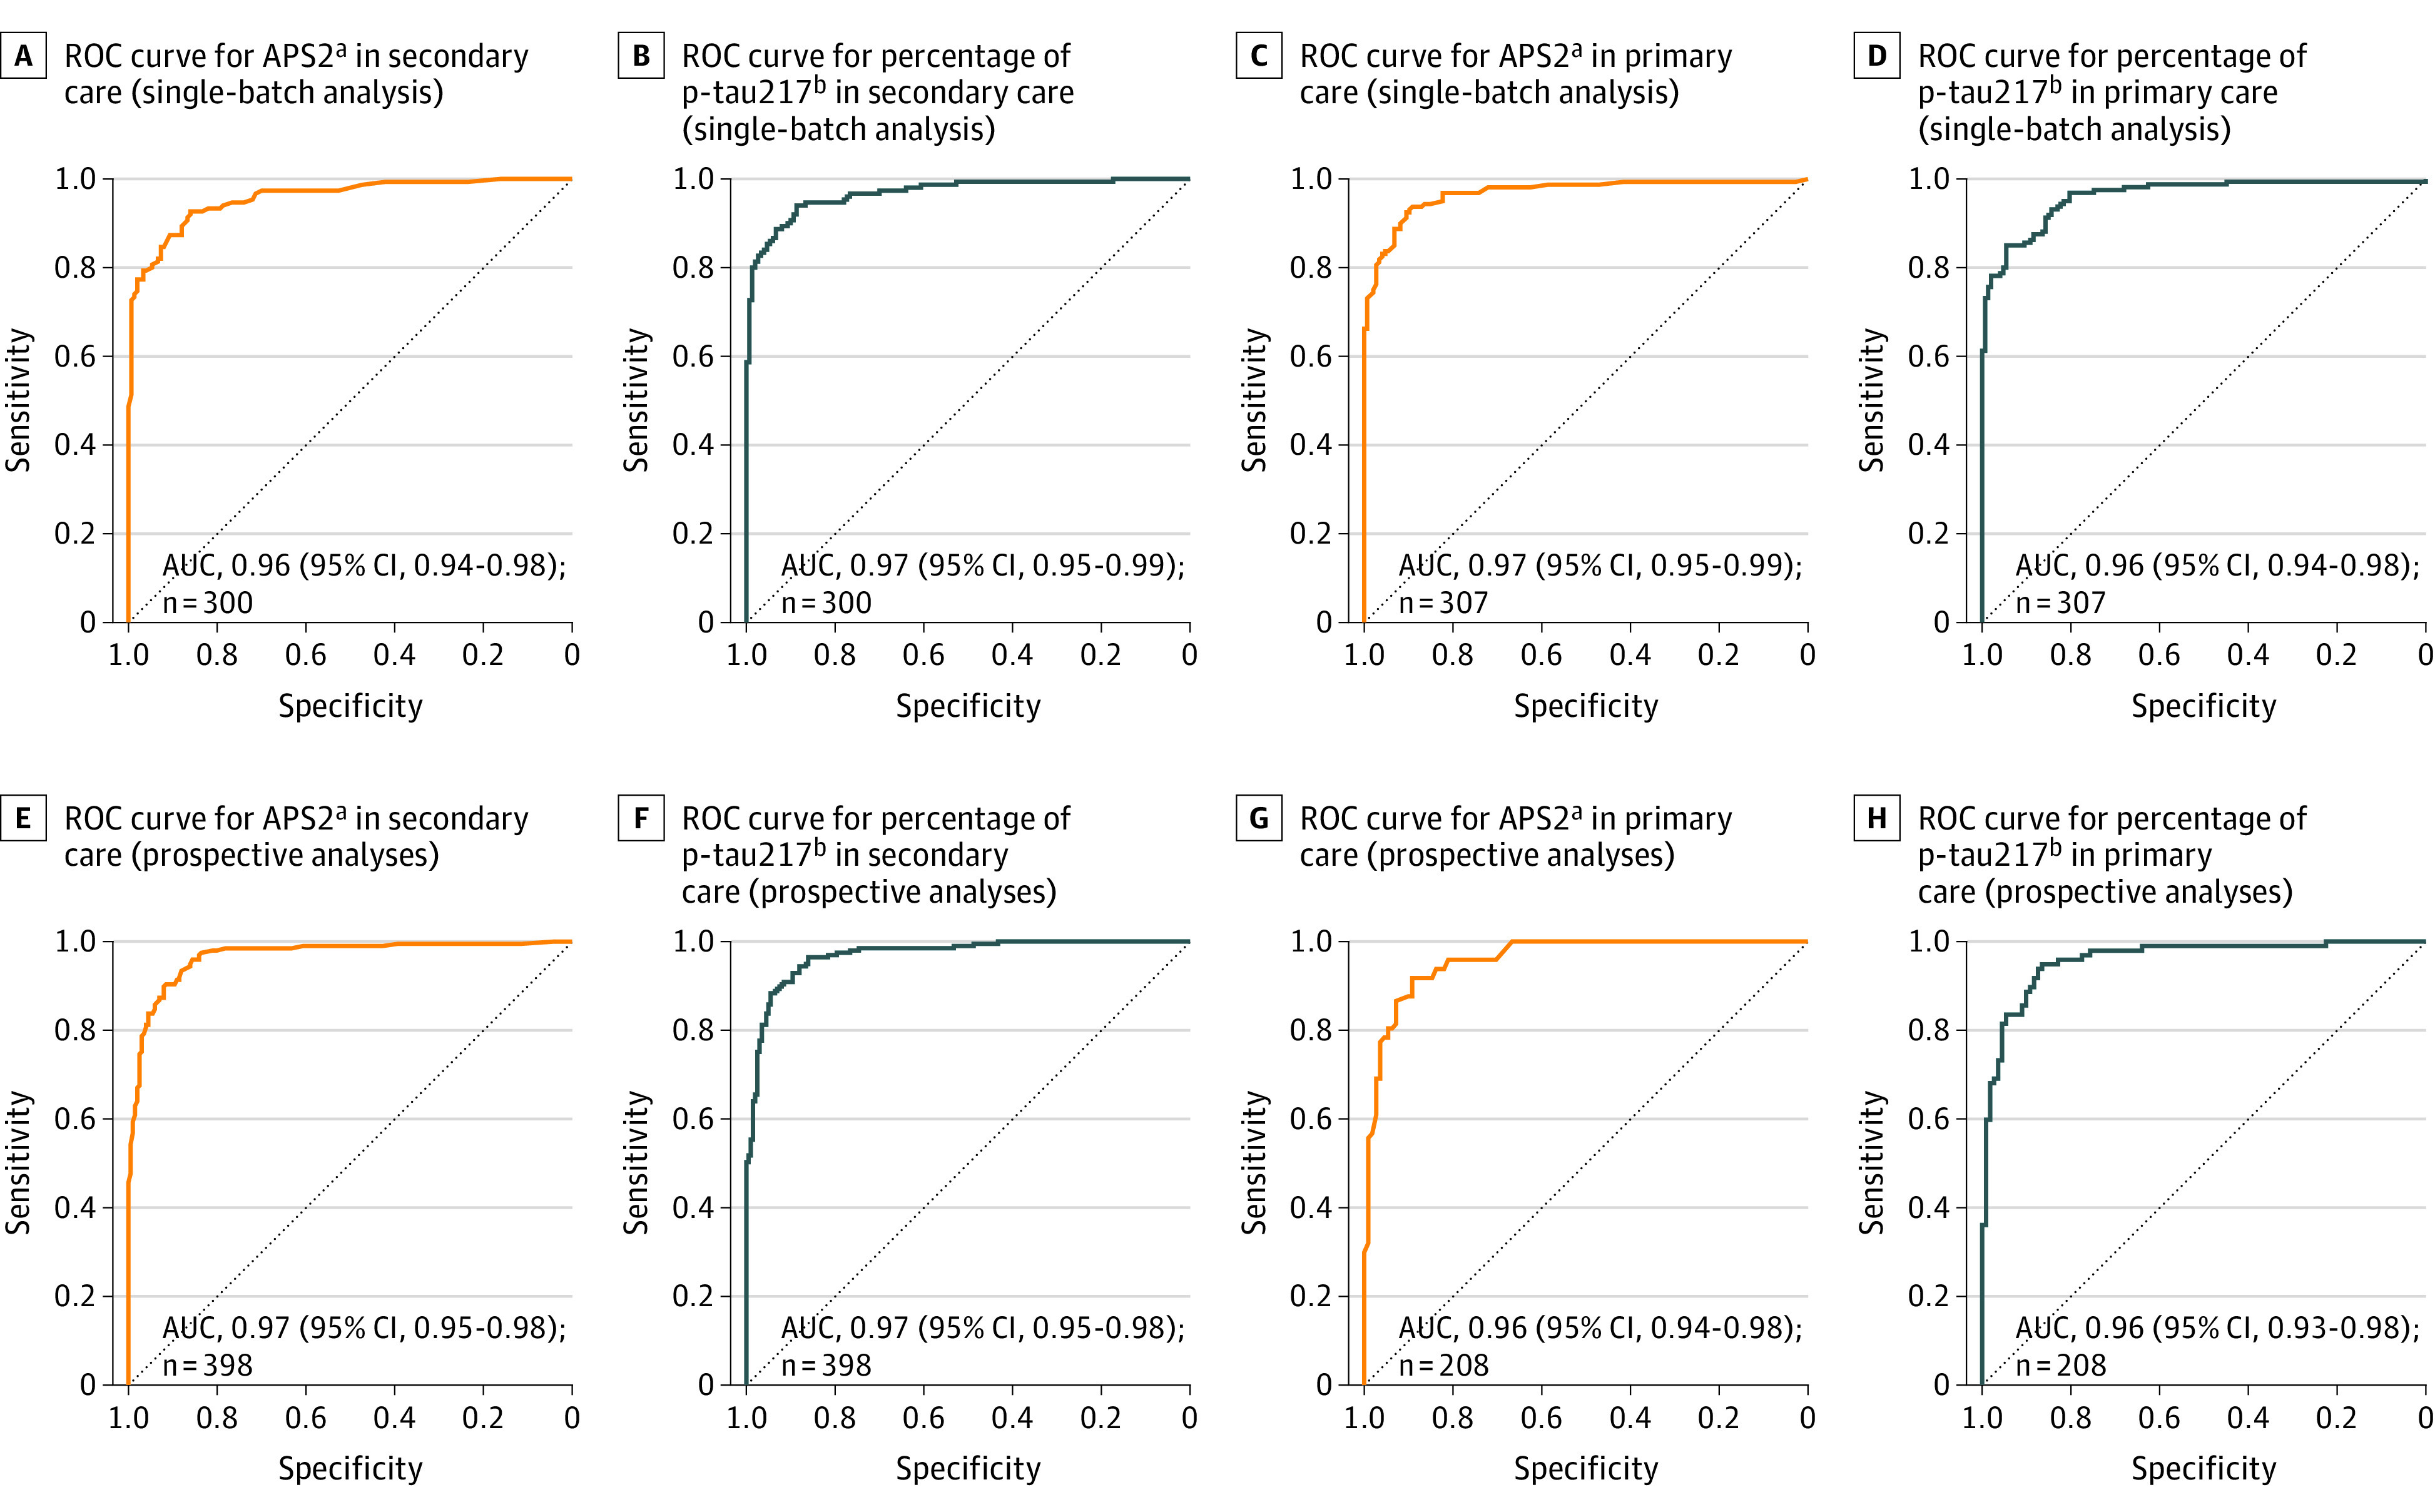
Exposure: Blood tests based on plasma analyses by mass spectrometry to determine the ratio of plasma phosphorylated tau 217 (p-tau217) to non-p-tau217 (expressed as percentage of p-tau217) alone and when combined with the amyloid-β 42 and amyloid-β 40 (Aβ42:Aβ40) plasma ratio (the amyloid probability score 2 [APS2]).

Main outcomes and measures: The primary outcome was AD pathology (determined by abnormal cerebrospinal fluid Aβ42:Aβ40 ratio and p-tau217). The secondary outcome was clinical AD. The positive predictive value (PPV), negative predictive value (NPV), diagnostic accuracy, and area under the curve (AUC) values were calculated.

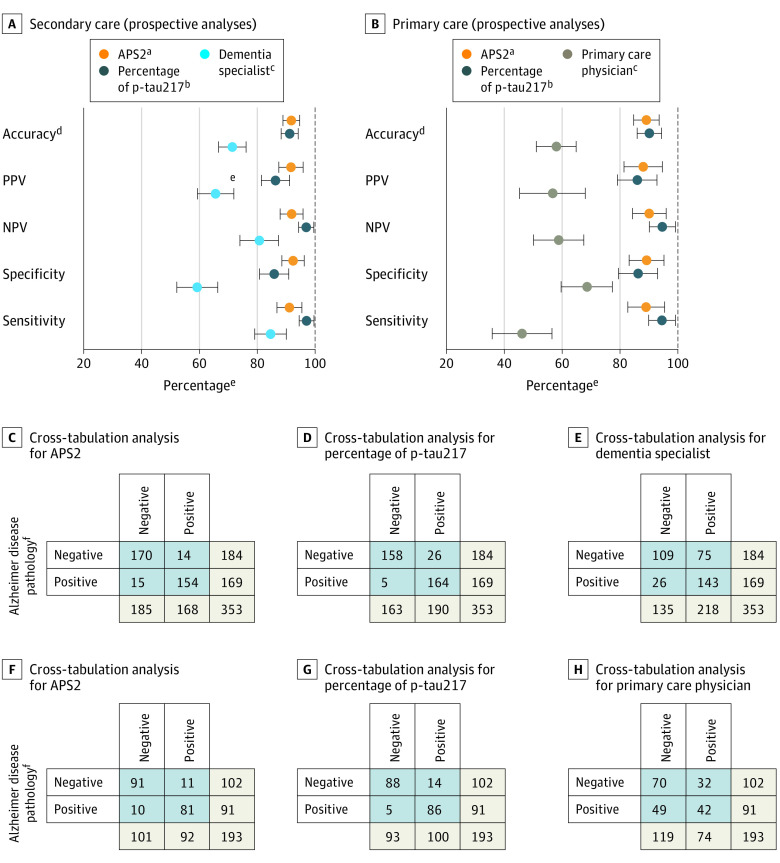
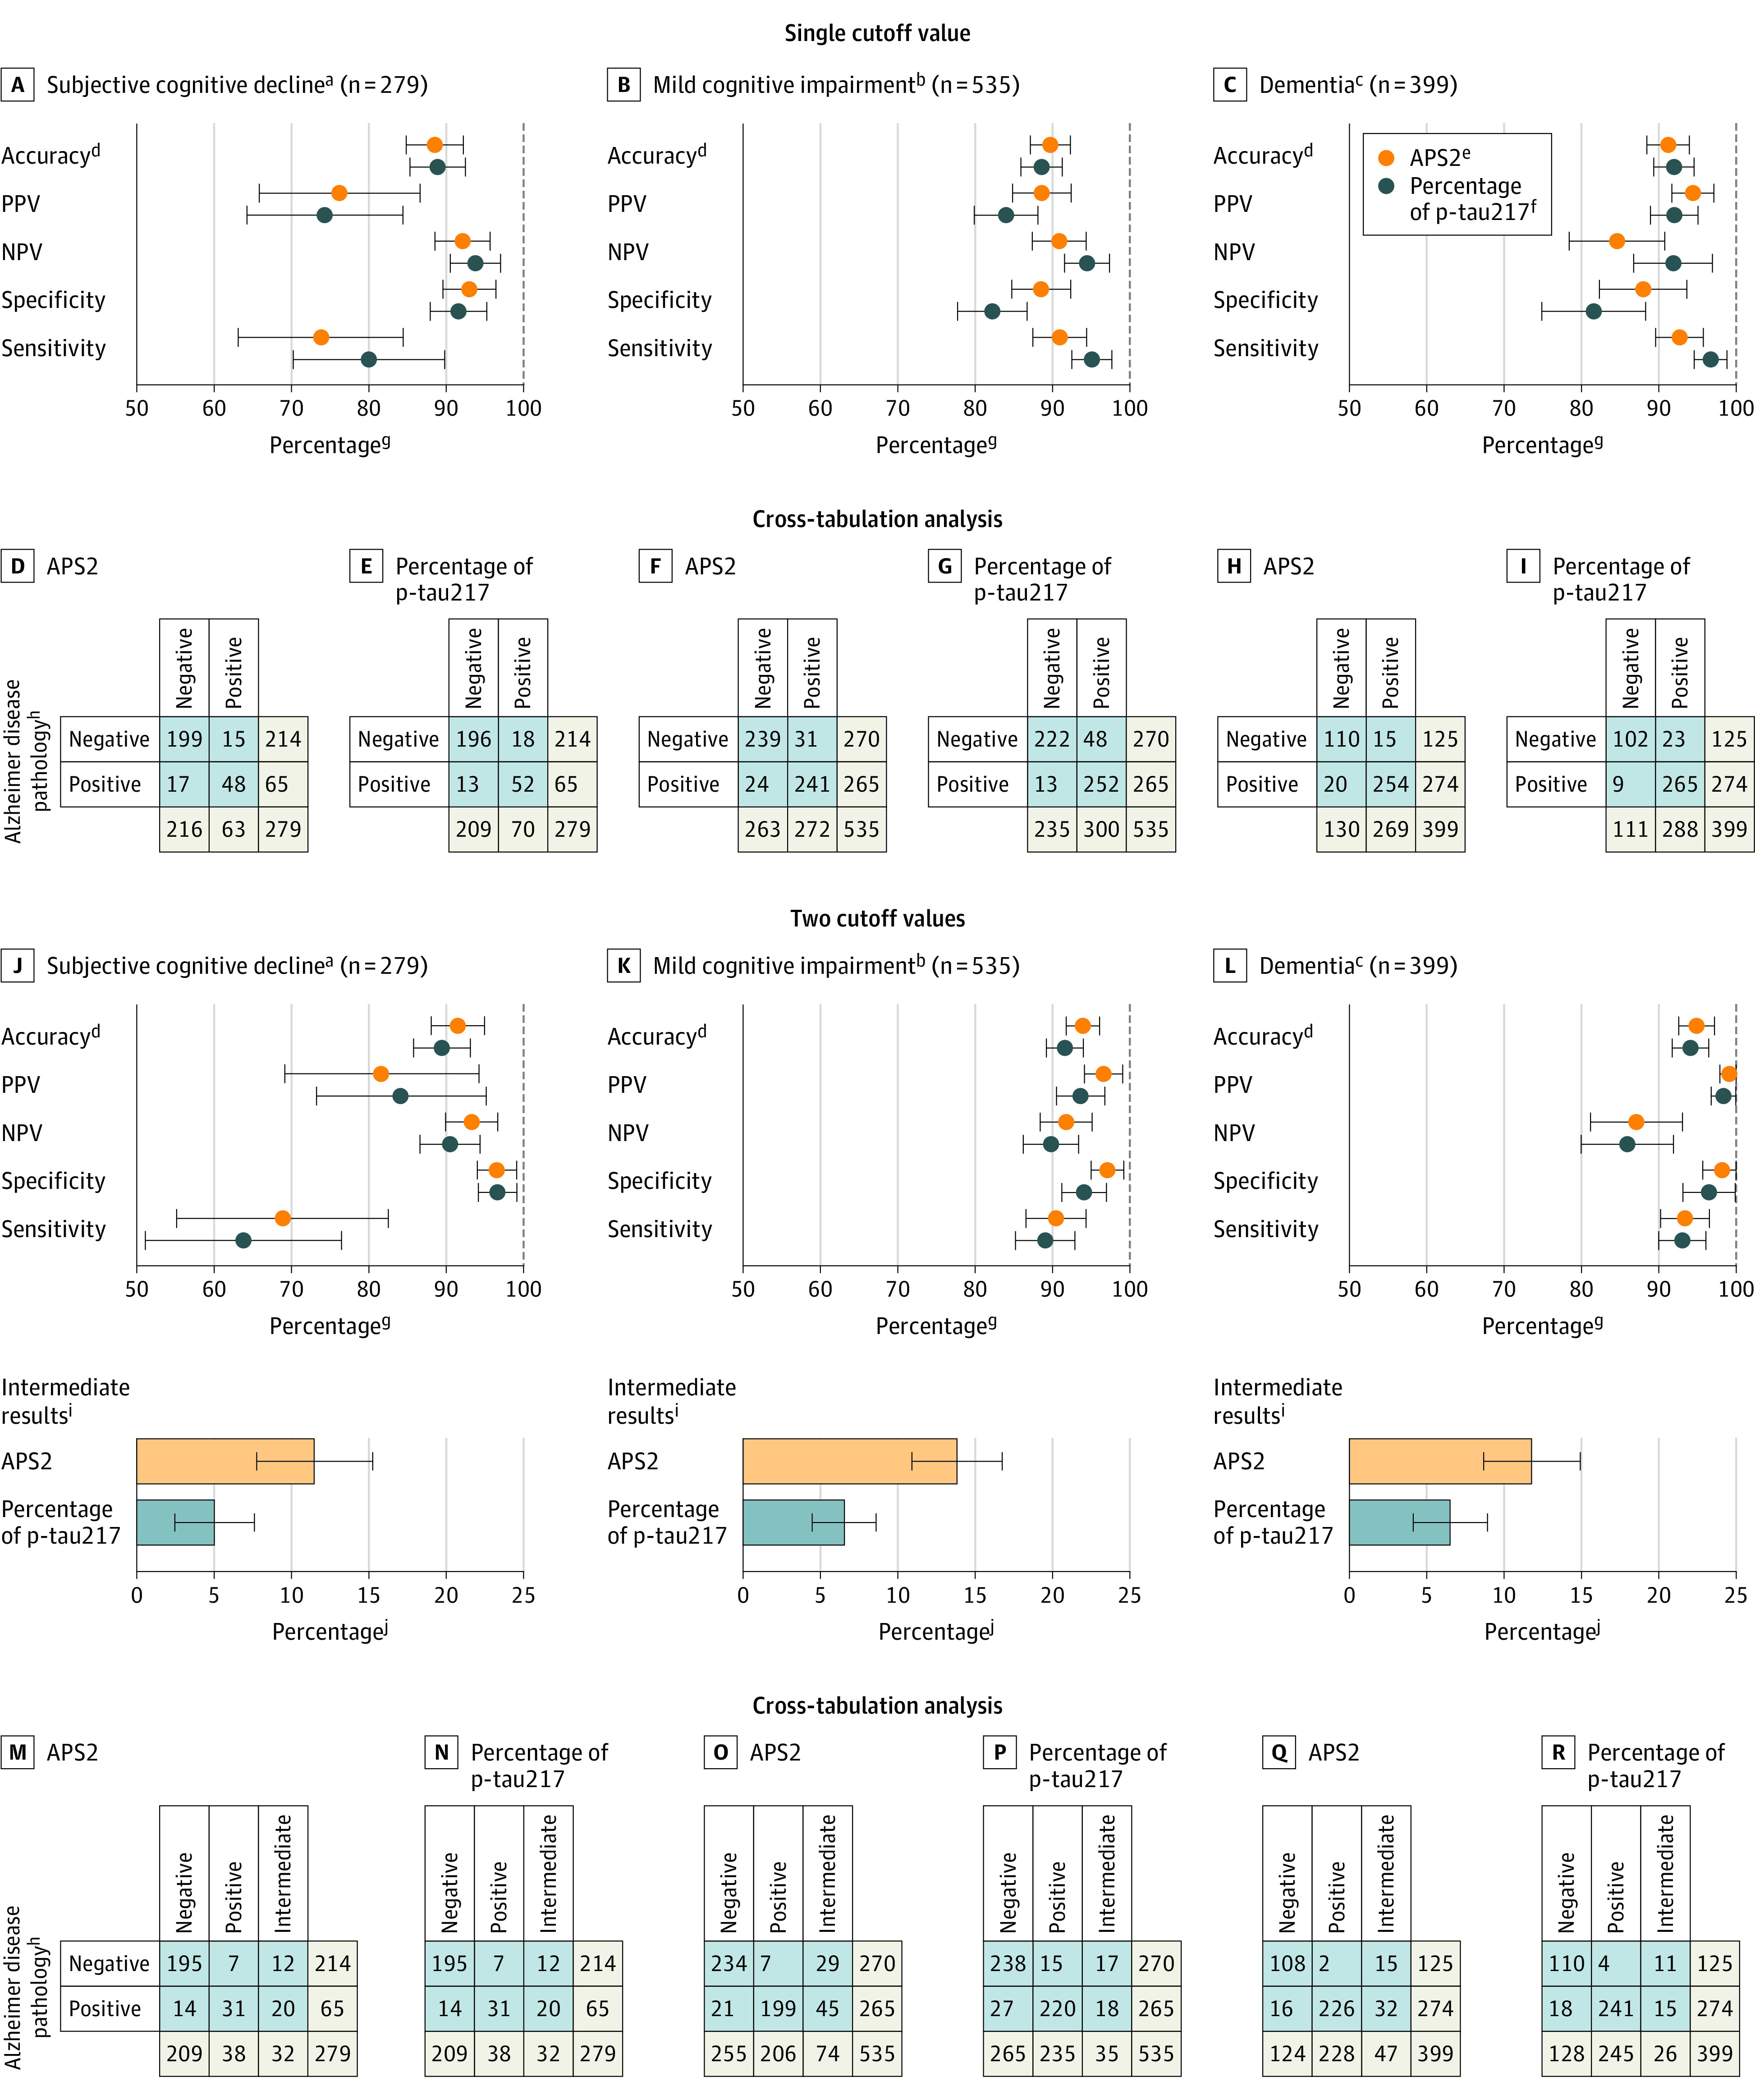
Results: The mean age was 74.2 years (SD, 8.3 years), 48% were women, 23% had subjective cognitive decline, 44% had mild cognitive impairment, and 33% had dementia. In both the primary care and secondary care assessments, 50% of patients had AD pathology. When the plasma samples were analyzed in a single batch in the primary care cohort, the AUC was 0.97 (95% CI, 0.95-0.99) when the APS2 was used, the PPV was 91% (95% CI, 87%-96%), and the NPV was 92% (95% CI, 87%-96%); in the secondary care cohort, the AUC was 0.96 (95% CI, 0.94-0.98) when the APS2 was used, the PPV was 88% (95% CI, 83%-93%), and the NPV was 87% (95% CI, 82%-93%). When the plasma samples were analyzed prospectively (biweekly) in the primary care cohort, the AUC was 0.96 (95% CI, 0.94-0.98) when the APS2 was used, the PPV was 88% (95% CI, 81%-94%), and the NPV was 90% (95% CI, 84%-96%); in the secondary care cohort, the AUC was 0.97 (95% CI, 0.95-0.98) when the APS2 was used, the PPV was 91% (95% CI, 87%-95%), and the NPV was 91% (95% CI, 87%-95%). The diagnostic accuracy was high in the 4 cohorts (range, 88%-92%). Primary care physicians had a diagnostic accuracy of 61% (95% CI, 53%-69%) for identifying clinical AD after clinical examination, cognitive testing, and a computed tomographic scan vs 91% (95% CI, 86%-96%) using the APS2. Dementia specialists had a diagnostic accuracy of 73% (95% CI, 68%-79%) vs 91% (95% CI, 88%-95%) using the APS2. In the overall population, the diagnostic accuracy using the APS2 (90% [95% CI, 88%-92%]) was not different from the diagnostic accuracy using the percentage of p-tau217 alone (90% [95% CI, 88%-91%]).

Conclusions and relevance: The APS2 and percentage of p-tau217 alone had high diagnostic accuracy for identifying AD among individuals with cognitive symptoms in primary and secondary care using predefined cutoff values. Future studies should evaluate how the use of blood tests for these biomarkers influences clinical care.


Conflict of interest statement

Conflict of Interest Disclosures: Dr Palmqvist reported receiving institutional research support from ki Elements, Alzheimer’s Drug Discovery Foundation, and Avid Radiopharmaceuticals and receiving consultancy or speaker fees from Bioartic, Biogen, Esai, Eli Lilly, and Roche. Dr Schindler reported receiving personal fees from Eisai for serving on advisory boards and that her institution (Washington University) has a partial ownership interest in C2N Diagnostics; however, she has no personal financial involvement with C2N Diagnostics and will not receive any compensation. Dr Smith reported receiving personal fees from Hoffmann-La Roche Ltd. Dr Ossenkoppele reported receiving institutional research support from the European Research Council, ZonMw, Nederlandse Organisatie voor Wetenschappelijk Onderzoek, the National Institutes of Health, the Alzheimer Association, Alzheimer Nederland, Stichting Dioraphte, the Cure Alzheimer’s Fund, Health Holland, ERA PerMed, Alzheimerfonden, Hjarnfonden, Avid Radiopharmaceuticals, Janssen, Roche, Quanterix, and Optina Diagnostics; receiving speaking fees from GE Healthcare; and serving as an advisory board member for Asceneuron and as a steering committee member for Bristol Myers Squibb. Drs West, Monane, Verghese, and Braunstein reported being salaried employees or consultants for C2N Diagnostics and receiving compensation from the company in the form of a salary or equity. Dr Blennow reported serving as a consultant or on advisory boards for AbbVie, AC Immune, Acumen, ALZPath, AriBio, BioArctic, Biogen, Eisai, Lilly, Moleac Pte Ltd, Neurimmune, Novartis, Ono Pharma, Prothena, Roche Diagnostics, and Siemens Healthineers; serving on data monitoring committees for Julius Clinical and Novartis; receiving speaking fees for lectures, educational materials, or educational programs from AC Immune, Biogen, Celdara Medical, Eisai, and Roche Diagnostics; and being a cofounder of Brain Biomarker Solutions, which is a part of the GU Ventures Incubator Program. Dr Hansson reported receiving personal fees from AC Immune, Alzpath, BioArctic, Biogen, Cerveau, Eisai, Eli Lilly, Fujirebio, Roche, Bristol Myers Squibb, Merck, Novartis, Novo Nordisk, Roche, Sanofi, and Siemens and receiving institutional research support from ADx, AVID Radiopharmaceuticals, Biogen, Eli Lilly, Eisai, Fujirebio, GE Healthcare, Pfizer, and Roche. No other disclosures were reported.

Figures

Figure 1.
Figure 1.. Performance Comparison of the Blood Tests Using the 1 Cutoff-Value Approach Along With Presence of Alzheimer Disease Pathology as an Outcome
APS2 indicates amyloid probability score 2; NPV negative predictive value; PPV, positive predictive value. The error bars indicate the 95% CIs. The detailed results for A-D appear in eTable 16 in Supplement 1. Cross-tabulation analyses are shown for secondary care (single-batch analysis) in E and I, for primary care (single-batch analysis) in F and J, for secondary care (prospective analyses) in G and K, and for primary care (prospective analyses) in H and L. aCorrectly classified participants. bThe percentage of plasma phosphorylated tau 217 (p-tau217) combined with the β-amyloid 42 and β-amyloid 40 (Aβ42:Aβ40) plasma ratio in a predefined logistic regression model. The cutoff value was 36. cThe ratio of plasma p-tau217 relative to non–p-tau217 multiplied by 100. The cutoff value was 3.26. dPercentage of accuracy, PPV, NPV, specificity, or sensitivity. eDefined as having cerebrospinal fluid–positive results for Aβ42:Aβ40 ratio (≤0.072) and p-tau217 (>11.42 pg/mL). For participants who could not undergo lumbar puncture, Alzheimer disease pathology was based on positron emission tomographic–positive results for Aβ.
Figure 2.
Figure 2.. Performance Comparison of the Blood Tests Using the 2 Cutoff-Value Approach Along With Presence of Alzheimer Disease Pathology as an Outcome
APS2 indicates amyloid probability score 2; NPV, negative predictive value for 2 cutoff values; PPV, positive predictive value for 2 cutoff values. Error bars indicate the 95% CIs. The detailed results for A-D appear in eTable 17 in Supplement 1. Cross-tabulation analyses are shown for secondary care (single-batch analysis) in E and I, for primary care (single-batch analysis) in F and J, for secondary care (prospective analyses) in G and K, and for primary care (prospective analyses) in H and L. aCorrectly classified participants. bThe percentage of plasma phosphorylated tau 217 (p-tau217) combined with the β-amyloid 42 and β-amyloid 40 (Aβ42:Aβ40) plasma ratio in a predefined logistic regression model. The cutoff values were 31 (lower) and 62 (upper). cThe ratio of plasma p-tau217 relative to non–p-tau217 multiplied by 100. The cutoff values were 3.93 (lower) and 5.18 (upper). dPercentage of accuracy, PPV, NPV, specificity, or sensitivity. eRefers to participants between the upper and lower cutoff values (who were not included when calculating diagnostic accuracy). fPercentage of intermediate results using the APS2 or percentage of p-tau217 alone. gDefined as having cerebrospinal fluid–positive results for Aβ42:Aβ40 ratio (≤0.072) and p-tau217 (>11.42 pg/mL). For participants who could not undergo lumbar puncture, Alzheimer disease pathology was based on positron emission tomographic–positive results for Aβ.
Figure 3.
Figure 3.. Comparison Between the Diagnostic Performance of the Physicians and the Blood Tests Using the 1 Cutoff-Value Approach Along With Presence of Alzheimer Disease Pathology as an Outcome
Data are from a subpopulation of patients with available physician questionnaires. APS2 indicates amyloid probability score 2; NPV, negative predictive value; PPV, positive predictive value. Error bars indicate the 95% CIs. The detailed results for A-D appear in eTable 18 in Supplement 1. Cross-tabulation analyses are shown for secondary care (prospective analyses) in C, D, and E and for primary care (prospective analyses) in F, G, and H. The comparisons between the diagnostic accuracy of physicians and the use of blood biomarkers with 2 cutoff values and with clinical Alzheimer disease as an outcome appear in eFigures 3-4 in Supplement 1. aThe percentage of plasma phosphorylated tau 217 (p-tau217) combined with the β-amyloid 42 and β-amyloid 40 (Aβ42:Aβ40) plasma ratio in a predefined logistic regression model. The cutoff value was 36. bThe ratio of plasma p-tau217 relative to non–p-tau217 multiplied by 100. The cutoff value was 3.26. cPhysicians were asked if they thought their patient has Alzheimer disease pathology in the brain after the standard investigation, but prior to seeing any Alzheimer disease biomarker result (plasma sample, cerebrospinal fluid, or positron emission tomographic [PET] scan). dCorrectly classified participants. ePercentage of accuracy, PPV, NPV, specificity, or sensitivity. fDefined as having cerebrospinal fluid–positive results for Aβ42:Aβ40 ratio (≤0.072) and p-tau217 (>11.42 pg/mL). For participants who could not undergo lumbar puncture, Alzheimer disease pathology was based on positive results for Aβ using PET.
Figure 4.
Figure 4.. Performance of the Blood Tests in Different Cognitive Stages in Pooled Data Along With Alzheimer Disease Pathology as an Outcome
Error bars indicate 95% CIs. The detailed results for A-C and J-L appear in eTables 19 and 20, respectively, in Supplement 1. aDid not fulfill criteria for mild cognitive impairment or dementia. bCognitive symptoms and abnormal performance on cognitive testing. cClassified according to the DSM-5. dCorrectly classified participants. eThe percentage of plasma phosphorylated tau 217 (p-tau217) combined with the β-amyloid 42 and 40 (Aβ42:Aβ40) plasma ratio (cutoff value: 36). fPlasma p-tau217 to non–p-tau217 × 100 (cutoff value: 3.26). gPercentage of accuracy, PPV, NPV, specificity, or sensitivity. hCerebrospinal fluid–positive results for Aβ42:Aβ40 ratio (≤0.072) and p-tau217 (>11.42 pg/mL) or based on positron emission tomographic results. iBetween the cutoff values (not included in diagnostic accuracy calculation). jPercentage of intermediate results using APS2 or percentage of p-tau217.
Figure 5.
Figure 5.. Receiver Operating Characteristic (ROC) Curve Analysis of the Blood Tests Along With Alzheimer Disease Pathology as an Outcome
Presence of Alzheimer disease pathology was defined as having cerebrospinal fluid–positive results for β-amyloid 42 and β-amyloid 40 (Aβ42:Aβ40) ratio (≤0.072) and plasma phosphorylated tau 217 (p-tau217; >11.42 pg/mL). For participants who could not undergo lumbar puncture, Alzheimer disease pathology was based on positron emission tomographic–positive results for Aβ. APS2 indicates amyloid probability score 2; AUC, area under the curve. aThe percentage of p-tau217 combined with the Aβ42:Aβ40 plasma ratio in a predefined logistic regression model. bThe ratio of plasma p-tau217 relative to non–p-tau217 multiplied by 100.

Comment in

Comment on

References

    1. Alzheimer's Association . 2021 Alzheimer’s disease facts and figures. Alzheimers Dement. 2021;17(3):327-406. - PubMed
    1. Drabo EF, Barthold D, Joyce G, et al. . Longitudinal analysis of dementia diagnosis and specialty care among racially diverse Medicare beneficiaries. Alzheimers Dement. 2019;15(11):1402-1411. - PMC - PubMed
    1. Hansson O. Biomarkers for neurodegenerative diseases. Nat Med. 2021;27(6):954-963. - PubMed
    1. Rabinovici GD, Gatsonis C, Apgar C, et al. . Association of amyloid positron emission tomography with subsequent change in clinical management among medicare beneficiaries with mild cognitive impairment or dementia. JAMA. 2019;321(13):1286-1294. - PMC - PubMed
    1. van Dyck CH, Swanson CJ, Aisen P, et al. . Lecanemab in early Alzheimer’s disease. N Engl J Med. 2023;388(1):9-21. - PubMed

Publication types