. 2024 Sep 20;5(3):103217.
doi: 10.1016/j.xpro.2024.103217. Epub 2024 Jul 27.

Protocol for differentiation of monocytes and macrophages from human induced pluripotent stem cells

Affiliations

Protocol for differentiation of monocytes and macrophages from human induced pluripotent stem cells

Kevin Emmerich et al. STAR Protoc. .

Abstract

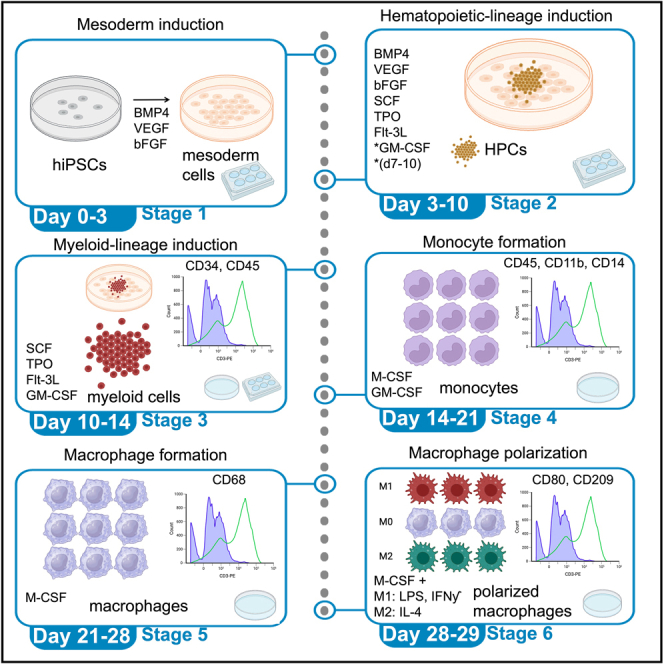
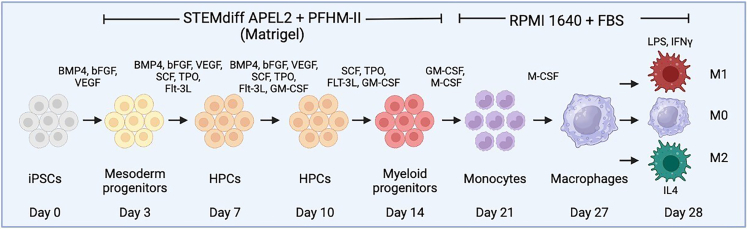
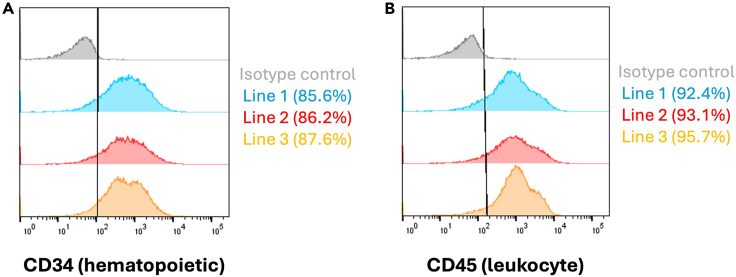
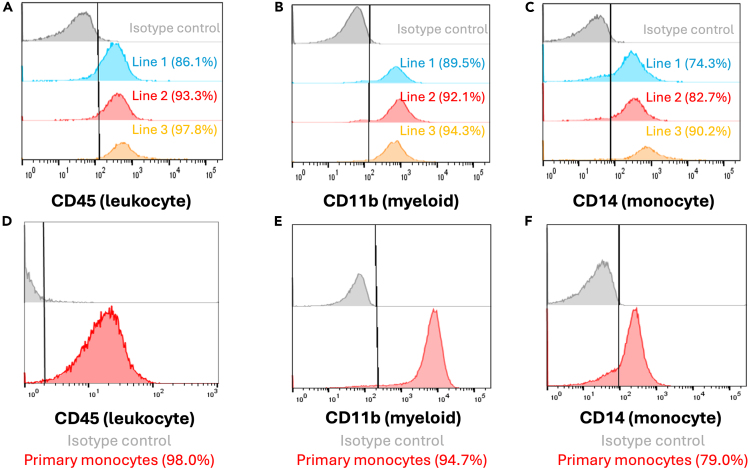
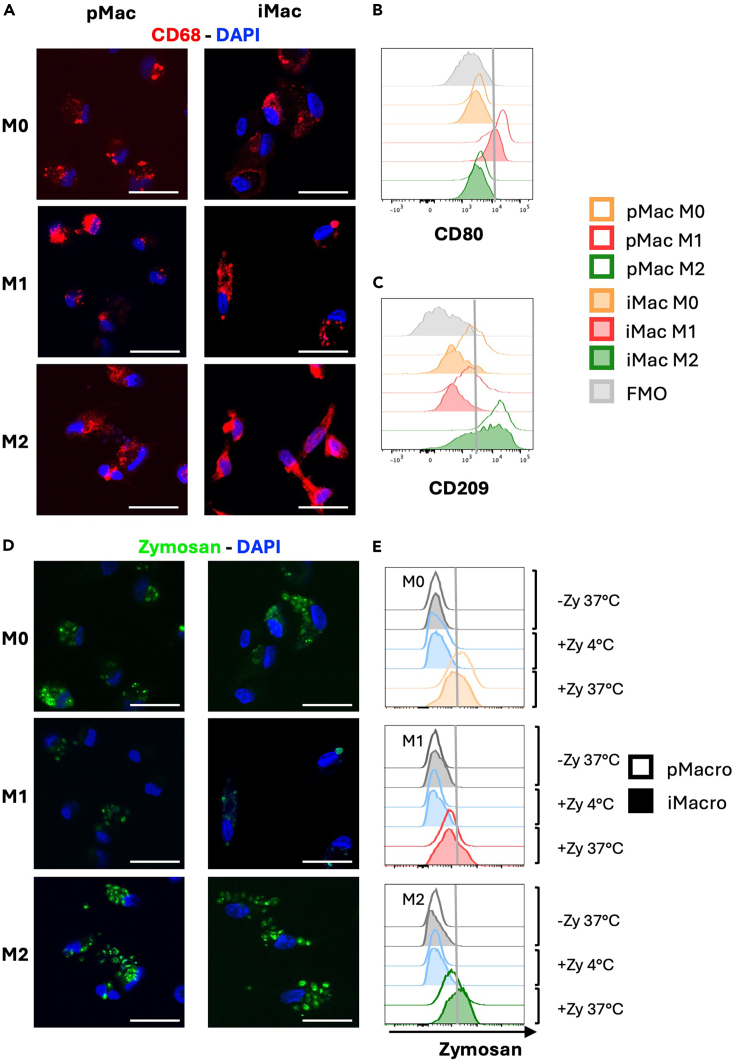
Study of disease-relevant immune cells, namely monocytes and macrophages, is limited based on availability of primary tissue, a limitation that can be remedied using human induced pluripotent stem cell (hiPSC) technology. Here, we present a protocol for differentiation of monocytes and macrophages from hiPSCs. We describe steps for hiPSC maintenance, mesoderm lineage induction, hematopoietic progenitor cells (HPCs) commitment and expansion, and myeloid lineage induction. We then detail procedures for monocyte formation and functional macrophage formation and polarization. For complete details on the use and execution of this protocol, please refer to Chen et al.1.

Keywords: Cell Biology; Cell Differentiation; Flow Cytometry; Immunology; Microscopy; Stem Cells.


Conflict of interest statement

Declaration of interests The authors declare no competing interests.

Figures

None
Graphical abstract
Figure 1
Figure 1
Summary of differentiation protocol hiPSCs are passaged to form small colonies, the next day at day 0, treatment with the first growth factor combination is induced from days 0–3 to form mesoderm progenitor cells. From days 3–7, new growth factors are introduced to form hematopoietic progenitor cells (HPCs). From days 7–10 new growth factors are introduced to enhance HPC proliferation. From days 10–14 new growth factors are introduced to promote development of myeloid progenitor cells that float on top of the monolayer culture. Floating myeloid cells are replated on low-attached plates and treated with growth factors from day 14–21 to enhance production of monocytes and other mature myeloid lineage cells. Monocytes can be further cultured to resting M0 macrophages from days 21–28 and these cells can be polarized to classical M1 and M2 states by additional growth factor treatment for 24 h. Created with license from BioRender.
Figure 3
Figure 3
Examples of cell morphology through monocyte formation (A) Day 0 hiPSCs following passaging one day before. (B) Day 2: cells during mesoderm induction. (C) Day 5 cells during HPC induction, monolayer culture often grows rapidly and may reach near full confluency at this stage. (D) Day 9: floating HPCs on top of monolayer culture. (E) Day 14: myeloid progenitor cells at day 14 derived from replated floating HPCs. (F) Day 21: mature myeloid cells with noteworthy cell size increase from prior stages. Scale bar = 200 μm and is applicable to all images.
Figure 2
Figure 2
Healthy and unhealthy hiPSC colony examples (A) Example of healthy hiPSCs at typical confluence for cell passaging prior to differentiation. (B) Example of unhealthy hiPSCs colonies with evidence of auto-differentiation. Scale bar = 200 μm and is applicable to all images.
Figure 4
Figure 4
Phenotypic assessment of hiPSC-derived HPCs (A) Representative overlay showing expression of hematopoietic progenitor cell marker CD34 across 3 genetically independent hiPSC-derived cells lines at day 14 in floating HPCs (Average = 86.5%, N = 3). (B) Representative overlay showing expression of leukocyte marker CD45 across 3 genetically independent hiPSC-derived cells lines at day 14 in floating HPCs (Average = 93.7%, N = 3). Expression from staining with the appropriate isotype antibodies is shown as negative control for all groups (gray).
Figure 5
Figure 5
Phenotypic assessment of hiPSC-derived and primary monocytes (A) Representative overlay showing expression of leukocyte marker CD45 across 3 genetically independent hiPSC-derived cells lines at day 14 in monocytes (Average = 92.4%, N = 3). (B) Representative overlay showing expression of mature myeloid cell marker CD11b across 3 genetically independent hiPSC-derived cells lines at day 14 in monocytes (Average = 92.0%, N = 3). (C) Representative overlay showing expression of monocyte cell marker CD14 across 3 genetically independent hiPSC-derived cells lines at day 14 in monocytes (Average = 82.4%, N = 3). (D–F) Expression of same markers from (A-C) in primary PBMC-derived monocytes. Expression from staining with the appropriate isotype antibodies is shown as negative control for all groups (gray).
Figure 6
Figure 6
Phenotypic and functional assessment of hiPSC-derived and primary macrophages (A) Representative images of immunofluorescence CD68 staining observed in primary macrophages (pMac, n = 5; first column) and iPSC-derived macrophages (iMac, n = 3; second column) polarized in M0, M1, and M2 macrophages (First, second and third row, respectively). Cells were stained for CD68 (red) and with DAPI for nuclear staining (blue). (B and C) Representative overlay showing the expression of the M1 marker CD80 (B) and the M2 marker CD209 (C) on primary macrophages (pMac, n = 4; empty histograms) and iPSC-derived macrophages (iMac, n = 3; filled histograms) polarized in M0 (orange), M1 (red), and M2 (green) macrophages. The fluorescence minus one (FMO) used as negative control is shown (gray, filled histogram). (D-E) Phagocytic ability of M0, M1 and M2 primary macrophages (pMac) and iPSC-derived macrophages (iMac) was evaluated by using pHrodo Green Zymosan A Bioparticles and was assessed by flow cytometry and confocal microscopy. (D) Representative images showing phagocytized Zymosan particles (in green) in primary macrophages (pMac, n = 3; first column) and iMac (iMac-Con, n = 3; second column) polarized in M0, M1, and M2 macrophages (First, second and third row, respectively). Nuclei were stained with DAPI (blue). (E) Representative overlay showing the Zymosan phagocytosis in primary macrophages (pMac, n = 4; empty histograms) and iPSC-derived macrophages (iMac, n = 3; filled histograms) polarized in M0 (in orange, first graph), M1 (in red, second graph), and M2 (in green, third graph) macrophages. Samples incubated without Zymosan (gray histograms) and with Zymosan incubated at 4°C (light blue histograms), which were used as negative controls, are shown. Scale bars = 25 μm and are applicable to all images.

References

    1. Chen G., Calcaterra F., Ma Y., Ping X., Pontarini E., Yang D., Oriolo F., Yu Z., Cancellara A., Mikulak J., et al. Derived myeloid lineage induced pluripotent stem as a platform to study human C-C chemokine receptor type 5Δ32 homozygotes. iScience. 2023;26 doi: 10.1016/j.isci.2023.108331. - DOI - PMC - PubMed
    1. Lambert C., Preijers F., Yanikkaya Demirel G., Sack U. Monocytes and macrophages in flow: an ESCCA initiative on advanced analyses of monocyte lineage using flow cytometry. Cytometry B Clin. Cytom. 2017;92:180–188. doi: 10.1002/cyto.b.21280. - DOI - PubMed
    1. Jeong S., Chang H., Hong S.H. Protocol for differentiation of functional macrophages from human induced pluripotent stem cells. STAR Protoc. 2024;5 doi: 10.1016/j.xpro.2024.102925. - DOI - PMC - PubMed
    1. Michlewska S., Dransfield I., Megson I.L., Rossi A.G. Macrophage phagocytosis of apoptotic neutrophils is critically regulated by the opposing actions of pro-inflammatory and anti-inflammatory agents: key role for TNF-alpha. FASEB J. 2009;23:844–854. doi: 10.1096/fj.08-121228. - DOI - PubMed

Publication types

MeSH terms