. 2024 Aug 27;43(8):114495.
doi: 10.1016/j.celrep.2024.114495. Epub 2024 Jul 26.

Movement-related increases in subthalamic activity optimize locomotion

Affiliations

Movement-related increases in subthalamic activity optimize locomotion

Joshua W Callahan et al. Cell Rep. .

Abstract

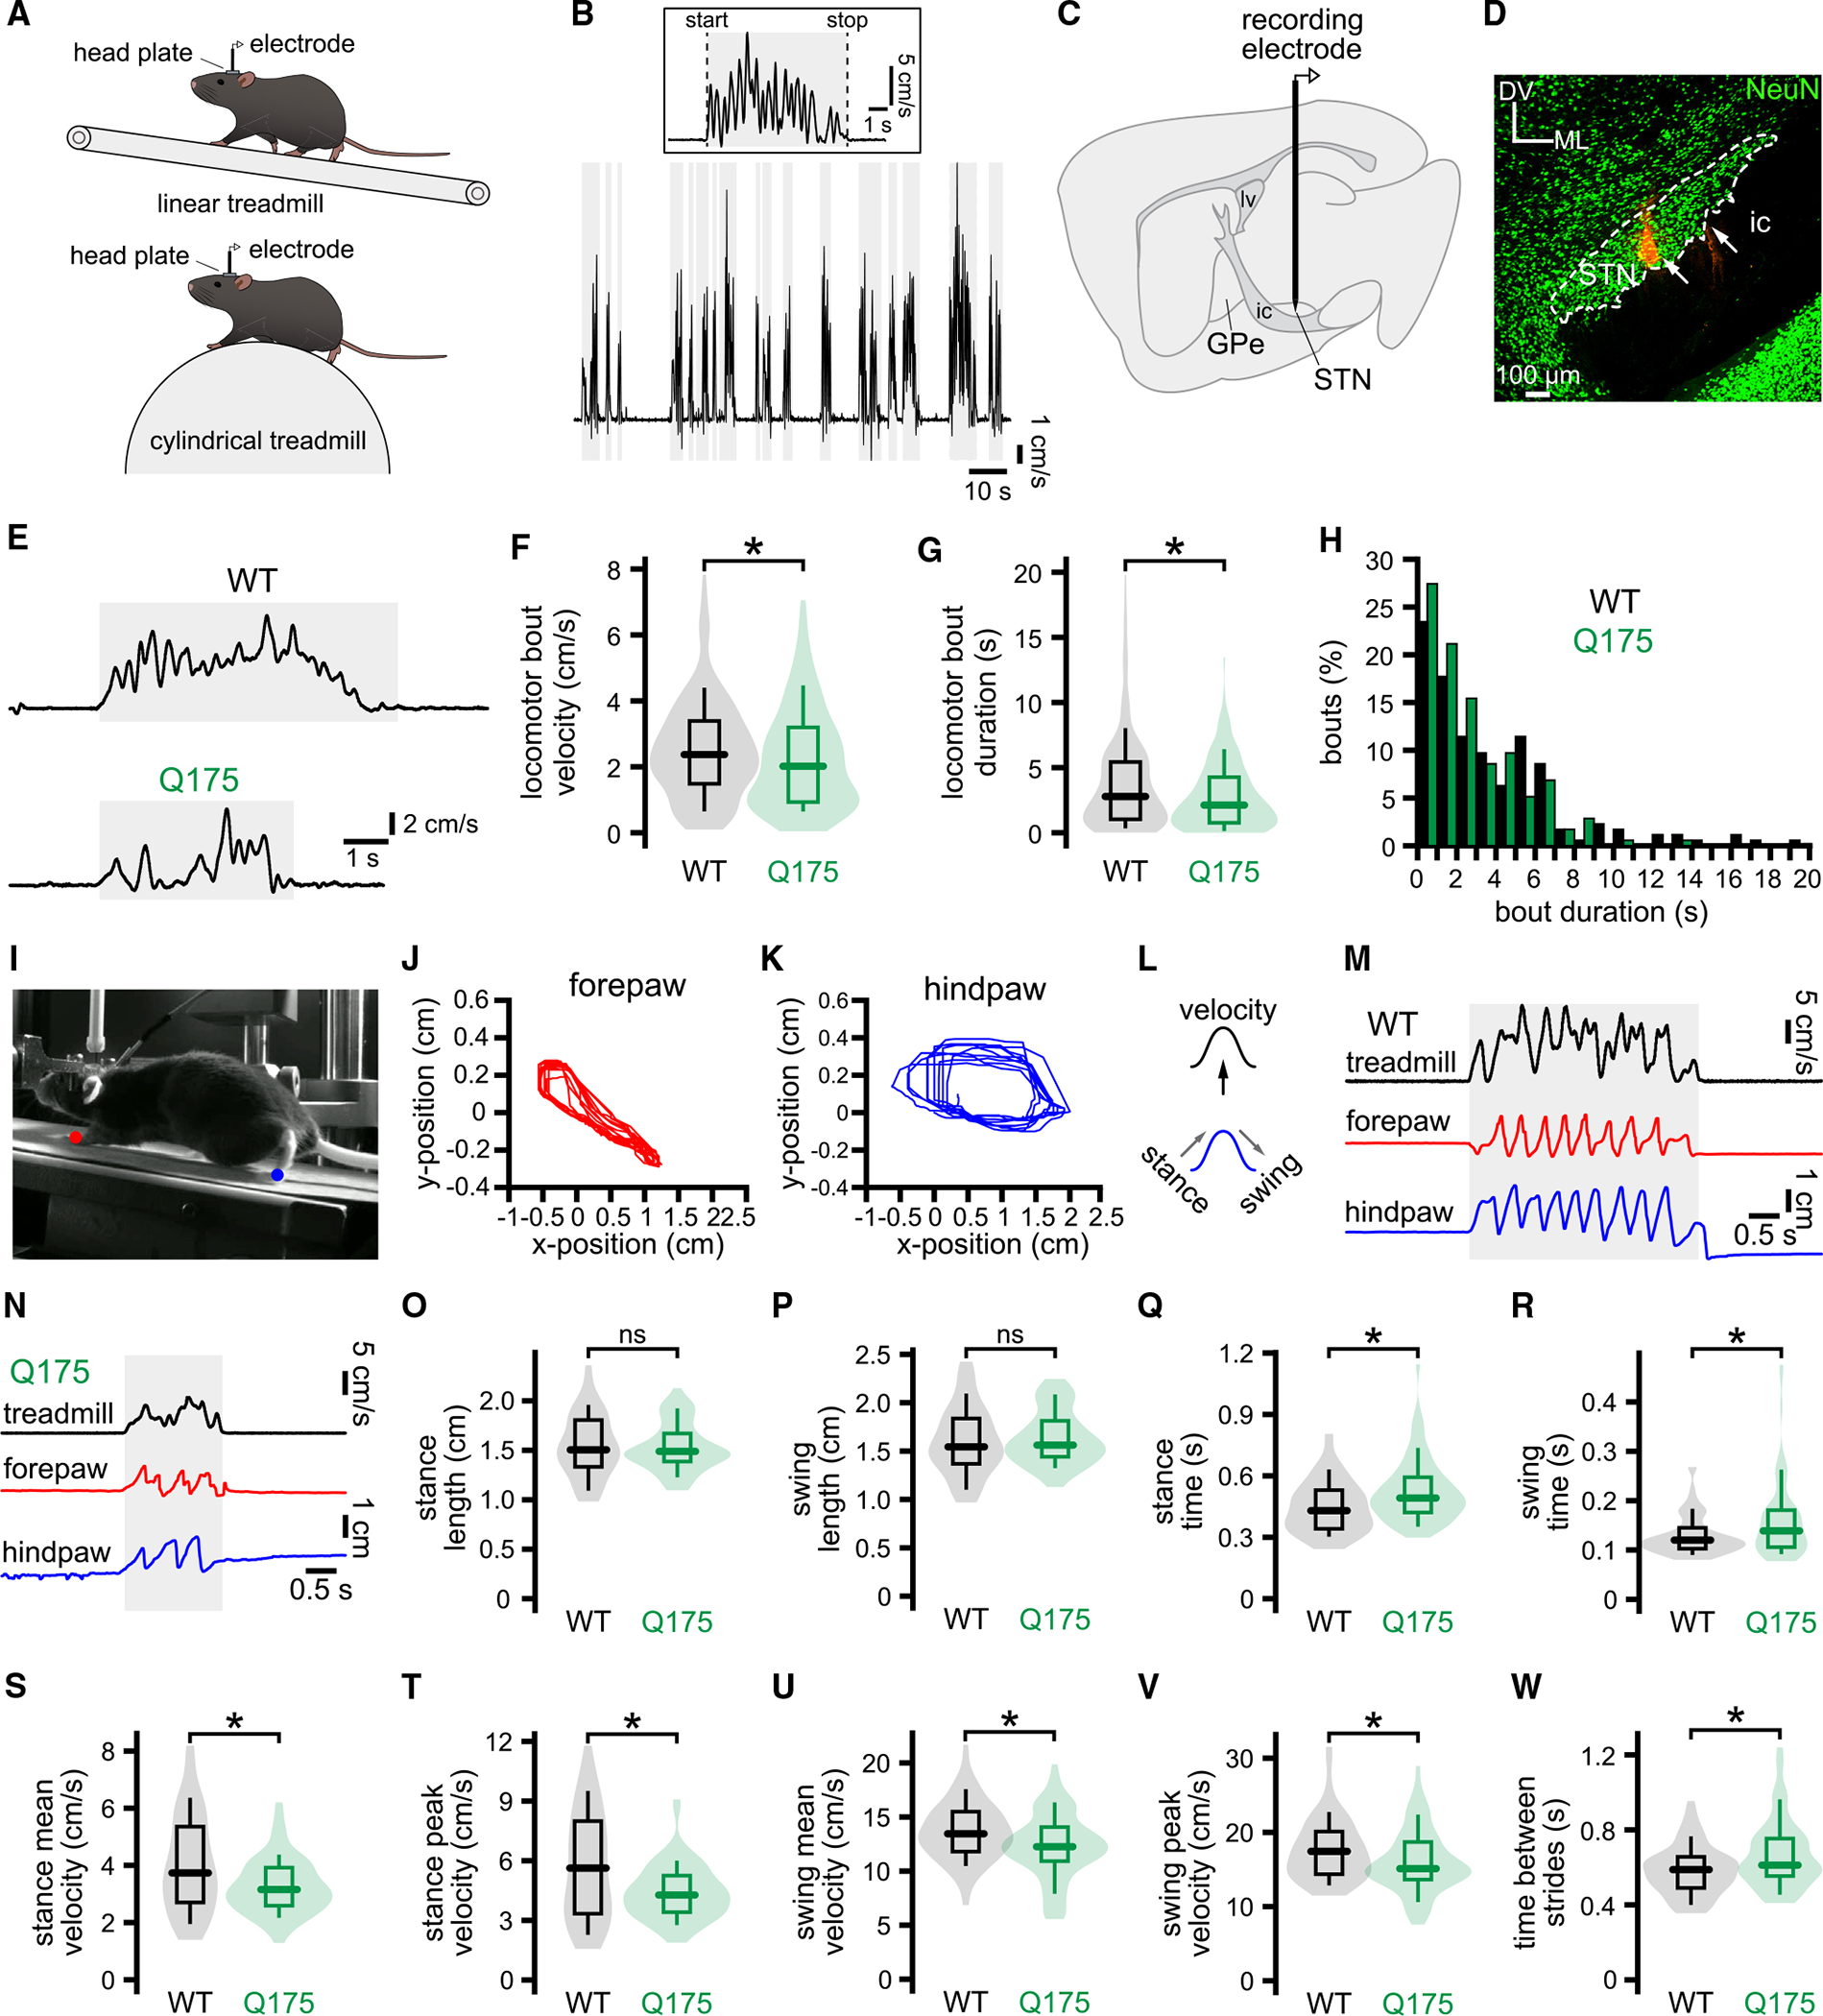
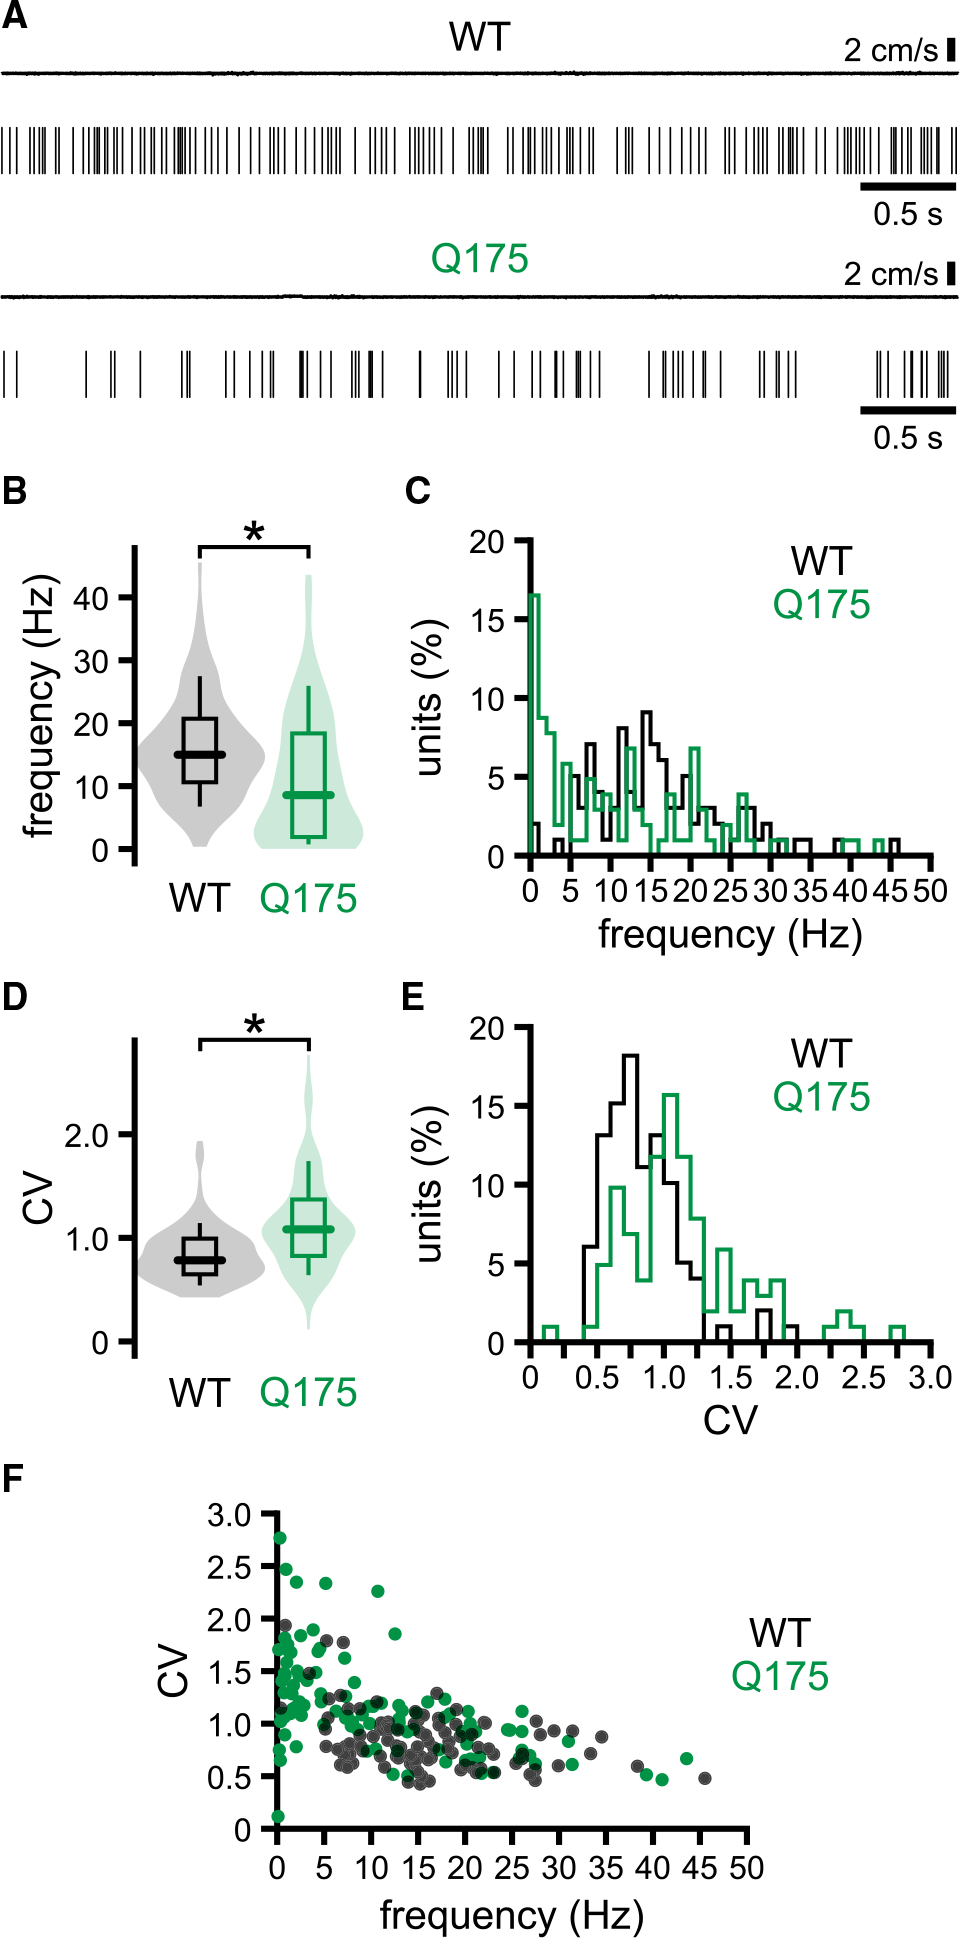
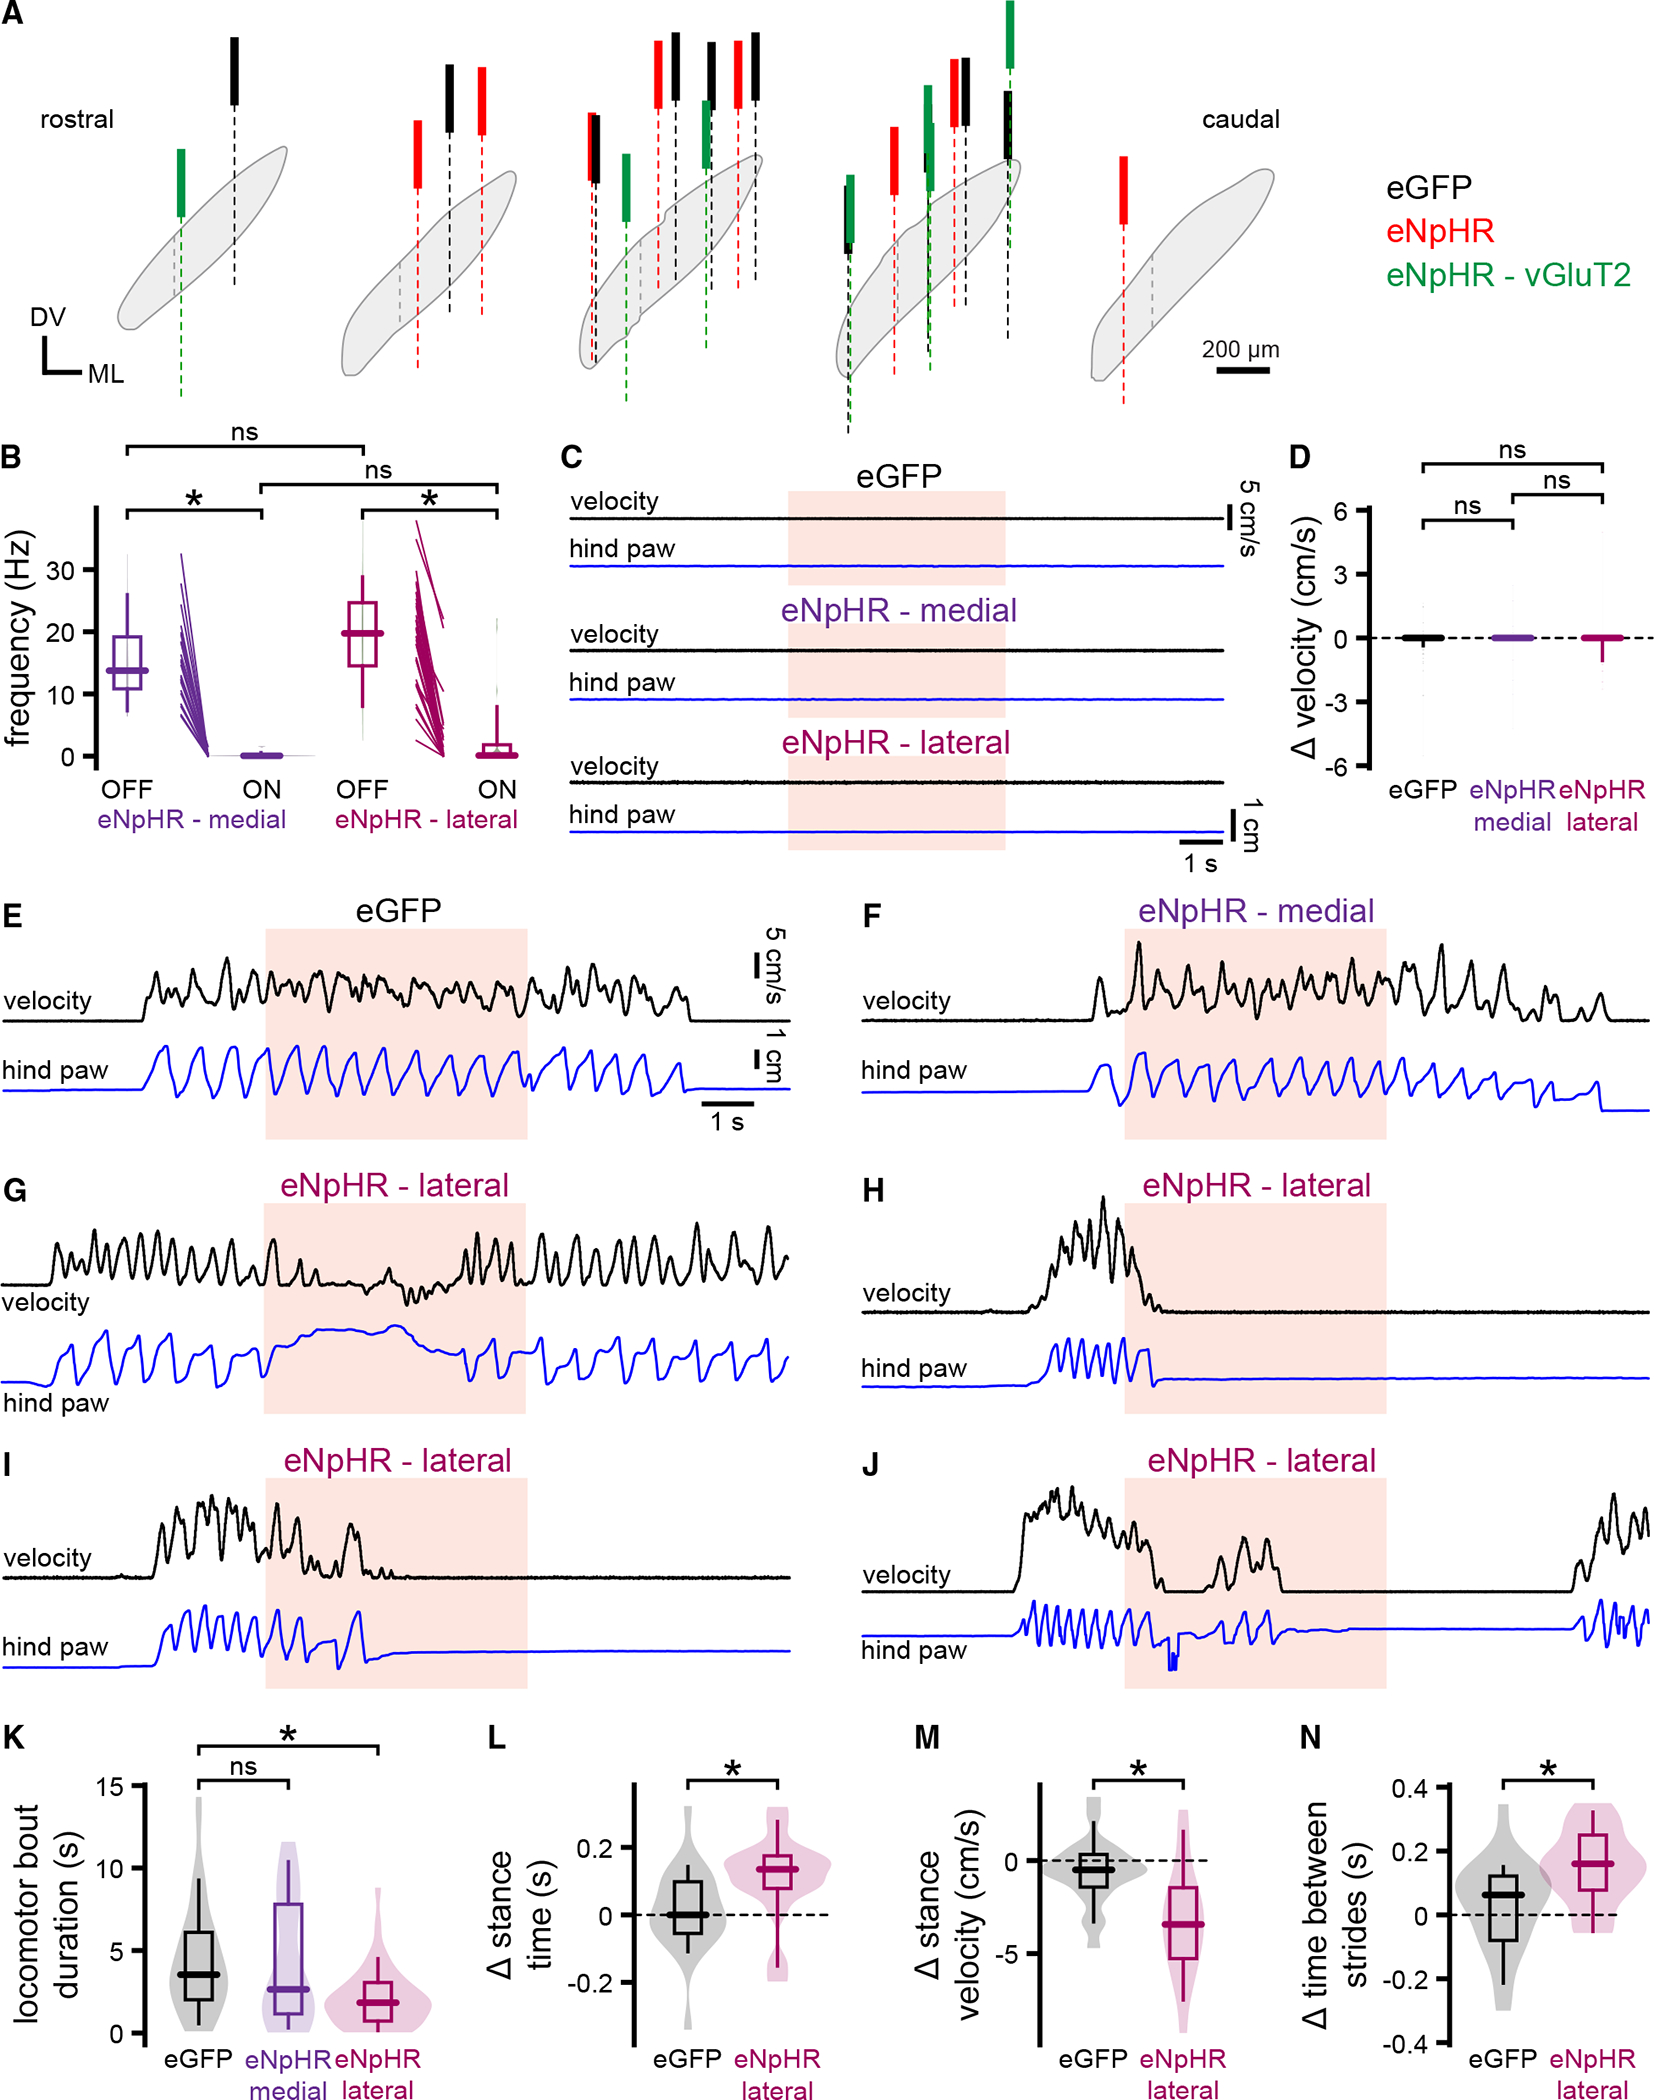
The subthalamic nucleus (STN) is traditionally thought to restrict movement. Lesion or prolonged STN inhibition increases movement vigor and propensity, while optogenetic excitation has opposing effects. However, STN neurons often exhibit movement-related increases in firing. To address this paradox, STN activity was recorded and manipulated in head-fixed mice at rest and during self-initiated and self-paced treadmill locomotion. We found that (1) most STN neurons (type 1) exhibit locomotion-dependent increases in activity, with half firing preferentially during the propulsive phase of the contralateral locomotor cycle; (2) a minority of STN neurons exhibit dips in activity or are uncorrelated with movement; (3) brief optogenetic inhibition of the lateral STN (where type 1 neurons are concentrated) slows and prematurely terminates locomotion; and (4) in Q175 Huntington's disease mice, abnormally brief, low-velocity locomotion is associated with type 1 hypoactivity. Together, these data argue that movement-related increases in STN activity contribute to optimal locomotor performance.

Keywords: CP: Neuroscience; Huntington’s disease; Parkinson’s disease; action execution; basal ganglia; deep brain stimulation; gait; hyperdirect pathway; indirect pathway; motor control; neuromodulation.


Conflict of interest statement

Declaration of interests The authors declare no competing interests.

Figures

Figure 1.
Figure 1.. Self-initiated locomotion is dysregulated in Q175 HD mice
(A) STN encoding of self-initiated locomotion was assessed in head-fixed mice that were habituated to a self-paced linear or cylindrical treadmill. (B) A treadmill velocity encoder was used to detect periods of rest and bouts of self-initiated treadmill locomotion. (C) STN activity was recorded with a 32- or 64-channel silicon electrode/optrode. (D) The locations of STN recordings were assessed histologically using DiI red labeling (white arrows) and immunohistochemical detection of NeuN (green). The dorsoventral (DV) and mediolateral (ML) axes and internal capsule (ic) are denoted. In some cases, immunohistochemical detection of IBA1 was used to locate electrode tracks instead of DiI red (not illustrated). (E–H) Self-initiated treadmill locomotor bouts were shorter in duration and of lower velocity in Q175 HD mice versus WT mice (E, representative treadmill velocity encoder traces; F–H, population data). (I–N) DeepLabCut-based analysis of high-frame-rate digital video was used to track 2D contralateral paw movement in the x and y axes during self-initiated locomotion and rest (I, head-fixed mouse on a linear treadmill, with forepaw [red] and hindpaw [blue] tracking denoted; J and K, x-y coordinates of the forepaws [J, red] and hindpaws [K, blue] during locomotion; L–N, schematized [L] and example relationships of treadmill velocity and x axis displacement of the contralateral paws during treadmill locomotion in WT [M] and Q175 [N] mice). (O–W) X axis kinematics of the contralateral hindpaw in WT and Q175 mice during locomotion. The lengths of the stance and swing phases of locomotion were not significantly different in Q175 and WT mice (O and P). The durations (Q and R) and velocities (S–V) of both the stance and swing phases were longer and lower, respectively, in Q175 versus WT mice. During locomotion, the time between strides was longer in Q175 mice (W). *p < 0.05; ns, not significant.
Figure 2.
Figure 2.. The frequency and precision of STN unit activity are lower in Q175 HD versus WT mice at rest
(A) Representative spike rasters of STN units and associated treadmill velocity encoder records in WT and Q175 mice at rest. (B–F, population data) The mean frequency and precision (coefficient of variation of the interspike interval, CV) of STN activity are lower in resting Q175 mice compared to WT. *p < 0.05.
Figure 3.
Figure 3.. Type 1 STN neurons in WT and Q175 mice exhibit locomotion-associated increases in firing
(A) Locomotion-associated activity of a representative type 1 STN neuron in a WT mouse (upper trace, treadmill velocity; middle trace, spike raster; lower trace, Z score of spikes per 50-ms time bin relative to baseline spike counts). (B) Average firing frequency of the neuron in (A) during the initial rest, pre-locomotion, locomotion, post-locomotion, and subsequent rest periods. (C) Spike frequency-treadmill velocity correlation (blue) versus the correlation after shuffling (orange, mean ± 2 SD). (D) Peak correlation versus Z score for the sample population. (E) The spiking rate of the neuron in (A) varied inconsistently over several cycles of velocity change (a, b, and c; color coded as for A). (F and G) Frequency (F) and Z score (G) population data for type 1 neurons in WT mice. (H) Locomotion-associated activity of a representative type 1 STN neuron in a Q175 mouse (upper trace, treadmill velocity; middle trace, spike raster; lower trace, Z score of spikes per 50-ms time bin relative to baseline spike counts). (I) Average firing frequency of the neuron in (H) during the initial rest, pre-locomotion, locomotion, post-locomotion, and subsequent rest periods. (J) Spike frequency-treadmill velocity correlation (purple) versus the correlation after shuffling (orange, mean ± 2 SD). (K) Peak correlation versus Z score for the sample population. (L) The spiking rate of the neuron in (H) varied inconsistently over several cycles of velocity change (a, b, and c; color coded as for H). (M and N) Frequency (M) and Z score (N) population data for type 1 neurons in Q175 mice. *p < 0.05.
Figure 4.
Figure 4.. The frequencies of resting and locomotion-associated type 1 STN activity are reduced in Q175 mice
(A and B) Population data. The frequency (A) but not Z score (B) of locomotion-associated type 1 STN activity was reduced in Q175 mice. (C and D) Distribution of recorded type 1 STN neurons in WT and Q175 mice. In WT mice, type 1 units were relatively abundant in the dorsolateral two-thirds of the STN compared to the medial third. In the medial third of the STN, type 1 units were more prevalent in Q175 than WT mice. The boundary between the medial third and lateral two-thirds of the STN is denoted by a dashed line. (E–I) A subset of type 1 STN neurons in WT and Q175 mice exhibited firing that was related to the phase of the locomotor cycle (E–H, representative examples; I, population data). (I) The number of spikes during the stance phase of the locomotor cycle was significantly lower in Q175 mice.*p < 0.05; ns, not significant.
Figure 5.
Figure 5.. Type 2 STN neurons in WT and Q175 mice exhibit locomotion-associated decreases in firing
(A) Locomotion-associated activity of a representative type 2 STN neuron in a WT mouse (upper trace, treadmill velocity; middle trace, spike raster; lower trace, Z score of spikes per 50-ms time bin relative to baseline spike counts). (B) Average firing frequency of the neuron in (A) during the initial rest, pre-locomotion, locomotion, post-locomotion, and subsequent rest periods. (C) Spike frequency-treadmill velocity correlation (red) versus the correlation after shuffling (orange, mean ± 2 SD). (D) Peak correlation versus Z score for the sample population. (E) The spiking rate of the neuron in (A) varied inconsistently over several cycles of velocity change (a, b, and c; color coded as for A). (F and G) Frequency (F) and Z score (G) population data for type 2 neurons in WT mice. (H) Locomotion-associated activity of a representative type 2 STN neuron in a Q175 mouse (upper trace, treadmill velocity; middle trace, spike raster; lower trace, Z score of spikes per 50-ms time bin relative to baseline spike counts). (I) Average firing frequency of the neuron in (H) during the initial rest, pre-locomotion, locomotion, post-locomotion, and subsequent rest periods. (J) Spike frequency-treadmill velocity correlation (purple) versus the correlation after shuffling (orange, mean ± 2 SD). (K) Peak correlation versus Z score for the sample population. (L) The spiking rate of the neuron in (H) varied inconsistently over several cycles of velocity change (a, b, and c in H are color coded). (M and N) Frequency (M) and Z score (N) population data for type 2 neurons in Q175 mice. *p < 0.05; ns, not significant.
Figure 6.
Figure 6.. The frequencies and patterns of resting and locomotion-associated type 2 STN neuron activity are similar in WT and Q175 HD mice
(A and B) Population data. The frequencies (A) and Z scores (B) of resting and locomotion-associated type 2 STN activity were similar in WT and Q175 mice. (C and D) Distribution of recorded type 2 STN neurons in WT and Q175 mice. The boundary between the medial third and lateral two-thirds of the STN is denoted by a dashed line. Type 2 units were located throughout the caudal half of the STN in WT and Q175 mice. Type 2 units were (1) more abundant in the medial than the lateral STN of WT mice and (2) more abundant in the medial STN of WT mice than the medial STN of Q175 mice. The distribution of units whose activity was uncorrelated with locomotion is also illustrated (C). (E–I) Type 2 STN neurons in WT and Q175 mice exhibited firing that was unrelated to the phase of the locomotor cycle (E–H, representative examples; I, population data). (I) The number of spikes per locomotor cycle was similar in WT and Q175 mice.*p < 0.05; ns, not significant.
Figure 7.
Figure 7.. Optogenetic inhibition of movement-related STN activity dysregulates locomotion
(A) Positions of the fiberoptics used to deliver 633-nm light to the STN in control eGFP-expressing WT mice (black), eNpHR3.0-eYFP-expressing WT mice (red), and eNpHR3.0-eYFP-expressing vGluT2-Cre mice (green). The boundary between the medial third and lateral two-thirds of the STN is denoted by a dashed line. The histological section used to determine the location of the most lateral fiberoptic in the 2nd panel from the left is illustrated in Figure S6B. (B) Impact of stimulating eNpHR3.0-eYFP in the medial third or lateral two-thirds of the STN on neuronal activity. (C and D) Effects of 633-nm STN light delivery (orange) for 5-s on eGFP- or eNpHR3.0-eYFP-expressing resting mice on treadmill velocity and hindpaw kinematics (C, representative examples; upper trace, treadmill velocity; lower trace, hindpaw x axis displacement; D, population data). (E–J) Representative examples of the effects of 633-nm light delivery (orange) for 5-s on eGFP- or eNpHR3.0-eYFP-expressing mice during locomotion (upper traces, treadmill velocity; lower traces, hindpaw x axis displacement). Relative to the effects of light delivery in eGFP-expressing control mice (E), optogenetic inhibition of the medial STN had no effect on locomotion (F). In contrast, optogenetic inhibition of the lateral STN dysregulated, slowed, and more rapidly terminated locomotion compared to locomotor bouts in control mice (G–J). (K–N) Population data. Compared to the effects of 633 nm light in eGFP-expressing control mice, optogenetic inhibition of the lateral STN reduced the duration of self-initiated locomotor bouts (K). In contrast, optogenetic inhibition of the medial STN had no effect on bout duration (K). Optogenetic inhibition of the lateral STN also increased the duration (L) and reduced the velocity (M) of the contralateral hindlimb’s locomotor cycle, and increased the time between strides (N). *p < 0.05; ns, not significant.

Update of

References

    1. Klaus A, Alves da Silva J, and Costa RM (2019). What, If, and When to Move: Basal Ganglia Circuits and Self-Paced Action Initiation. Annu. Rev. Neurosci. 42, 459–483. 10.1146/annurev-neuro-072116-031033. - DOI - PubMed
    1. Albin RL, Young AB, and Penney JB (1989). The functional anatomy of basal ganglia disorders. Trends Neurosci. 12, 366–375. 10.1016/0166-2236(89)90074-x. - DOI - PubMed
    1. Hannah R, and Aron AR (2021). Towards real-world generalizability of a circuit for action-stopping. Nat. Rev. Neurosci. 22, 538–552. 10.1038/s41583-021-00485-1. - DOI - PMC - PubMed
    1. Mink JW, and Thach WT (1993). Basal ganglia intrinsic circuits and their role in behavior. Curr. Opin. Neurobiol. 3, 950–957. 10.1016/0959-4388(93)90167-w. - DOI - PubMed
    1. Baunez C, Nieoullon A, and Amalric M (1995). In a rat model of parkinsonism, lesions of the subthalamic nucleus reverse increases of reaction time but induce a dramatic premature responding deficit. J. Neurosci. 15, 6531–6541. 10.1523/JNEUROSCI.15-10-06531.1995. - DOI - PMC - PubMed

LinkOut - more resources